Titan Watch | Thursday 11 June 2026 | Post-Close read
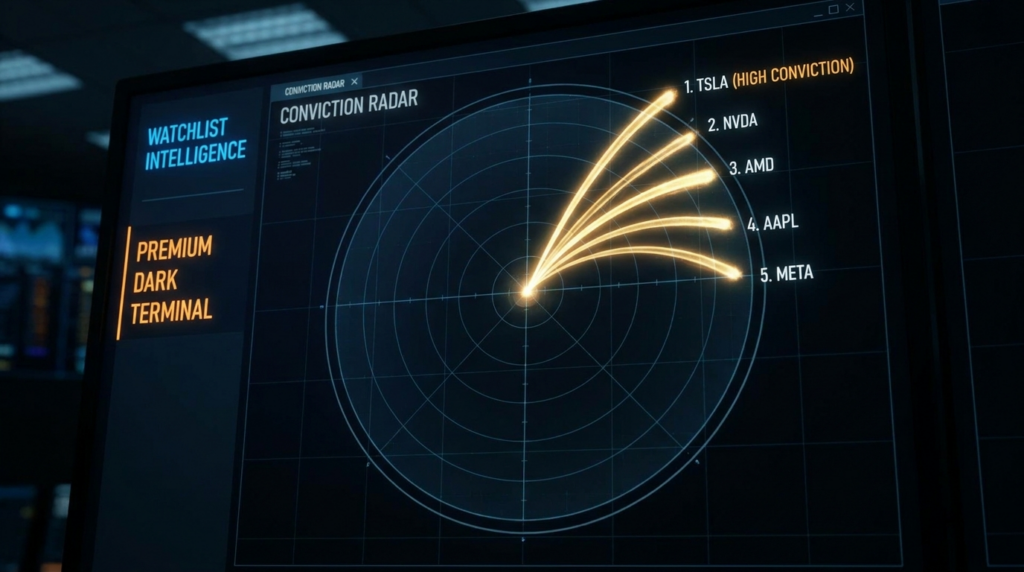
Five opportunities, ranked by conviction and risk-adjusted return. Our analysis converges on a clear hierarchy: crude oil has a physical supply floor that no headline can change overnight. Gold’s margin liquidation is a textbook dislocation that history says resolves within days. The equity short has structural support from negative gamma but maximum headline vulnerability. Yen crosses offer a clean risk-off expression. And the crypto decoupling is worth monitoring but not yet worth capital. This is our ranked watchlist for the next 48 hours.
THESIS
The highest-conviction opportunities sit in opposite directions on traditional risk. That is the signature of a regime change. We are long crude (commodity risk-on) and short equities (macro risk-off) simultaneously, because the Iran crisis benefits energy producers while punishing everyone else. Gold is a timing trade. Yen is a hedge. Crypto is a curiosity. Sizing is REDUCED across the board because conviction about direction does not reduce headline risk.
The Conviction Ranking
| Rank | Opportunity | Direction | Conviction | Edge Source | Sizing |
|---|---|---|---|---|---|
| 1 | Crude Oil (WTI) | Bullish on pullback | 9/10 | Physical supply disruption | REDUCED |
| 2 | Gold Dip-Buy | Bullish (timing) | 8/10 | Margin liquidation dislocation | REDUCED |
| 3 | S&P 500 Short | Bearish below 730 | 7/10 | Negative gamma + positioning | REDUCED |
| 4 | Yen Crosses Short | Bearish USDJPY | 6/10 | Safe-haven flow + short squeeze | REDUCED |
| 5 | Bitcoin (BTC) | Watch only | 4/10 | Decoupling thesis unproven | AVOID |
Rank 1: Crude Oil — The Structural Floor
We ranked crude first because its edge source is unique. Every other trade on this list depends on market sentiment, positioning flows, or technical levels. Crude depends on physics. The Strait of Hormuz is closed. Oil cannot flow through it. Until it reopens, crude has a floor.
The tactical playbook detailed the entry zone at $89-90 with a stop at $86 and targets at $95 and $98-100. The commodity deep dive quantified the 1.2 billion barrel deficit. The macro analysis showed how crude at $92.79 feeds directly into inflation expectations, locking out rate cuts and pressuring equity valuations.
| Crude Oil Factor | Status | Conviction Impact |
|---|---|---|
| Hormuz closure | Confirmed, full shutdown | Extremely bullish |
| Supply deficit (Shell estimate) | 1.2 billion barrels | Structurally bullish |
| SPR / spare capacity | Insufficient to offset | Confirms supply gap |
| Futures contango | Steep and widening | Market expects persistence |
| Diplomatic risk | HIGH — can reverse $10+ | Only reason for reduced sizing |
The single risk is diplomatic. A ceasefire, partial reopening, or Iranian climb-down can reverse the entire move. That is why conviction at 9/10 still means REDUCED sizing. We are not predicting geopolitics. We are trading supply physics with an exit plan. The sentiment analysis found Fear and Greed at 27.5, approaching the contrarian buy zone below 25. If crude pushes above $100 and fear drops into the teens, we would expect a capitulation event that could temporarily reverse both crude and equities simultaneously, as documented in the sector rotation analysis.
Rank 2: Gold Dip-Buy — The Mean-Reversion Opportunity
Gold down 3.89% in a war is the definition of a dislocation. The commodity analysis explained the mechanics. The tactical playbook defined the entry at $4,050-4,100 with a stop at $3,980.
What elevates this to rank 2 is the historical hit rate. Every margin-driven gold liquidation in the past six years has been followed by new highs within weeks. The underlying demand drivers — central bank accumulation, inflation hedging, geopolitical uncertainty — have not changed. The selling is mechanical, not fundamental.
| Gold Dip-Buy Signal | Status | Timing Implication |
|---|---|---|
| Margin calls active? | Yes — equity losses driving forced selling | Wait for exhaustion signal |
| Volume climax? | Not yet confirmed | Watching Thursday’s session for confirmation |
| Safe-haven fundamental? | Intact — war, inflation, central bank buying | Recovery is when, not if |
| Historical recovery time | 1-18 sessions | Patience required; do not front-run |
The honest admission: timing margin liquidation exhaustion is imprecise. We may be one session early or two sessions late. Reduced sizing accommodates both possibilities. The trade works over days and weeks, not hours.
Rank 3: S&P 500 Short — The Gamma Accelerator
Negative gamma across all 10 options symbols. Put/call ratio at 1.071. Max pain at SPY 709. Leveraged speculators net short -482,975 S&P contracts. The institutional derisking is confirmed by every data source we track.
This ranks third, not first, because it carries the most headline risk. A single tweet about a ceasefire can trigger a violent short squeeze. With $90 billion in leveraged ETF volume, the unwind could be spectacular in either direction.
The setup is conditional: it only triggers below SPY 729. Above 736, it is invalidated. The tactical playbook provides the full trade plan.
Rank 4: Yen Crosses — The Hedge
The currency analysis highlighted JPY strengthening as a classic safe-haven response, with leveraged speculators net short -105,136 yen contracts. That short base provides squeeze fuel if risk-off deepens.
| Yen Cross | Current | Direction | Rationale |
|---|---|---|---|
| USDJPY | 148.00 | Lower (JPY strength) | Safe-haven + short squeeze potential to 144 |
| EURJPY | 170.72 | Lower | EUR weakened by energy dependency; double tailwind for JPY |
Yen longs function as a hedge for the entire portfolio. If a ceasefire triggers a relief rally that stops out the equity short, yen longs should also give back gains, creating a natural offset. If escalation continues, yen strengthens as equities weaken, compounding returns.
Rank 5: Bitcoin — Watch, Do Not Trade
The digital flow analysis explored Bitcoin’s remarkable stability at $61,483 while gold crashed. The question is whether this represents genuine decoupling or a 24-48 hour lag before margin contagion hits.
We lean toward the lag interpretation. BTC ETF liquidity makes crypto easy collateral for margin calls. Until we see BTC survive 48 hours of continued equity selling without breaking $60,000, the digital gold narrative remains unproven. This is a monitor, not a position.
The Contradiction That Confirms the Regime
Our top three trades are: long crude, long gold (pending), and short equities. These are in opposite directions on traditional risk. That is not a portfolio conflict. It is a confirmation.
In a normal market, you cannot be long commodities and short equities simultaneously with conviction. In a war-premium market, it is the only positioning that makes sense. Energy producers benefit from higher crude. Equity valuations suffer from higher crude through inflation, rates, and margin compression. Gold recovers once forced selling clears because the war itself is the demand driver.
This regime breakdown is exactly what the inter-market analysis, the sector rotation data, and the volatility explosion all pointed toward. Cross-asset correlations have broken down. Diversification within traditional frameworks is failing. The only diversification that works is understanding which side of the war premium each asset sits on.
Track Record Context
| Metric | Value |
|---|---|
| Directional calls confirmed (Mon-Wed) | 13 of 14 |
| Current streak | 6 consecutive sessions |
| Sizing discipline maintained | REDUCED throughout crisis week |
Thirteen of fourteen directional reads confirmed this week across Monday through Wednesday. That is the standard we hold ourselves to. It does not guarantee Thursday’s trades work. It means the analytical process producing these rankings has been consistent and accurate under crisis conditions.
The tension between the macro pulse and the earnings data is where the watchlist earns its value. The macro analysis documented CPI at 4.2% locking out rate cuts, with crude at $92.79 threatening secondary inflation. That is unambiguously bearish for equity valuations. Yet the earnings echo will show Oracle beating after hours with an 8-10% surge, cloud revenue surging, and AI infrastructure demand intact. If Oracle’s micro strength can overcome the macro devastation, the equity short (rank 3) is the first setup to stop out. If macro overwhelms micro, as it typically does during geopolitical crises, the equity short reaches its $709 max pain target. The dark pool positioning data, with $90 billion in leveraged ETF volume, suggests the institutional answer is clear: they were derisking before the headlines arrived. The institutional flow data showing dealers at -626,173 net short creates the mechanical headwind that makes micro resilience nearly impossible at the index level, even if individual names like Oracle thrive.
Scenarios for Thursday
| Scenario | Probability | What Happens to the Watchlist |
|---|---|---|
| Bull Case | 20% | Gold recovery trade triggers first and fastest. Crude holds above $90. Equities stabilise above 730. Yen gives back safe-haven gains. Net result: gold wins, equity short stops out, crude grinds higher. |
| Sideways | 35% | All setups trigger but grind toward targets slowly. Crude $90-$95 range. Gold $4,050-$4,150 range. SPY 720-735 range. Yen 146-149. Reduced sizing limits portfolio impact. Patience tested. |
| Correction | 45% | Full escalation. Crude above $98. Gold recovers above $4,250 as safe-haven bid reasserts. SPY breaks to 709 on gamma acceleration. Yen strengthens to 144. All five ranked setups move in the expected direction. This is the scenario where reduced sizing is the only regret. |
Risk assessment: around 65%. Conviction is high on individual setups but portfolio-level risk is elevated because correlation breakdown means traditional diversification benefits are reduced. One Iran headline moves everything simultaneously.
Continue Reading
Previously in the sequence:
▶ Dark pool positioning turns defensive — $90B leveraged ETF volume, institutional selling into strength
▶ CPI hits 4.2% as Iran war premium reprices rates — war-driven inflation collides with rate expectations
▶ Fear and Greed drops to 27.5 — AAII bearish 37%, leveraged ETF volume $90B
▶ VIX surges to 22.22 on negative gamma — VVIX 108, negative GEX universal
▶ S&P 500 breaks below 7,300 — key levels breaking, NQ below 28,800
▶ Energy and defence surge as tech rotates — energy only positive sector, rotation to defence
▶ Global markets tumble on Hormuz closure — Nikkei most exposed, FTSE outperforming
▶ Asset managers hold 982K long vs 482K short — dealer derisking divergence
▶ Negative gamma across all 10 options symbols — max pain SPY $709, VIX calls +56%
▶ Sector rotation into energy and defence — energy surge, tech distribution
▶ Futures basis widens on crude contango — Treasury paradox, equity discount
▶ Dollar strengthens as yen surges — 105K yen short squeeze, DXY dual tailwind
▶ Bitcoin holds $61,483 despite risk-off — resilience vs gold crash
▶ Crude surges while gold crashes — Hormuz premium, margin liquidation
▶ Three war-premium setups with defined risk — crude long, gold watch, equity short
Analysis, not financial advice. Always manage your own risk. Published by Alpha Insights, 11 June 2026.
Deepen Your Understanding
Related articles from the Titan Protect Foundry: