Updated 06:01 GMT, 1 Nov 2026 SPX 7,580.07 -1.82% NDX 28,384.85 -3.46% VIX 19.42 +12.91% GOLD 3,898.90 -3.29% CL 104.12 +2.08% BTC 77,765.00 +0.73%
Members TradingView indicator

[TP] Options Levels

Where the options market is positioned, drawn on your chart and read in plain words: the gamma flip, the call wall, the put wall and max pain, with why price may react there, where the next wall sits, and what would change the read.

Options levels are easy to find and easy to misread. A wall is not a floor that must hold, and the gamma flip is not a line price must respect. This one shows the levels from our options data, made once a day after the US close, and says in a sentence what each one means for the chart you have open, including the close that would prove the read wrong.

Full version for members on TradingView from 13 Nov. Free Lite version in December.

How to read it

It comes with the nightly levels, the read and the morning nearest-expiry set. Join the waitlist to hear first.

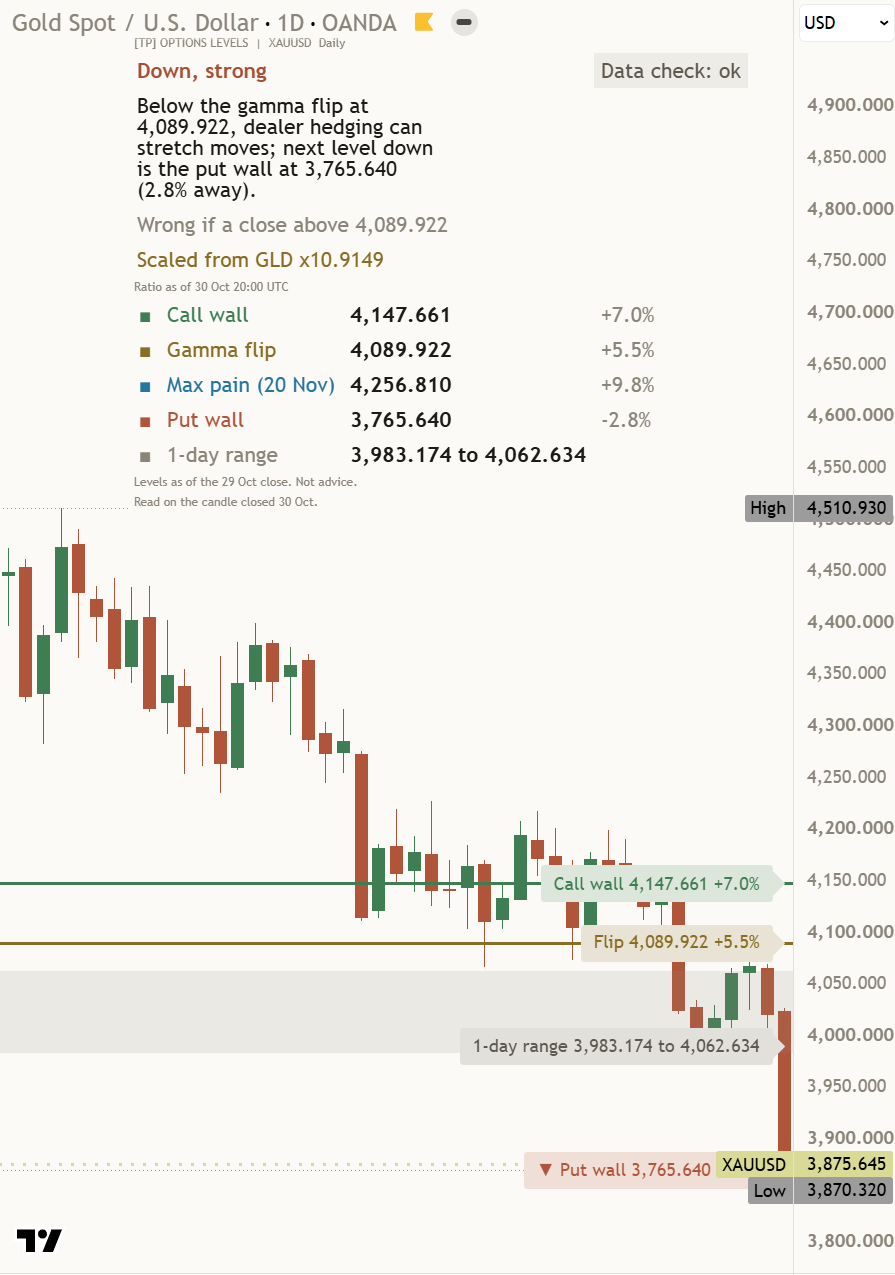
Options Levels card on a gold daily chart, levels scaled from GLD: Down, strong, below the gamma flip at 4,089.922, with the call wall, gamma flip, max pain, put wall and 1-day range in a table and drawn on the chart.
Gold (XAUUSD) daily, levels scaled from GLD, captured on 1 Nov 2026 on the private build, with display settings changed from the defaults (panel moved off the candles). A real chart, an example only, not a recommendation.

What it is in 30 seconds

It draws the levels options traders talk about and tells you, in plain words, what they mean for price right now. It is a map of positioning from the last close. It does not say what comes next.

Where positioning sits

The gamma flip, the call wall, the put wall and max pain, with how far each sits from the last closed candle in percent.

Why price may react

Every read names the mechanism in plain words: how dealer hedging is assumed to lean on one side of the flip and stretch moves on the other.

What changes the read

Every read ends with the level that would change it and a Wrong if line, so you know where the picture no longer holds.

Made once a day. The card says when.

Open interest, the count of option contracts still open, is published once a day. So the levels are made once a day too, from our options data after the US close, and every card carries the close they describe: "Levels as of the 29 Oct close. Not advice." Nothing on the card claims to be a live price.

  1. 1. Stamped with its closeThe as-of line names the close the levels come from. If a whole trading session passes without an update, the card says "Levels are from 29 Oct, not updated." and the lines grey out.
  2. 2. A morning set for the nearest expiryOn weekdays a smaller run before the US open refreshes the nearest-expiry call, put and flip levels from that morning's open interest. On the day of that expiry they are the 0DTE set.
  3. 3. Held back, never guessedEvery row passes a data check each night. A market whose data did not pass is held back and the card says so: "We show nothing, not a doubtful level."
Closed candles only

Distances and the read use the last closed candle on your chart, so the card does not change while a candle is still forming.

Dealer side assumed

Nobody publishes who holds each contract. The levels assume the usual dealer side, and the card says so: "Dealer side is assumed, not reported."

A map, not a forecast

Levels show where positioning sat at the last close. Price can go straight through any of them, and new positions change them the next day.

Each part, up close

Every quote below is the card's own text on the private build that will be released, captured on 30 Oct 2026 with levels as of the 29 Oct close. Chart and market are named with each one.

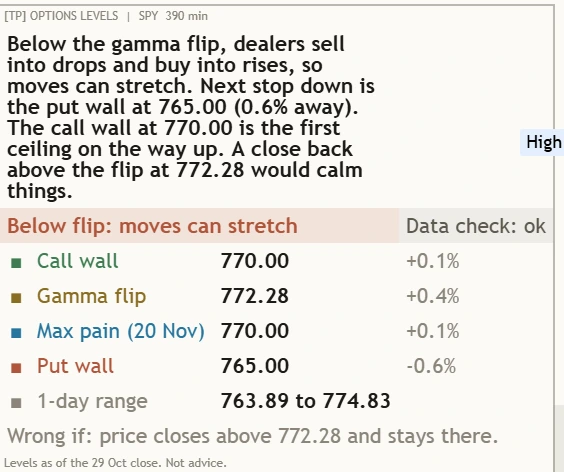
The [TP] Options Levels card on SPY, 390 minutes. Headline: Below the gamma flip, dealers sell into drops and buy into rises, so moves can stretch. Next stop down is the put wall at 765.00 (0.6% away). The call wall at 770.00 is the first ceiling on the way up. A close back above the flip at 772.28 would calm things. Pill: Below flip: moves can stretch. Data check: ok. Rows: call wall 770.00, gamma flip 772.28, max pain (20 Nov) 770.00, put wall 765.00, 1-day range 763.89 to 774.83. Wrong if: price closes above 772.28 and stays there.

The read

The headline is one plain sentence with three parts. Why: what dealer hedging is assumed to do on this side of the flip. Where: the next wall in the direction of the read, with its distance. What changes it: the level that would turn the read.

On SPY above (390 minutes, levels as of the 29 Oct close): "Below the gamma flip, dealers sell into drops and buy into rises, so moves can stretch. Next stop down is the put wall at 765.00 (0.6% away). The call wall at 770.00 is the first ceiling on the way up. A close back above the flip at 772.28 would calm things."

Under the rows, Wrong if gives the close that breaks it: "Wrong if: price closes above 772.28 and stays there."

Back to the guide
The pill and the data check

A short pill sums up the read in the colour of its side: "Above flip: calmer, dips bought", "Below flip: moves can stretch", or "At flip: either way" when the last close sits within 0.25% of the flip. When gamma is one sign across the whole range there is no flip to draw, and the pill says "No flip: moves can stretch" or "No flip: calmer range".

Beside it, "Data check: ok" means every guard in the nightly run passed for this market. A market that did not pass is not drawn at all.

Back to the guide

 The gamma flip

The price where dealer hedging is assumed to switch sides. In the card's own words: "Above it dealers sell rises and buy dips, so moves stay calmer. Below it they sell drops and buy rises, so moves can stretch."

It is an estimate from the open option positions at the last close, so it moves a little every day. The read uses it as the dividing line, and the Wrong if close is usually the flip itself.

Back to the guide

 The call wall

The strike with the most call positioning above price. "Price often stalls near it." Often, not always: a wall is where hedging is heaviest, not a ceiling that must hold. When price is already past it, the read says so: "Price is already past the call wall at ..., where gains tend to fade back."

Back to the guide

 The put wall

The strike with the most put positioning below price. "Price often finds support near it." When a wall sits between price and the flip, the read names it first, as on SPY: "The call wall at 770.00 is the first ceiling on the way up."

Back to the guide

 Max pain

The strike where option holders lose the most at the named expiry, shown with that expiry: "Max pain (20 Nov)". Some traders watch it in the days before a large expiry. It carries the least weight of the four, and the card never builds a read on it alone.

When two levels sit at the same price they share one label, as on both charts here: "Call wall + max pain 770.00 +0.1%" on SPY. Their lines stay separate.

Back to the guide
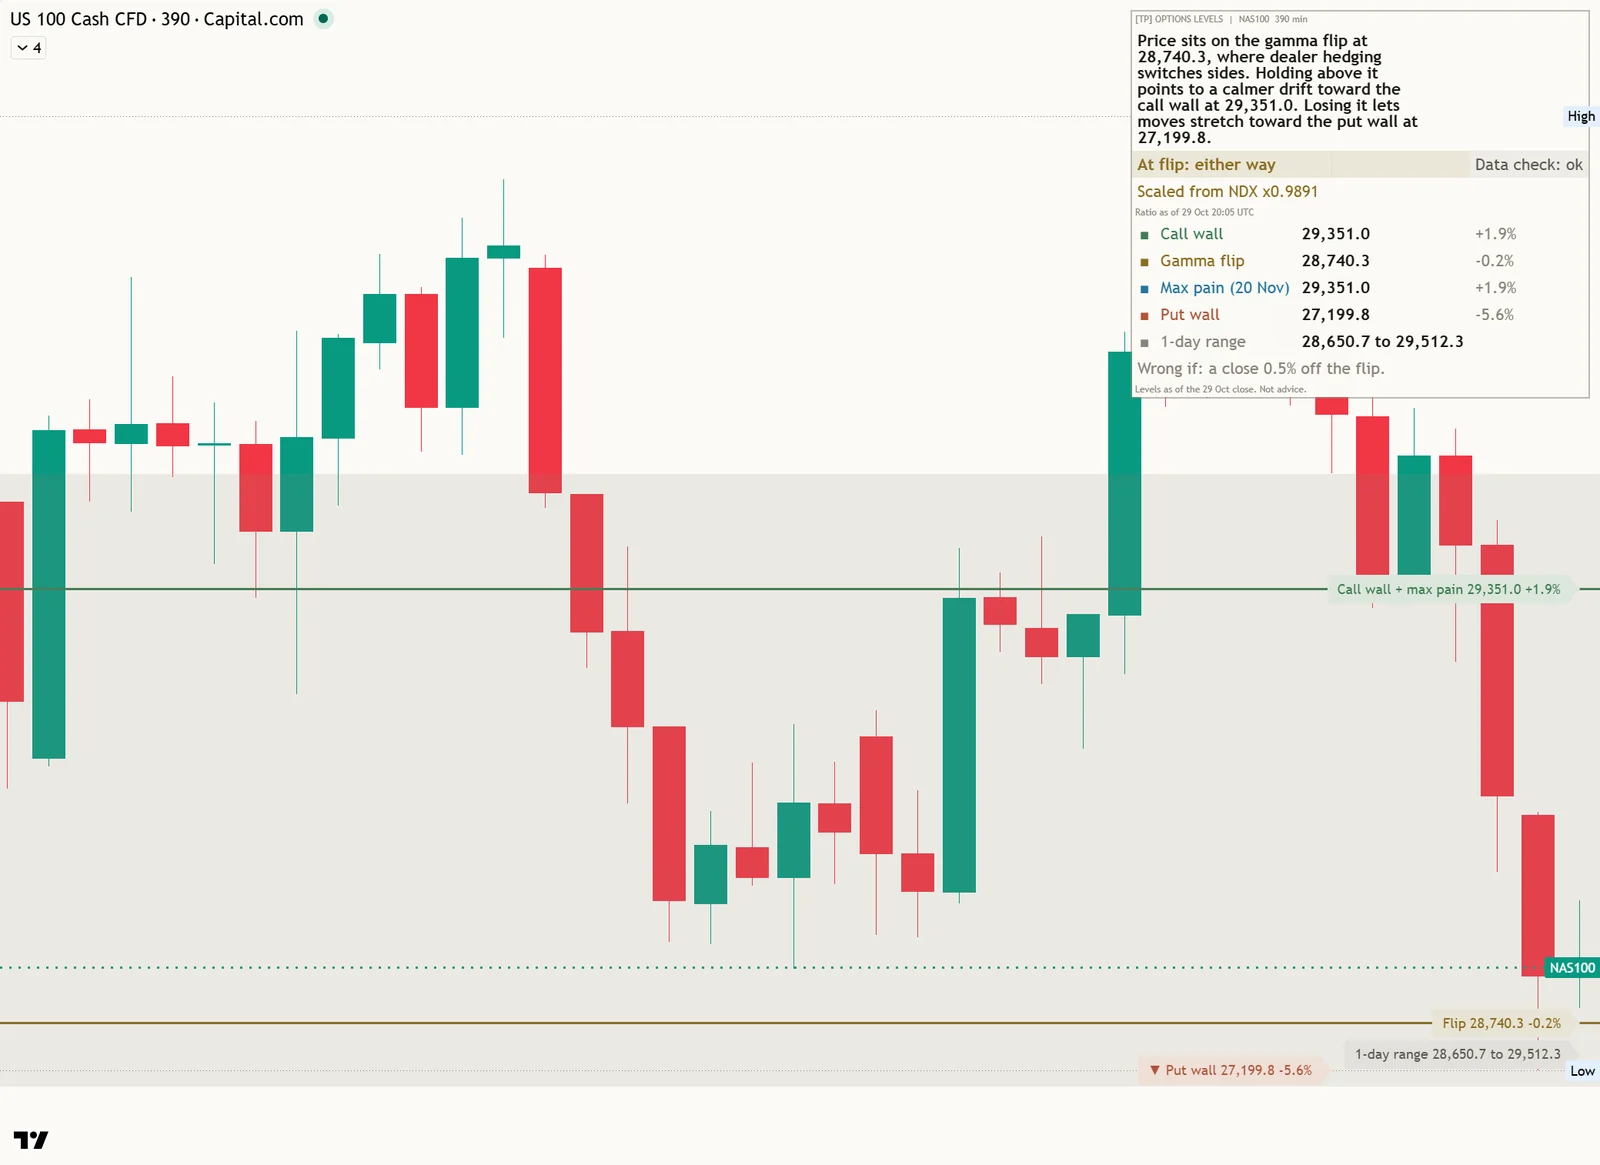
A light NAS100 CFD chart on the 390 minute timeframe with the [TP] Options Levels card at the top right. A shaded band covers the 1-day range from 28,650.7 to 29,512.3, a gold line marks the gamma flip at 28,740.3 just under price, a green line marks the call wall and max pain together at 29,351.0, and the put wall at 27,199.8 sits at the bottom edge. The card says the levels are scaled from NDX at a ratio of 0.9891.

 The 1-day range

A light band between the expected low and high for one day: price plus or minus the at-the-money implied move. "Not a limit." On NAS100 above it ran from 28,650.7 to 29,512.3 for the session after the 29 Oct close.

Back to the guide
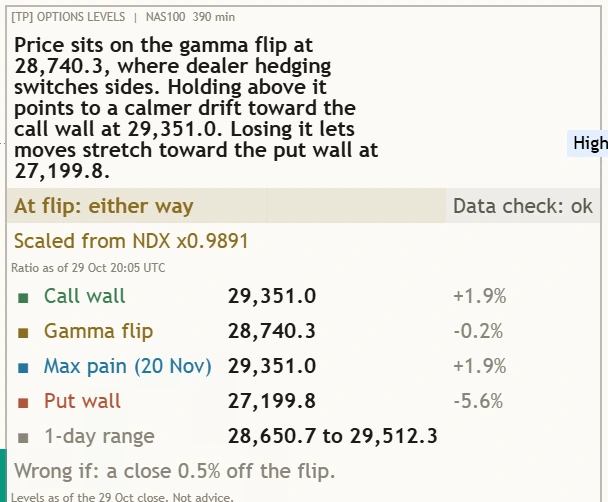
The [TP] Options Levels card on NAS100, 390 minutes. Headline: Price sits on the gamma flip at 28,740.3, where dealer hedging switches sides. Holding above it points to a calmer drift toward the call wall at 29,351.0. Losing it lets moves stretch toward the put wall at 27,199.8. Pill: At flip: either way. Scaled from NDX x0.9891, ratio as of 29 Oct 20:05 UTC. Wrong if: a close 0.5% off the flip.

Scaled rows and the as-of line

Futures and CFDs have no option chain of their own in our data, so their levels come from the cash index or ETF, scaled at the price ratio between the two. The card says so in the first rows: "Scaled from NDX x0.9891" and "Ratio as of 29 Oct 20:05 UTC". Hover it: "Not futures-option data. The ratio moves with the basis and at contract roll."

The ratio is taken once, at the last close of the index's regular session, from closed candles of both markets, so it does not drift between loads. ES and MES scale from SPX, NQ and MNQ from NDX, gold from GLD, and the card names the source each time. If no close lines up, it says "Ratio unavailable" and draws nothing.

The last line is the as-of line: "Levels as of the 29 Oct close. Not advice."

Back to the guide

Two card views

Compact (default)

The read, the pill and data check, the four levels with distance, the 1-day range, Wrong if, and the as-of line.

Full

Everything in Compact, plus the nearest-expiry call and put, "What changes this" ("The next update of open interest, the 20 Nov expiry weighing most, or a gap past the walls"), and the method: when the run was made, which day's open interest it used, and "Dealer side is assumed, not reported. A map of positioning, not a forecast."

The reads it gives

Each read is a sentence about the levels on this chart, with prices from this chart. It says where price sits against the positioning, never what to do.

Above the flip

"Above the gamma flip, dealers sell rises and buy dips, so moves tend to stay calm."

Then the room up to the call wall, where rises tend to stall, and how far dips tend to find buyers: down to the flip.

Below the flip

"Below the gamma flip, dealers sell into drops and buy into rises, so moves can stretch."

Then the next wall down with its distance, any wall in the way back up, and the close back above the flip that would calm things.

On the flip

"Price sits on the gamma flip at 28,740.3, where dealer hedging switches sides."

Within 0.25% of the flip the read names both paths, toward the call wall or toward the put wall, and the Wrong if is a close 0.5% off the flip.

No flip in range

"Gamma is negative across the whole range, so dealers chase the move and swings can stretch."

Sometimes gamma has one sign at every strike in range. The card says so instead of drawing a flip that is not there, and names the walls to watch.

Two charts, one evening's levels

The same build, the same night's data (the 29 Oct close), captured on 30 Oct 2026. One market below its flip, one sitting on it.

[TP] OPTIONS LEVELS | SPY 390 min Below the gamma flip, dealers sell into drops and buy into rises, so moves can stretch. Next stop down is the put wall at 765.00 (0.6% away). The call wall at 770.00 is the first ceiling on the way up. A close back above the flip at 772.28 would calm things. Below flip: moves can stretch | Data check: ok Wrong if: price closes above 772.28 and stays there. Levels as of the 29 Oct close. Not advice.
SPY closed just under its flip with the call wall and max pain in between, so the read names the call wall as the first ceiling and the flip as the level that calms things.
[TP] OPTIONS LEVELS | NAS100 390 min Price sits on the gamma flip at 28,740.3, where dealer hedging switches sides. Holding above it points to a calmer drift toward the call wall at 29,351.0. Losing it lets moves stretch toward the put wall at 27,199.8. At flip: either way | Data check: ok Scaled from NDX x0.9891 Wrong if: a close 0.5% off the flip. Levels as of the 29 Oct close. Not advice.
NAS100 sat 0.2% from its flip, so the read gave both paths and a Wrong if on either side. The levels are the NDX levels scaled to the CFD.
Where, why, what changes it

No direction without a level, a reason and the close that would turn it. That rule runs through every read the card can give.

Words, not scores

There are no odds, no scores and no win rates on the card. Distances are in percent from the last close, and the rest is in words.

Your market, scaled honestly

Trade the CFD or the future? The card scales the index levels to your price and tells you the ratio and when it was taken.

How it helps you at every level

Same indicator, same card. What you take from it grows with you. The quoted lines are the card's own words.

  1. Level 1

    Beginner

    What gets in the way

    • Hearing "gamma" and "walls" with no idea what they mean.
    • Treating a wall as a price that must hold.
    • Not knowing how old a level is.

    The habit it builds: name the nearest wall and the flip, and check the as-of date first.

    What it says

    As-of line (SPY, 29 Oct close)"Levels as of the 29 Oct close. Not advice."

    Call wall tooltip"Price often stalls near it."

  2. Level 2

    Intermediate

    What gets in the way

    • Knowing the flip exists but not why it matters.
    • Expecting the same behaviour on both sides of it.
    • No level that says the picture has changed.

    The habit it builds: ask which side of the flip price is on before you expect calm or stretch.

    What it says

    Pill (SPY, 29 Oct close)"Below flip: moves can stretch"

    Wrong if (SPY, 29 Oct close)"Wrong if: price closes above 772.28 and stays there."

  3. Level 3

    Advanced

    What gets in the way

    • Reading index levels straight onto a future or CFD.
    • Ignoring which expiry a level belongs to.
    • Treating the nearest expiry like the monthly.

    The habit it builds: know where each level comes from, which expiry weighs most, and the ratio behind a scaled price.

    What it says

    Scaled row (NAS100, 29 Oct close)"Scaled from NDX x0.9891"

    Max pain row"Max pain (20 Nov)"

  4. Level 4

    Expert

    What gets in the way

    • Treating an assumed dealer side as a known one.
    • Forgetting that open interest is a day old.
    • Reading positioning as a forecast.

    The habit it builds: a steady second pair of eyes that states its limits every time.

    What it says

    Method row (Full card)"Dealer side is assumed, not reported. A map of positioning, not a forecast."

    At the flip (NAS100, 29 Oct close)"Wrong if: a close 0.5% off the flip."

Three things to remember

  1. A wall is where hedging is heaviest, not a wall of stone. Price often stalls near one. It can also go straight through.
  2. Every read has a Wrong if. Look at it first. It tells you where the read no longer holds.
  3. The levels describe the last close. New positions and a passing expiry change them, and the card always says which close it shows.

Honest about the data, honest about limits

What dealer hedging is

Firms that make markets in options usually hedge the stock or index exposure their option positions create. When their gamma is positive, that hedging leans against moves: they trim into rises and add into dips. When it is negative, the hedging goes with the move and can stretch it. The gamma flip is the price where one turns into the other, on our estimate.

What it is not

It is not a reported position. Nobody publishes which side of each contract dealers hold, so the levels assume the usual side. It is not a force that decides price: news, earnings and plain supply and demand can swamp it. And it is not a forecast.

The limits of open interest

Open interest is counted once a day and arrives a day old. It shows how many contracts are open, not who holds them or why. Contracts opened and closed on the same day never show up in it, and a large expiry can remove a level overnight.

What it does not do

No arrows, no odds, no live prices, and no claim about what comes next. Markets with thin or doubtful option data are held back rather than drawn. The levels work on US stocks, ETFs and indexes from our list, and on their futures and CFDs by scaling.

Settings

The defaults work out of the box. These are the ones worth knowing.

On a small screen, swipe the table sideways to see every column.
SettingWhat it doesDefault
Levels shownPrimary draws the call wall, the gamma flip and the put wall, with the 1-day range. All levels adds max pain, the nearest-expiry set and the strike ladder.
PrimaryAll levels
Primary
Merge levels closer than (% of price)Levels this close share one label. Their lines stay separate. Hover a label for the full names.0.06
Show 1-day expected range / Show distance on labelsThe light band for the one-day implied move, and the percent distance from the last closed candle on each label.On; On
Show nearest-expiry set / Show strike ladderWith All levels: the call, put and flip from the nearest expiry alone, and bars at the five strikes with the most net gamma for it. The ladder needs empty space right of the last candle.On; Off
Label sizeHow the level labels are drawn.
TinySmallNormal
Normal
Show Mentor / Panel detail / Panel text size / Panel positionCompact or Full card. Top Right by default, clear of other panels on the left. Use Small text on phones.
CompactFull
Top RightTop LeftBottom LeftAuto
On; Compact; Normal; Top Right
Panel background / Theme / Line width in charactersSolid, Tint or See-through; Auto follows the chart background (Paper on a light chart, Ink on a dark one); rows wrap at 38 characters so the card stays narrow on a phone.Solid; Auto; 38
Source index overrideAuto matches the chart symbol by name. Using a CFD with another name? Pick the index it follows and its levels are scaled to your price. Off turns the name matching off.
AutoSPXNDXDIAIWMGLDOff
Auto

Every setting has a small (i) next to it. Hover over it, or tap it on a phone, and it explains that setting in plain English, right there on your chart.

Learn more

Start with the lesson, then the deeper Foundry lessons it builds on.

Watch it explained

Coming soon Video, about 2 minutes

How to read [TP] Options Levels

Every part of the indicator on a real chart: the flip, the walls, max pain, the 1-day range, and the read with its Wrong if.

Coming soon Video, about 2 minutes

Gamma flip and walls, explained plainly

What dealer hedging is and is not, why one side of the flip is calmer, and the limits of open interest. Concept first, then the indicator.

The Titan suite

Positioning here, the rest of the picture there

Options Levels reads one thing: where options positioning sits. The suite reads momentum, volume, trend structure and flow, in the same plain-English voice.

See the full suite
Get it

Join the waitlist

Full version for members on TradingView from 13 November 2026. Free Lite version in December. Leave your email at the top of this page and we will tell you the day it is ready.

Members from 13 Nov: get notified

One concept, read well

Options Levels reads one thing: where options positioning sits. The free Mentor indicators, [TP] RSI - Mentor, [TP] Volume - Mentor, [TP] Market Structure - Mentor, [TP] Trend - Mentor, [TP] VWAP - Mentor, [TP] Fibonacci - Mentor, [TP] MACD - Mentor, [TP] Bollinger Bands - Mentor, [TP] Regime - Mentor, [TP] Market Board - Mentor, [TP] Order Blocks - Mentor, [TP] Support and Resistance - Mentor, [TP] Volume Profile - Mentor and [TP] Elliott Wave - Mentor, each read one other thing deeply, for free. Markets rarely move on one thing. The full Titan suite reads them together: momentum, volume, trend structure and flow, combined into one plain-English read.

Questions

How do I get it?

[TP] Options Levels is for members on TradingView from 13 November 2026, with the nightly levels and the morning nearest-expiry set. A free Lite version follows in December. Join the waitlist at the top of this page to hear first.

Are these live prices?

No. The levels are made once a day from our options data after the US close, plus a smaller morning run for the nearest expiry. The card names the close they describe, and greys out with a note if a whole session passes without an update.

Does it repaint?

The levels are fixed for the day they describe. Distances and the read use the last closed candle on your chart, and the futures ratio is taken on closed candles, so nothing changes while a candle is forming.

Which markets does it cover?

US stocks, ETFs and indexes on our nightly list, including SPY, QQQ, SPX, NDX, IWM, DIA and GLD, plus their futures and CFDs (such as ES, NQ, US500 and NAS100) by scaling. A market whose data did not pass the nightly checks is held back that night. Elsewhere the card says "No options levels for this market."

Why are futures levels "scaled"?

Our data reads index and ETF option chains, not futures options. A future or CFD trades at a slightly different price from its index, so the card multiplies the index levels by the price ratio between the two, taken at the last close of the index session, and names that ratio and its time. It is not futures-option data, and the card says so.

Do dealers really hold these positions?

Nobody knows exactly. Open interest shows how many contracts are open, not who holds them. The levels assume the usual dealer side, as most published gamma levels do, and the card says "Dealer side is assumed, not reported."

Does it tell me when to act?

No. It describes where options positioning sat at the last close, why price may react near it, and where its read would be wrong. It cannot see what comes next. Decisions stay with you.

Get our weekly market brief free.