Updated 06:01 GMT, 1 Nov 2026 SPX 7,580.07 -1.82% NDX 28,384.85 -3.46% VIX 19.42 +12.91% GOLD 3,898.90 -3.29% CL 104.12 +2.08% BTC 77,765.00 +0.73%
Members TradingView indicator

Cup and Handle Pattern Indicator and Plain-English Guide

The cup and handle, checked against the textbook rules on finished candles. A rounded cup, the handle, the breakout level and one cup depth, drawn on the chart. When a pattern falls short, it names the first rule it failed.

Most cup tools either draw by hand-picked examples or find a cup with no handle and no rules. This one tests every candidate against named settings, says which candle it first became known on, keeps failed patterns on the chart in grey, reads the inverse too, and gives a plain read on top: Up, Down or Sideways, how strong, why, and the price where that read would be wrong.

Full version for members on TradingView from 17 Nov. Free Lite version in December.

--days--hours--mins--secs

How to read it
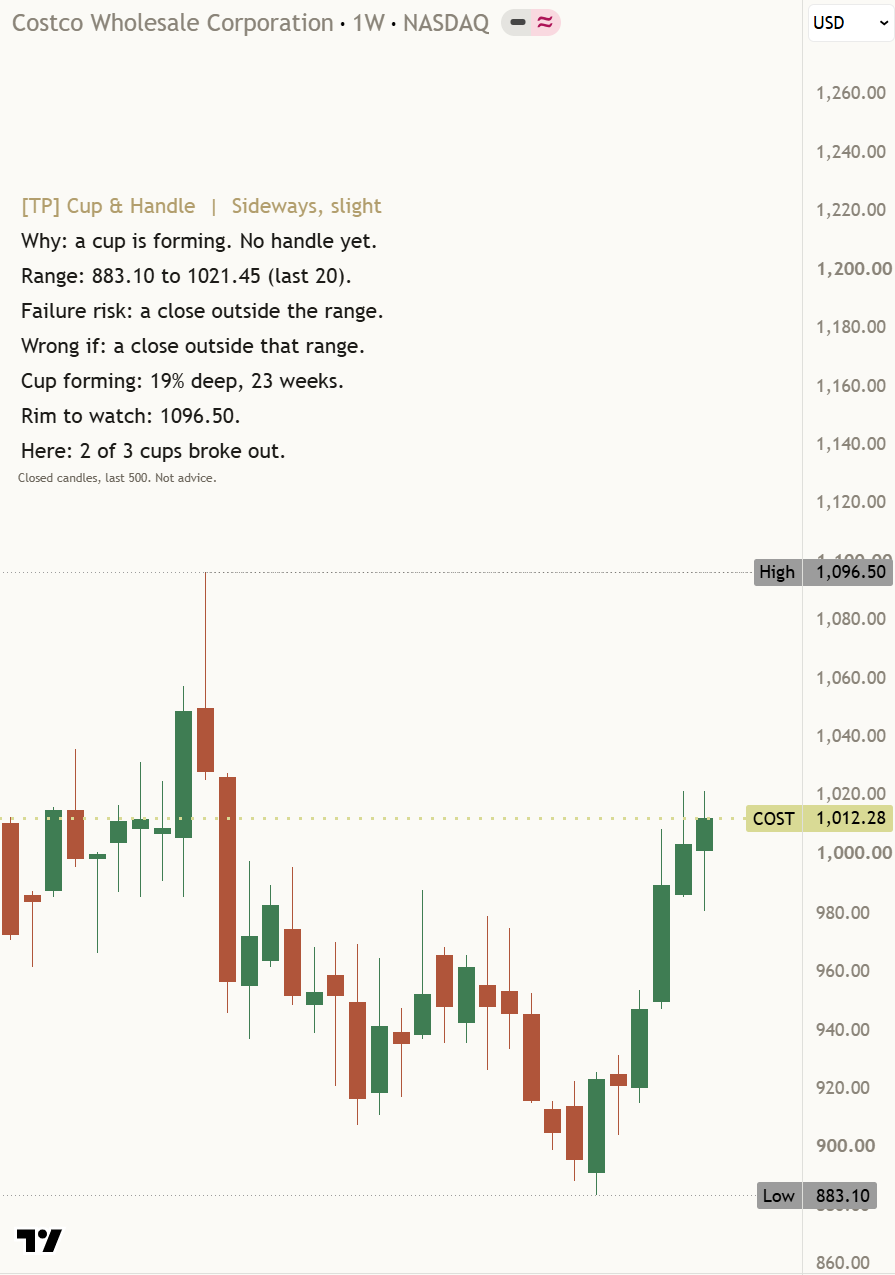
Cup and Handle panel on a Costco weekly chart: Sideways, slight, a cup is forming with no handle yet, 19% deep over 23 weeks, rim to watch 1096.50, range 883.10 to 1021.45.
Costco (COST) weekly, captured on 1 Nov 2026 on the private build, with display settings changed from the defaults (panel moved off the candles). A real chart, an example only, not a recommendation.

What it is in 30 seconds

It looks for the cup and handle the way the textbook describes it, and its mirror, the inverse. It draws what it finds, names the rule that a near miss failed, and tells you in plain words what price is doing. It describes what has happened on this chart. It does not say what comes next.

The textbook, as settings

Cup depth 12 to 33 percent, 7 to 65 weeks long, a rounded bottom, a handle in the upper half that drifts, a prior advance, and volume that dries up. Each rule is a named setting: "A setting, not a law."

Honest about timing

A cup is only known once its bottom is behind it, and a handle only once the right rim is in. Every pattern says when it became known, and every mark sits on the finished candle that settled it.

A read, with its exit sign

The header always gives a read, Up, Down or Sideways, with its strength in words, a reason, the main risk, and the price where the read would be wrong. It changes only after two finished candles agree.

Why you can trust what it drew last year

Pattern tools have three habits that make their past charts look better than they were. Here is each one, and what this indicator does about it.

  1. 1. Patterns seen too earlyA cup's low is only a low once price has climbed away from it. Tools that draw the cup from the low on the day it happened are using candles they could not have seen. Here a cup counts only once its depth passes and a close leaves the lower third, and each pattern carries "Known from" with that date.
  2. 2. Hand-picked examplesSome cup tools show pictures they drew by hand. This one draws only what its rules found, the same way on every chart, and when nothing passes it says so: "No base to read now."
  3. 3. Failures wipedA cup that broke out and fell back, or a handle that sank too deep, is the part other tools delete. Here a failed pattern stays on the chart in grey, its failed break stays as a square, and the count on the panel includes it.
Finished candles only

The cup, the handle, the breakout, the read and every alert wait for the candle to close. A candle still forming can change nothing on the panel.

A weekly and daily pattern

Cups take weeks to form. Below one hour the tool draws nothing unless you turn on "Run below 1 hour", and the panel says why: "Why: cups are a weekly and daily pattern."

Check it yourself

Open Bar Replay and step one candle at a time. The cup appears only when it is known, the handle box only when the right rim is in, and nothing that was drawn disappears except the oldest past patterns making room.

Each part, up close

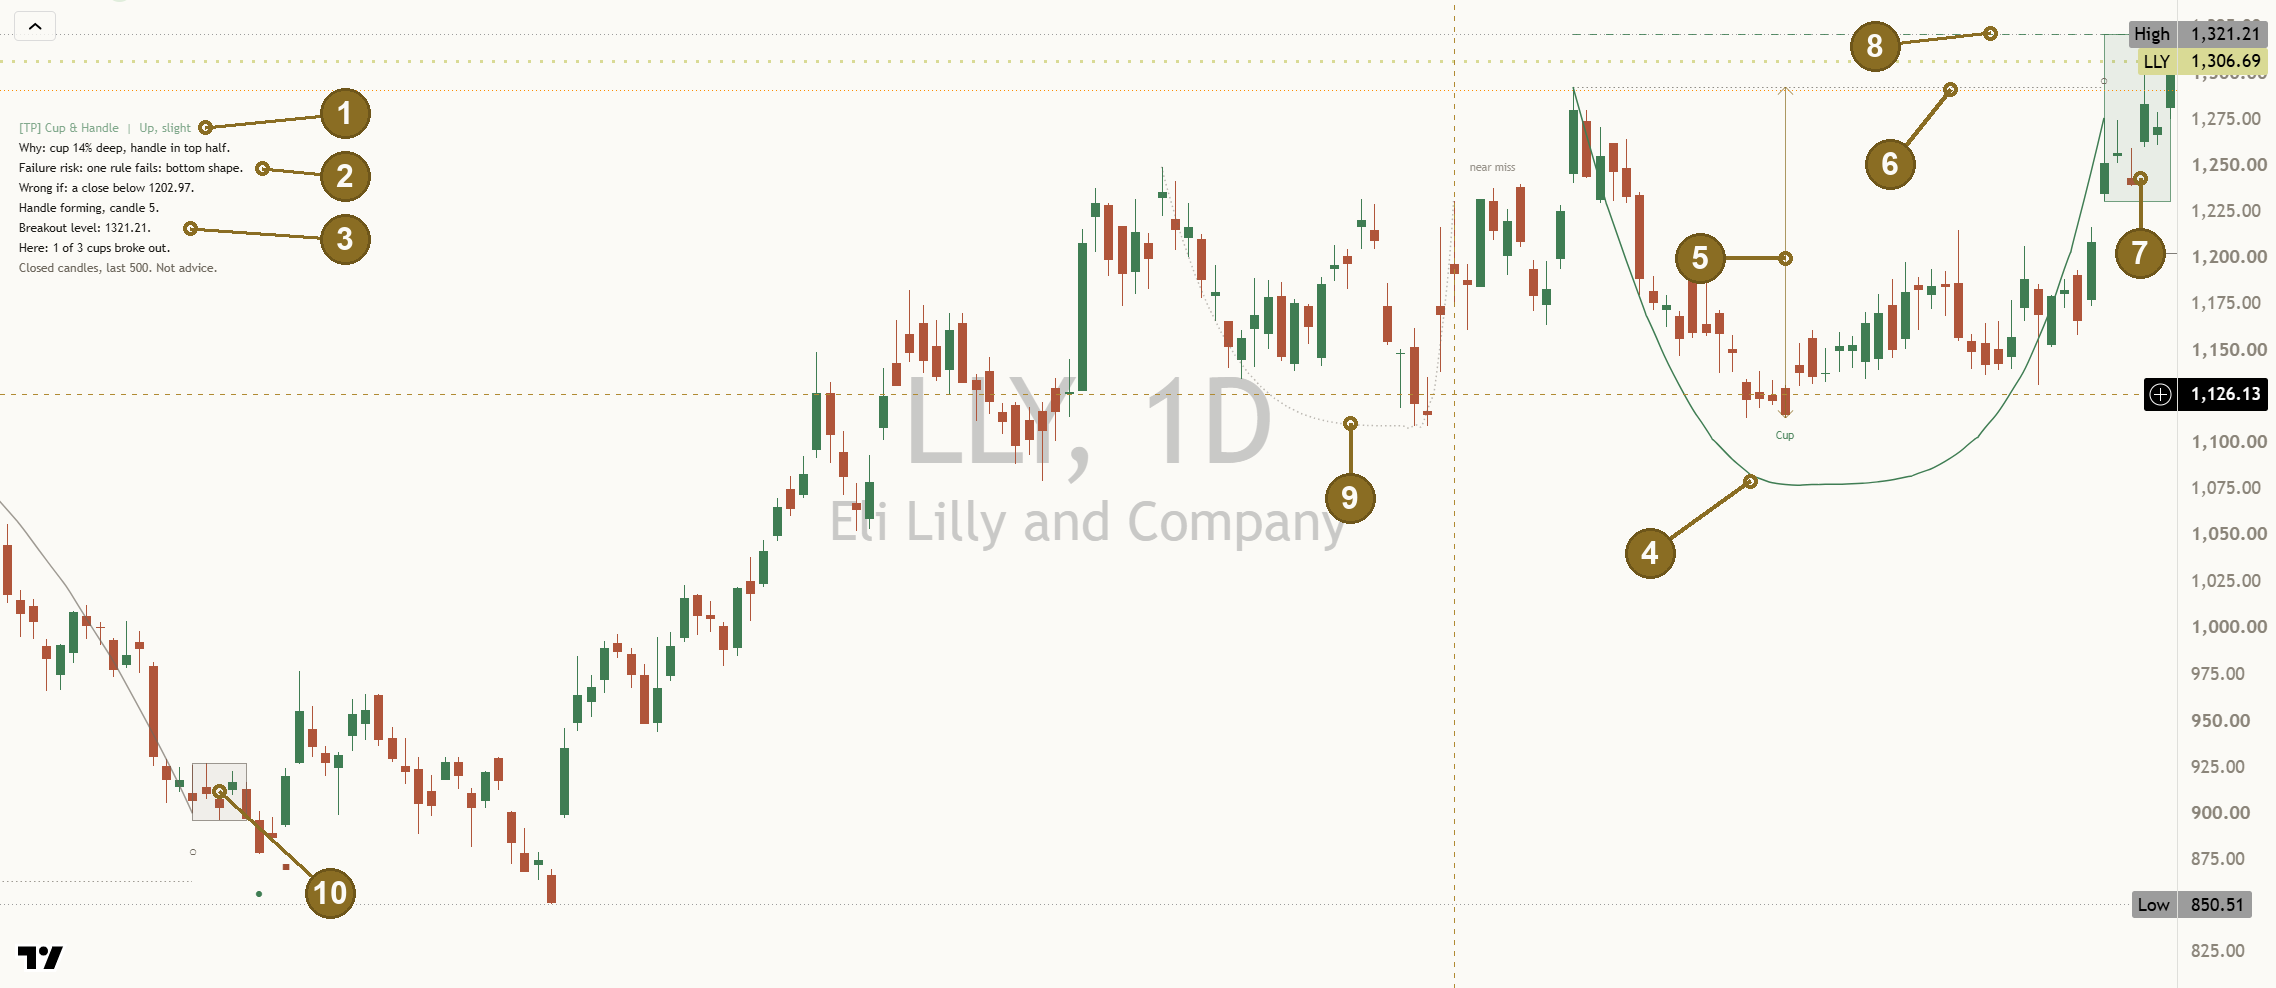
The panel quotes below are from the Eli Lilly daily chart in the guide, read on 23 Oct 2026 with a handle forming.

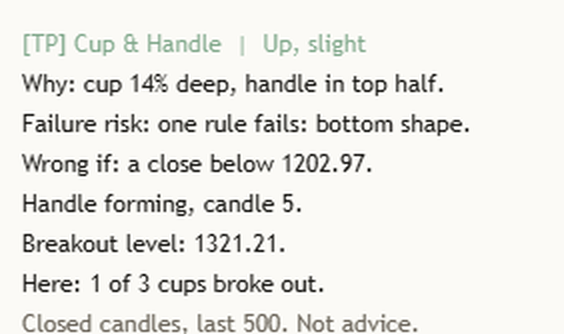
Close-up of the Mentor panel on a light chart: Cup and Handle, Up, slight; Why: cup 14% deep, handle in top half; Failure risk: one rule fails: bottom shape; Wrong if: a close below 1202.97; Handle forming, candle 5; Breakout level: 1321.21; Here: 1 of 3 cups broke out.

The read

The header always names the most likely outcome: "[TP] Cup & Handle | Up, slight". Up, Down or Sideways, with the strength in words: slight, moderate or strong. It never says "no clear lean".

While a handle forms the read is Up (a dome's handle: Down): moderate when all five cup rules pass, else slight. After a breakout, strength counts how many of the pattern's own live rules agree, and with no volume on the symbol it can be moderate at most. With no handle live, the read follows the price trend and the cup is only context. It is agreement, not odds.

The read changes only when the new read has held for 2 finished candles in a row ("Closes to confirm a read change", 1 to 5).

Back to the chart
The same panel close-up: the Why, Failure risk and Wrong if rows.

Why, the risk, and Wrong if

"Why: cup 14% deep, handle in top half." names what the read rests on. The risk line names the weakest part: "Failure risk: one rule fails: bottom shape." Here the cup passed its other rules but spent too little time near its low to count as rounded, and the panel says so instead of hiding it.

"Wrong if: a close below 1202.97." While the handle forms, Wrong if is the handle floor: a close past it breaks the handle's rules. After a breakout it moves to the breakout level, so a close back under it is a failed break.

Back to the chart
The same panel close-up: Handle forming, candle 5; Breakout level: 1321.21; Here: 1 of 3 cups broke out.

State, level, and this chart's count

"Handle forming, candle 5." says where the pattern is. "Breakout level: 1321.21." is the handle's high on this chart. "Here: 1 of 3 cups broke out." counts this chart's finished cups in the last 500 candles, failures included.

A strict cup is rare, so the count is often small or empty: "Here: none yet in 500 candles." or "Too few here to count yet (1)." It says that out loud rather than show a number that would mean little.

Back to the chart
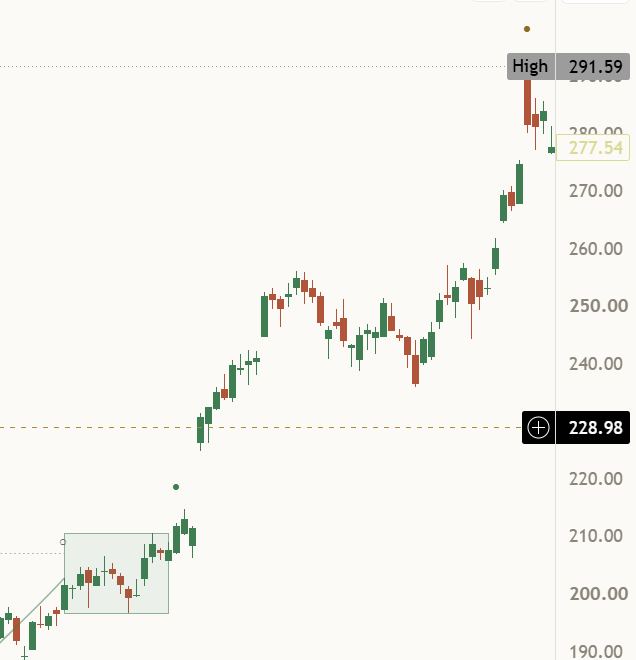
Close-up of the Alphabet daily chart after its 2025 cup: the right end of the arc, the handle box, a small ring where the handle began, a filled circle above the box where price closed above the breakout level, and a small gold dot higher up where one cup depth was reached.

The cup

The cup is drawn as one smooth rounded arc from rim to rim, with its lowest point at the cup low, sitting under the candle bodies (wicks may poke through). The inverse draws the same arc flipped over the highs: a dome.

The arc is a picture of the shape, worked out once when the handle forms and kept as it was. The rules, not the drawing, decide whether the cup counts.

Back to the chart
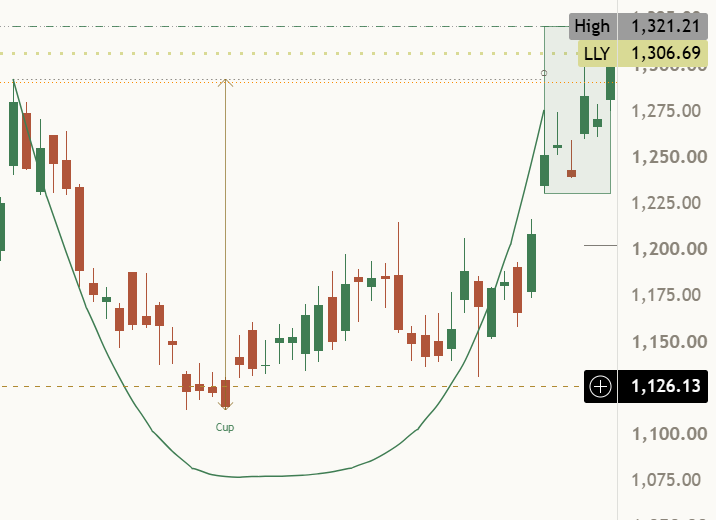
Close-up of the Eli Lilly daily chart: the right half of the cup arc, the thin depth arrow rising from the Cup tag at the low to the rim line, the handle box at the top right and the breakout level running across the top.

Cup depth

A thin arrow runs from the cup low, tagged "Cup", up to the rim. Depth is measured from the left rim to the cup low as a share of the rim: 12 to 33 percent by default ("Cup depth, at least" and "at most"). Shallower is a wobble; deeper is more than a base.

After a breakout, "One cup depth up" adds the same depth to the breakout level, as a thin gold dotted line with its price: "A pattern measure, not a forecast."

Back to the chart
The same close-up: the dotted rim line at the height of the left rim.

The rim line

A dotted line carries the left rim's high across the cup. The right rim is the first close back within 5 percent under the left rim ("Right rim, under the left by at most"). A handle that runs more than 3 percent over the left rim means price ran through with no handle.

Back to the chart
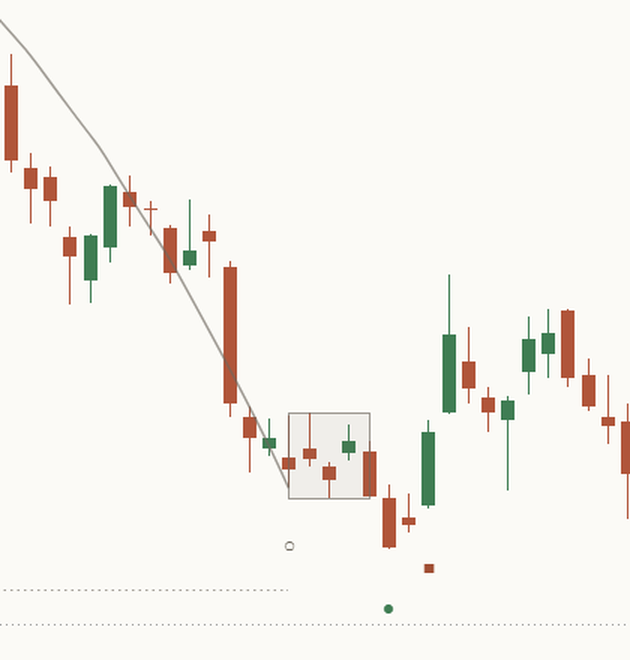
The same close-up: the shaded handle box after the right rim, five candles wide.

The handle box

After the right rim, the handle is drawn as a box while it forms. The textbook handle drifts down a little: 3 to 15 percent of the handle high, 1 to 5 weeks long, and in the upper half of the cup. A close into the lower half, or deeper than the rules allow, ends the pattern: "The handle is a pause, not a promise."

A ring marks the candle where the handle began.

Back to the chart
The Alphabet close-up again: the filled circle above the handle box on the candle that closed above the breakout level.

 The breakout level

The handle's high, drawn as a dashed level. A finished candle closing above it is the breakout, marked with a filled circle on that candle. A close back below within 3 candles is a failed break, marked with a square , and it stays. A return to the level that holds is a retest, marked with a diamond outline . One cup depth reached gets a small gold dot .

"A break is an event, not a forecast."

Back to the chart
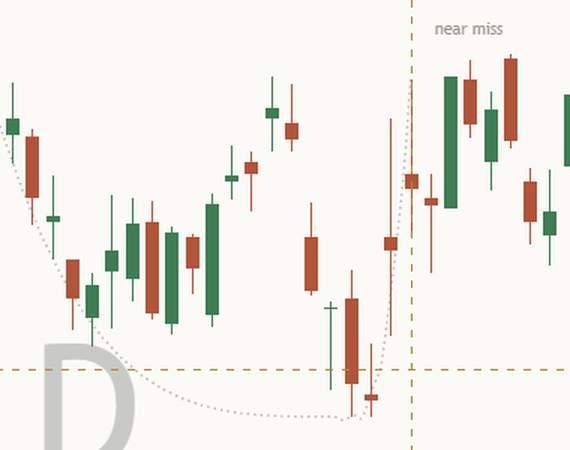
Close-up of the Eli Lilly daily chart in June and July 2026: a faint dotted rounded curve under the candles, labelled near miss.

Near miss

When no candidate passes, the closest one is drawn faint and dotted, tagged "near miss", and the panel (Full) names the first rule it failed, with this chart's number: for example "Closest: ... (need 12%)." for a cup that was too shallow, or "a V, few closes near the low" for a bottom that was not rounded.

That answers the question every cup tool leaves open: why is my cup not on the chart?

Back to the chart
Ch el past

A finished pattern, kept

Finished patterns stay faded on the chart, grey when they failed, with their marks. The last 4 stay ("Past patterns shown", 0 to 12), and the oldest goes first. Hover a tag and the tooltip says how it ended ("Broke out, ended", "Broke down, ended", "No breakout, ended") and when it was known.

Back to the chart

Two panel views

Compact (default)

The read and its strength, Why, the range on a Sideways read, the risk line, Wrong if, the state of the pattern, the breakout level, this chart's count and the footer "Closed candles, last 500. Not advice."

Full

Everything in Compact, plus the cup's depth and length, the rims, the handle, the prior advance, the volume tests, the measured level, which rules passed, the near miss and "Known from", the mark key "● held ■ failed ○ handle ◇ retest" and a teaching line.

The inverse: a dome with a handle

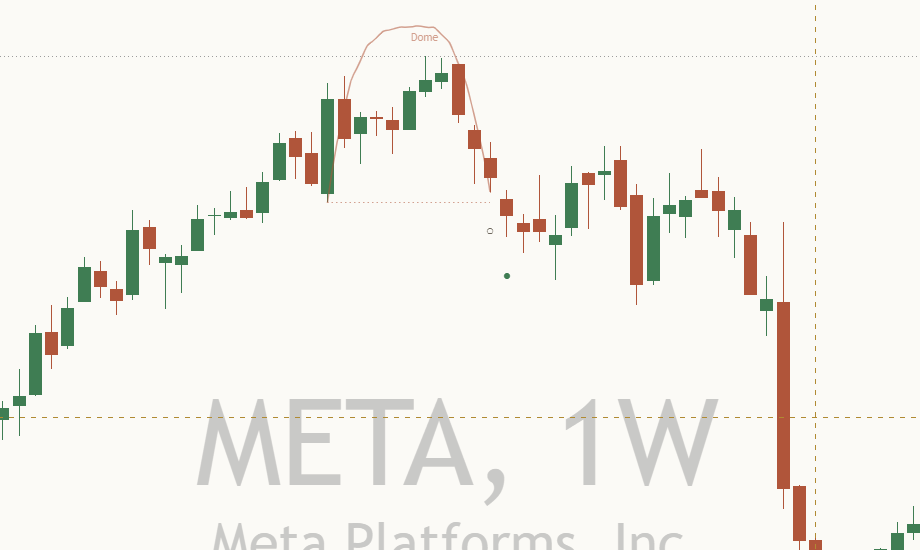
Readers of every cup tool ask for the mirror. Here it runs side by side with the cup ("Pattern": Both, Cup and handle, or Inverse), with the same rules worked on the mirrored prices: a dome over the highs, a handle that drifts up, a breakdown level, and one dome depth down.

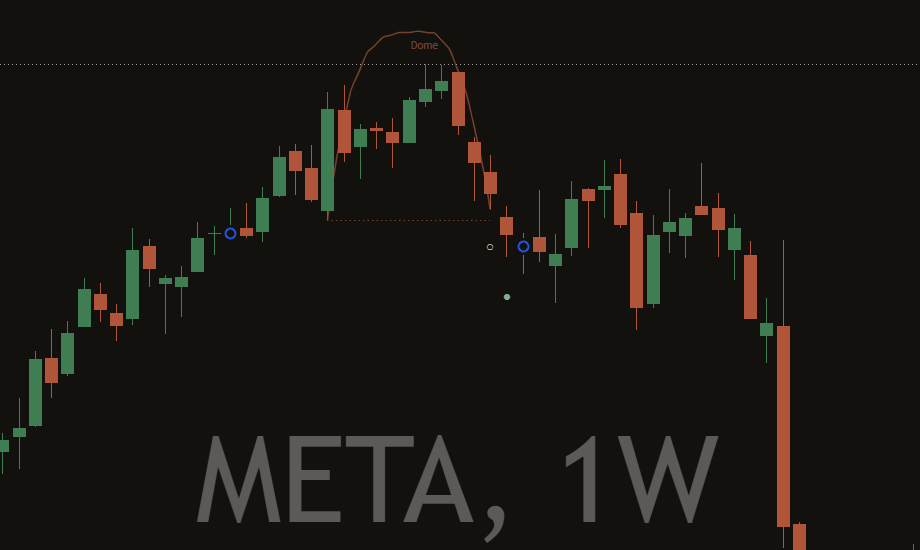
Meta Platforms (META) weekly chart in 2021 on a light background: a smooth rounded dome over the candle bodies at the top, tagged Dome, then the fall that followed. The same Meta Platforms weekly dome on a dark background.
Meta Platforms (META) weekly, the 2021 dome, default settings, captured on 23 Oct 2026. Panel cropped out (it reads today's candle).
Handle forming

"Why: cup 14% deep, handle in top half."

The cup passed its rules and the handle is forming. The read is Up while it holds, and Wrong if is the handle floor.

Breakout

"Breakout level: 1321.21."

A close above the handle's high. Counted on whether it held or closed back below within 3 candles.

Failed break or failed pattern

A close back under the breakout level within 3 candles is a failed break; a close past the handle floor ends the pattern. Both stay on the chart and in the count.

No base

"No base to read now."

Most charts, most of the time, have no cup. The read then follows the price trend, and the panel says plainly that there is no base. "A strict cup is rare; most charts have none."

What the count says, honestly

Every number on the panel comes from the chart it sits on. The count takes this chart's finished cups (or domes) in the last 500 candles, failures included, and nothing else.

Failures stay in

"Here: 1 of 3 cups broke out." on the Eli Lilly chart means the other 2 failed or ended with no breakout. Because failed patterns are never deleted, the count cannot quietly improve itself.

Rare is said out loud

A strict cup is rare by nature. "Here: none yet in 500 candles." is a common, honest answer, and "Too few here to count yet (1)." is the next one.

It answers "what timeframe?"

A question under almost every cup tool is which timeframe works. The count answers it for the chart you have open: switch between weekly and daily and see what the patterns there did.

How the Mentor helps you at every level

Same indicator, same panel. What you take from it grows with you. The quoted lines are the panel's own words.

  1. Level 1

    Beginner

    What gets in the way

    • Seeing a cup in every dip.
    • Not knowing what makes a handle a handle.
    • Looking for cups on one-minute charts.

    The habit it builds: a cup has rules, and the chart says which ones passed.

    What the Mentor says

    Teaching line"A base takes weeks; the handle comes last."

    Teaching line"A strict cup is rare; most charts have none."

  2. Level 2

    Intermediate

    What gets in the way

    • Calling a wick above the handle a breakout.
    • Ignoring a handle that sank too deep.
    • No price that says the pattern was wrong.

    The habit it builds: breakouts judged on closes, handles judged by their rules, and a Wrong if price every time.

    What the Mentor says

    Why (LLY 1D, 23 Oct 2026)"Why: cup 14% deep, handle in top half."

    Wrong if (same chart)"Wrong if: a close below 1202.97."

  3. Level 3

    Advanced

    What gets in the way

    • Overlooking the one rule a pattern failed.
    • Trusting a breakout with no volume behind it.
    • Not checking how cups went on this chart.

    The habit it builds: checking the weakest rule, the volume and the count before trusting a cup.

    What the Mentor says

    Risk (LLY 1D, 23 Oct 2026)"Failure risk: one rule fails: bottom shape."

    This chart (same chart)"Here: 1 of 3 cups broke out."

  4. Level 4

    Expert

    What gets in the way

    • Treating one cup depth as a destination.
    • Bending the rules until an old chart shows a cup.
    • Forgetting the patterns that failed.

    The habit it builds: a steady second pair of eyes that states its limits every time.

    What the Mentor says

    Teaching line"A break is an event, not a forecast."

    Teaching line"The handle is a pause, not a promise."

Three things to remember

  1. A pattern is a shape the past made. It shows how price behaved, not where it must go.
  2. Every read has a Wrong if price. Look at it first. It tells you how far price can go before the read is wrong.
  3. History, not a promise. The counts describe this chart's past patterns, failures included. The next one can go either way.

Honest about volume, honest about limits

Volume, when there is some

The textbook wants volume to dry up in the cup bottom and the handle, and to rise on the breakout. The tool tests both against their averages. On symbols with no real volume (forex, or a feed that counts ticks) the volume rule switches off by itself, the panel says "No volume on this symbol.", and strength is capped at moderate.

What it does not do

No arrows, no percentages of success, no odds, and no claim about what comes next. The textbook numbers are commonly summarised defaults, and each is a setting. Loosen them and more cups appear, so the count changes too. None of those settings is the right one.

Settings

The defaults are the textbook rules as commonly summarised. These are the ones worth knowing.

On a small screen, swipe the table sideways to see every column.
SettingWhat it doesDefault
Pattern / Run below 1 hourThe cup, the inverse, or both side by side. Below one hour nothing is drawn unless this is on.
BothCup and handleInverse
Both; Off
Cup depth, at least / at mostFrom the left rim to the cup low, as a share of the rim, in percent.12; 33
Cup length, weeks, at least / at mostWeeks become candles by timeframe: 5 per week on daily, 1 on weekly.7; 65
Right rim, under the left by at most / over the left by at mostHow close the right rim must come back to the left, in percent.5; 3
Handle length, weeks / Handle depth / Handle in the upper halfHow long and how deep the handle may be, and whether a close into the lower half of the cup ends it.1 to 5; 3 to 15; On
Needs a prior advance / Prior advance, at least / lookback, weeksThe rise into the left rim from the lowest low of the lookback.On; 30; 26
Rounded bottom: closes in the lower thirdThe share of the cup's closes near its low. A V spends little time there. The low must also sit in the middle of the cup.15
Volume testsCup bottom and handle volume at or under their averages. Off by itself on symbols with no volume.On
Draw the live pattern / One cup depth up / Near-miss ghostThe arc, rim line, handle box, levels and measured line; the near miss drawn faint and dotted.On; On; On
Past patterns shown / Marks shownFinished patterns kept faded, and the marks on settled events.4; 10
Show a 200-candle average / Weekly context on a daily chartContext only, they play no part in the read.Off; Off
Closes to confirm a read changeThe header changes only after the new read holds this many finished candles in a row (1 to 5).2
Show Mentor / View / Panel position / Panel text sizeCompact or Full panel. Auto puts it Top Left, or Top Right when it fits better there.
CompactFull
On; Compact; Auto; Tiny
Panel background / Theme / Line width in charactersSee-through or Solid; Paper on a light chart and Ink on a dark one; rows wrap at 44 characters so they fit a phone.See-through; Auto; 44

Every rule setting carries the same note in its (i): "Textbook default (O'Neil, as commonly summarised). A setting, not a law." Hover over it, or tap it on a phone.

Light or dark, it matches

The arc, levels, marks and panel come in a warm light and a warm dark palette. The marks keep their shapes in both, so their meaning never depends on colour alone.

Alerts

Each alert says what happened, once, after the candle closes. None of them tells you what to do.

  • Any cup and handle eventone alert for every event below.
  • Cup forming / Handle forminga cup (or dome) reached the set depth, or passed its rules and a handle is forming.
  • Price within 1 ATR of the breakout levela close near the handle's breakout level.
  • Broke above the breakout level / Broke below the breakdown levela finished candle closed past the level.
  • Failed break / Pattern failedback across the level within 3 candles, or a close past the handle floor.
  • Retest of the breakout level / One cup depth reachedprice came back to the broken level, or travelled one cup depth from it.
  • Read changed to up / down / sideways, Read changed (any), Wrong if price passedthe header read changed after the confirming closes, or a close passed its Wrong if price.

With "Read alerts with levels" and "Event alerts with levels" on, choose "Any alert() function call" and one alert per candle names every event in the panel's words, with this chart's prices, the read and its Wrong if price.

TradingView shows a general note, "This alert may not function as intended", on scripts that draw lines and labels. It is a standard warning for this kind of script. The alerts here fire once, on the finished candle.

Learn more

Start with the lesson, then watch the indicator explained.

Foundry lesson

The cup and handle: checked rule by rule

What the pattern is, the textbook rules and where they come from, the handle, volume, the breakout and the measured move, the inverse, and why most charts have no cup. Concept first, indicator second, with a quiz.

Open the lesson
Trading journal

Keep a study log

Note each cup the tool finds and each near miss, write down its Wrong if price, then record what happened, right or wrong. Over time your own notes show you more than any single chart.

Coming soon

Watch it explained

Coming soon Video, about 2 minutes

How to read [TP] Cup and Handle - Mentor

Every part of the indicator on a real chart: the arc, the rims, the handle box, the breakout level, the near miss, and the read with its Wrong if price.

Coming soon Video, about 2 minutes

The cup and handle, checked rule by rule

What the textbook actually asks of a cup, why most charts have none, and how to tell a near miss from the real thing. Concept first, then the indicator.

The Titan suite

A glimpse here, the depth there

Cup and Handle Mentor reads one lens deeply: one classic pattern, checked against its rules. The full suite reads price together with momentum, volume, structure and flow, in the same plain-English Mentor voice.

See the full suite
Get it

Find it on TradingView

Full version for members on TradingView from 17 November 2026. Free Lite version in December. Check back on the day.

Full version for members on TradingView from 17 Nov. Free Lite version in December.

Questions

Is it free?

Not the full version. [TP] Cup and Handle - Mentor is for members on TradingView from 17 November 2026, as part of membership. A free Lite version follows in December. Leave your email at the top of this page and we will tell you the day it is out.

Does it repaint?

No mark, count or read changes after its candle closes. A cup can only appear once it is known, which is after its low, and the tooltip says "Known from" that date. The arc is worked out when the handle forms and kept as it was. Failed patterns are never deleted. Check it in Bar Replay.

Why is there no cup on my chart?

Because a strict cup is rare. Most charts, most of the time, have none, and the panel says "No base to read now." When a candidate came close, the near miss is drawn faint and dotted and the Full panel names the first rule it failed. Loosen that rule in the settings if you disagree with it.

Where do the textbook numbers come from?

From the cup and handle as William O'Neil described it, as those rules are commonly summarised. Each is a named setting with that note in its tooltip, so you can see and change every rule.

Where does the header read come from?

From the pattern when a handle is forming or a breakout has happened, and from the price trend when there is no live handle. It is always Up, Down or Sideways with a strength in words, a Why, a risk line and a Wrong if price. It changes only after 2 finished candles agree. A close past Wrong if drops it to slight at once.

Where do the panel's numbers come from?

From the chart it sits on, and nothing else: this chart's finished patterns in the last 500 candles, failures included. No number is carried in from other markets or from an offline study.

Does it tell me when to act?

No. It describes the pattern, which rules it passed, what price did at its level, and where its read would be wrong. It cannot see what comes next. Decisions stay with you.

Get our weekly market brief free.