Updated 06:01 GMT, 1 Nov 2026 SPX 7,580.07 -1.82% NDX 28,384.85 -3.46% VIX 19.42 +12.91% GOLD 3,898.90 -3.29% CL 104.12 +2.08% BTC 77,765.00 +0.73%
Members TradingView indicator

[TP] Supertrend - Mentor

The classic Supertrend line, read in plain words: which side of the line price is on, how firm that side is, when the line has flipped too often to trust, and the close that would prove the read wrong.

A Supertrend line is easy to draw and easy to misread. In a clean trend it holds price well. In a range it flips back and forth, and each flip looks as convincing as the last. This one keeps the line exactly as you know it, reads finished candles only, and says Sideways when the line keeps flipping and price goes nowhere.

Full version for members on TradingView from 16 Nov. Free Lite version in December.

--days--hours--mins--secs

How to read it
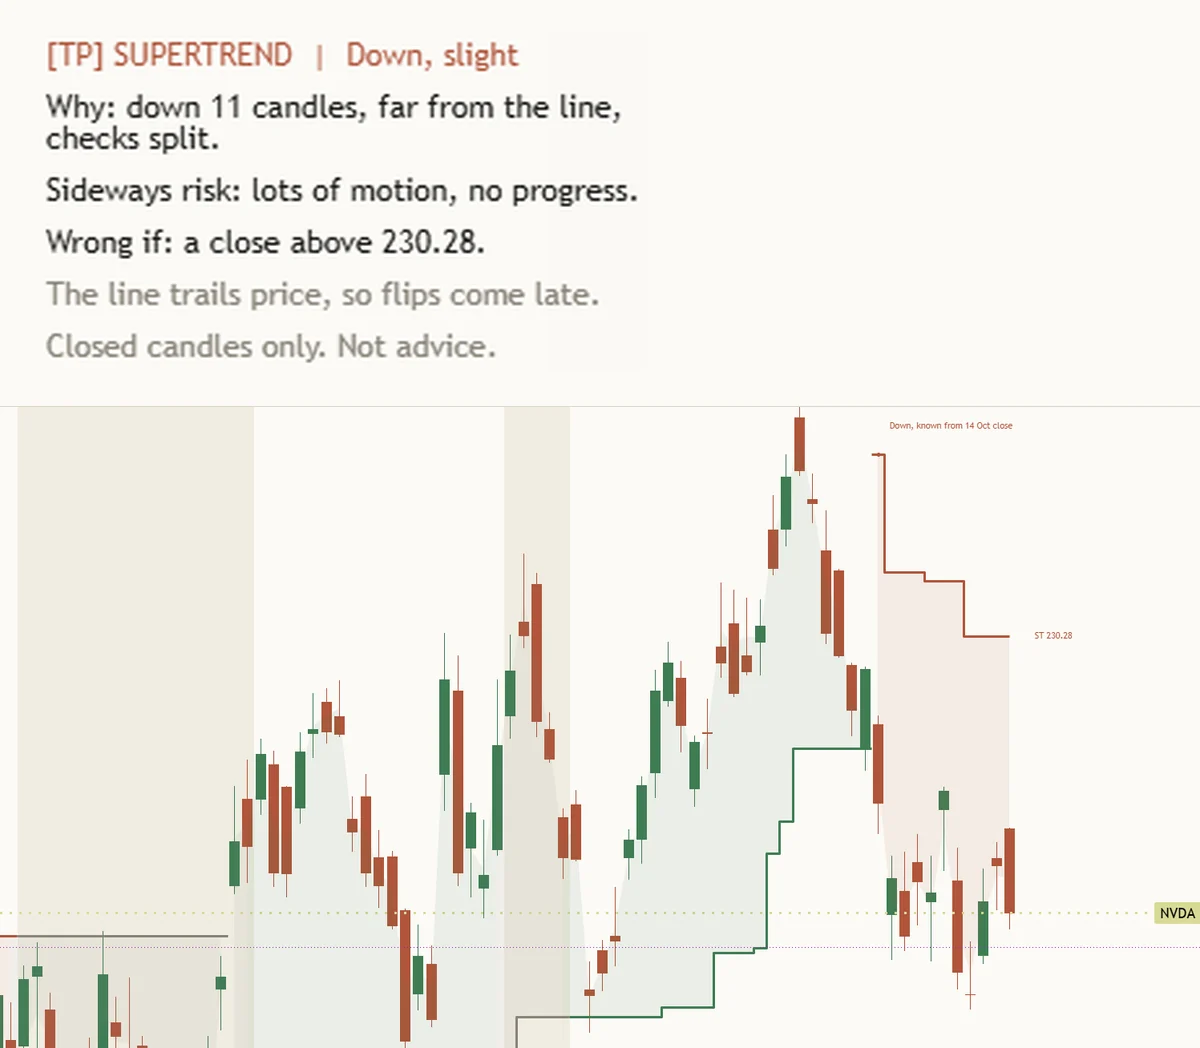
The [TP] Supertrend - Mentor panel, shown enlarged, above a light NVIDIA (NVDA) daily chart. The panel reads Down, slight; Why: down 11 candles, far from the line, checks split; Sideways risk: lots of motion, no progress; Wrong if: a close above 230.28. On the chart a green step line under earlier candles gives way to a terracotta line above price after the latest flip, labelled Down, known from 14 Oct close, with ST 230.28 at the right edge.
NVIDIA (NVDA) daily, default settings, read on 29 Oct 2026 from the last closed candle. The panel is shown enlarged above the same chart. A real chart, an example only, not a recommendation.

What it is in 30 seconds

It draws the Supertrend line most traders already know and tells you, in plain words, what it means right now. It describes what has happened on this chart. It does not say what comes next.

The line you know

ATR length 10, factor 3.0, source hl2. At these defaults the line matches the standard built-in Supertrend, so nothing you learned about it changes.

Sideways, said out loud

When the line keeps flipping and price goes nowhere, the read says Sideways instead of pretending there is a side, and gold shading marks those candles.

A read, with its exit sign

The header always gives a read, Up, Down or Sideways, with its strength in words, a reason, the main risk, and the close that would prove it wrong.

The line trails price. The panel says so.

A Supertrend line is built from candles that already closed, so a flip always comes after the turn. That is not a fault to hide. It is the first thing to know about the tool, and the panel repeats it under every read: "The line trails price, so flips come late."

  1. 1. Every flip is stampedEach flip mark and the latest flip label carry the close it was known from, so you can see exactly which candle made it and how far price had already moved.
  2. 2. Chop is namedWhen the line flips often and price makes little progress, the read goes Sideways and says it plainly: "Trend lines whipsaw in ranges like this."
  3. 3. History in wordsThe Full panel describes how flips have gone on this chart's own last 500 closed candles, such as "Flips here: most stuck, few turned back." Hover the row for the counts. Nothing comes from other markets.
Finished candles only

The candle still forming shows the line from the last close, so the line, the colours, the marks, the shading, the panel and the alerts never change mid-candle.

Bigger picture, closed only

The bigger-picture line comes from the last finished candle of the larger timeframe, so it only changes when that candle closes.

Check it yourself

Open Bar Replay and step one candle at a time. Nothing appears before its candle closes.

Each part, up close

Every quote below is the panel's own text on NVIDIA (NVDA), read on the private build that will be published. Chart and candle are named with each one.

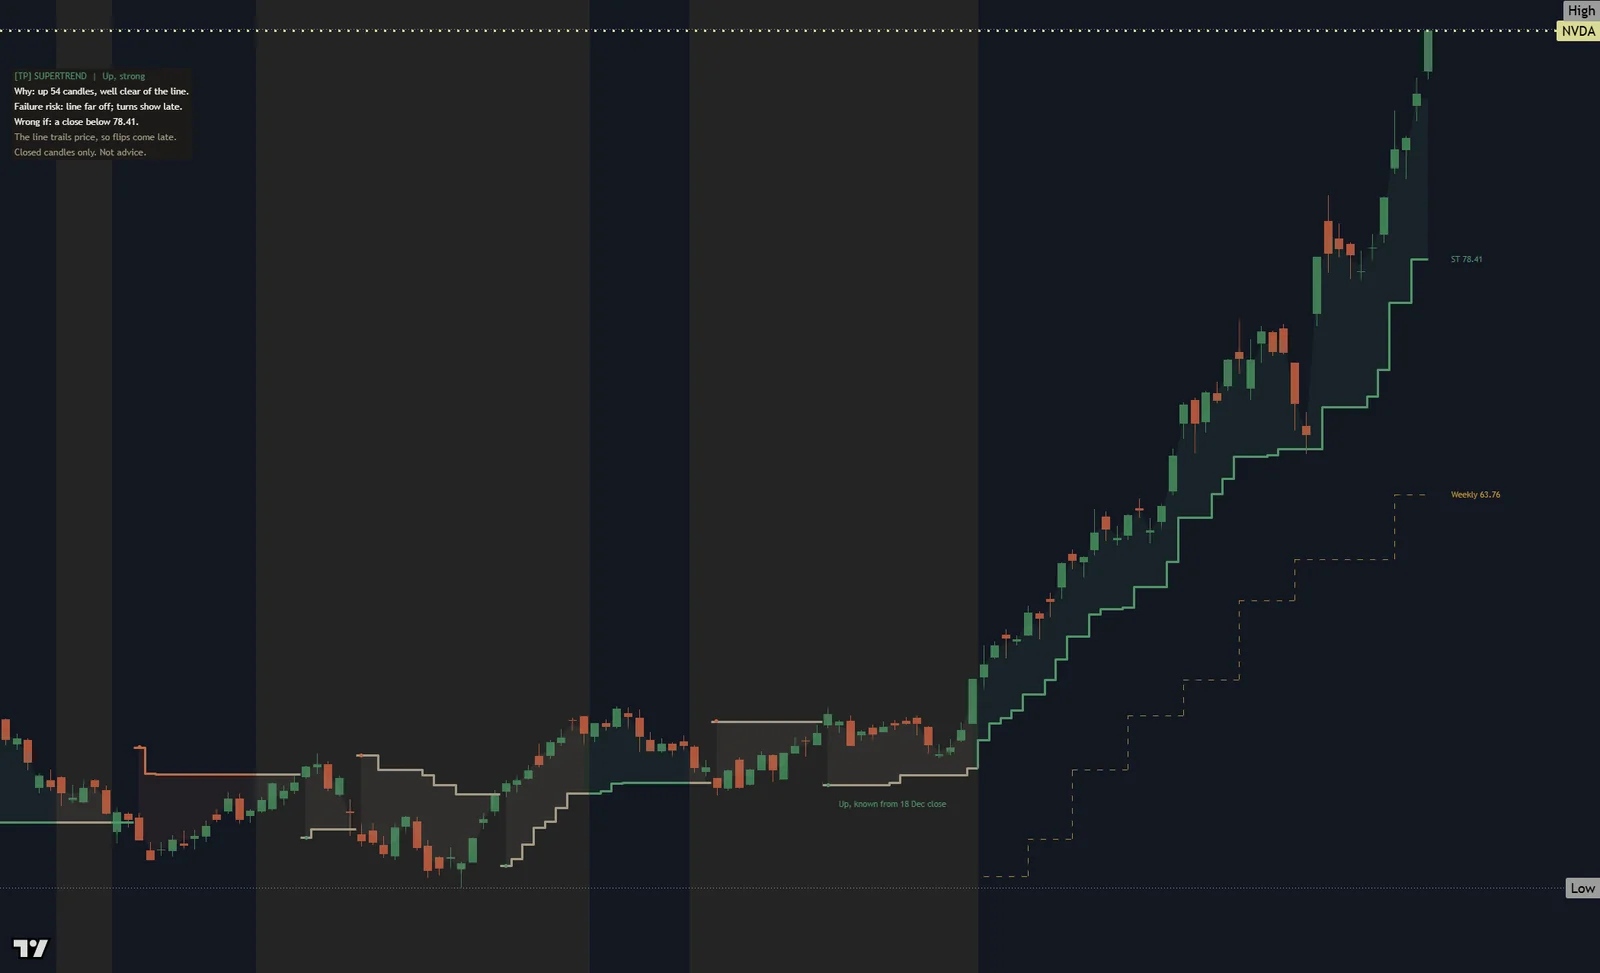
Dark NVIDIA daily chart from August 2023 to March 2024: a green step line climbs under a strong rise, a dashed gold bigger-picture line steps up below it, the right edge reads ST 78.41 and Weekly 63.76, and the Mentor panel at the top left reads Up, strong, with Why, Failure risk and Wrong if.

The read

The header always names a read: "[TP] SUPERTREND | Up, strong". Up, Down or Sideways, with the strength in words: slight, moderate or strong. Slight is the honest answer when the evidence is thin.

Strength starts from how far price sits from the line, measured against the chart's own normal candle range. It gains a step when the bigger-picture line agrees and loses one when it disagrees or when one Sideways check is on. A side under 3 candles old cannot read strong.

On the chart above (NVIDIA daily, stepped in Bar Replay to the 7 Mar 2024 close) the panel reads "Up, strong" and "Why: up 54 candles, well clear of the line."

Back to the guide
Why, the risk, and Wrong if

"Why" says how long price has been on this side and how far from the line: "Why: down 11 candles, far from the line, checks split." On the close that flips the line it says "just flipped".

The risk line names the one thing that argues against the read. "Sideways risk" when the chart is starting to chop ("Sideways risk: lots of motion, no progress."), otherwise "Failure risk", such as "Failure risk: line far off; turns show late." (NVIDIA daily, 7 Mar 2024).

"Wrong if" gives the close that breaks the read. For Up it is a close below the line, for Down a close above it: "Wrong if: a close above 230.28." While a side holds, the line only steps one way, so a close past that price is exactly the flip.

Back to the guide

The line and its fill

A step line, green on the up side, terracotta on the down side, grey while the read is Sideways. It breaks at each flip, so one side never runs into the other. A light fill between the middle of the candle and the line shows the side colour.

At the defaults (ATR length 10, factor 3.0, source hl2, ATR method RMA) the line is the standard Supertrend. A lower factor draws it closer to price, so it flips sooner and more often.

Back to the guide

 Flip marks

A small dot sits on the line at each closed candle where it flipped, in the colour of the new side. Hover a dot to see when it was known. Every flip in the last 500 candles stays on the chart: they are the history the panel describes.

With the optional Volume note on, a flip on lighter than average volume gets a hollow mark and a note on the Full panel. It never changes the line.

Back to the guide

The latest flip label

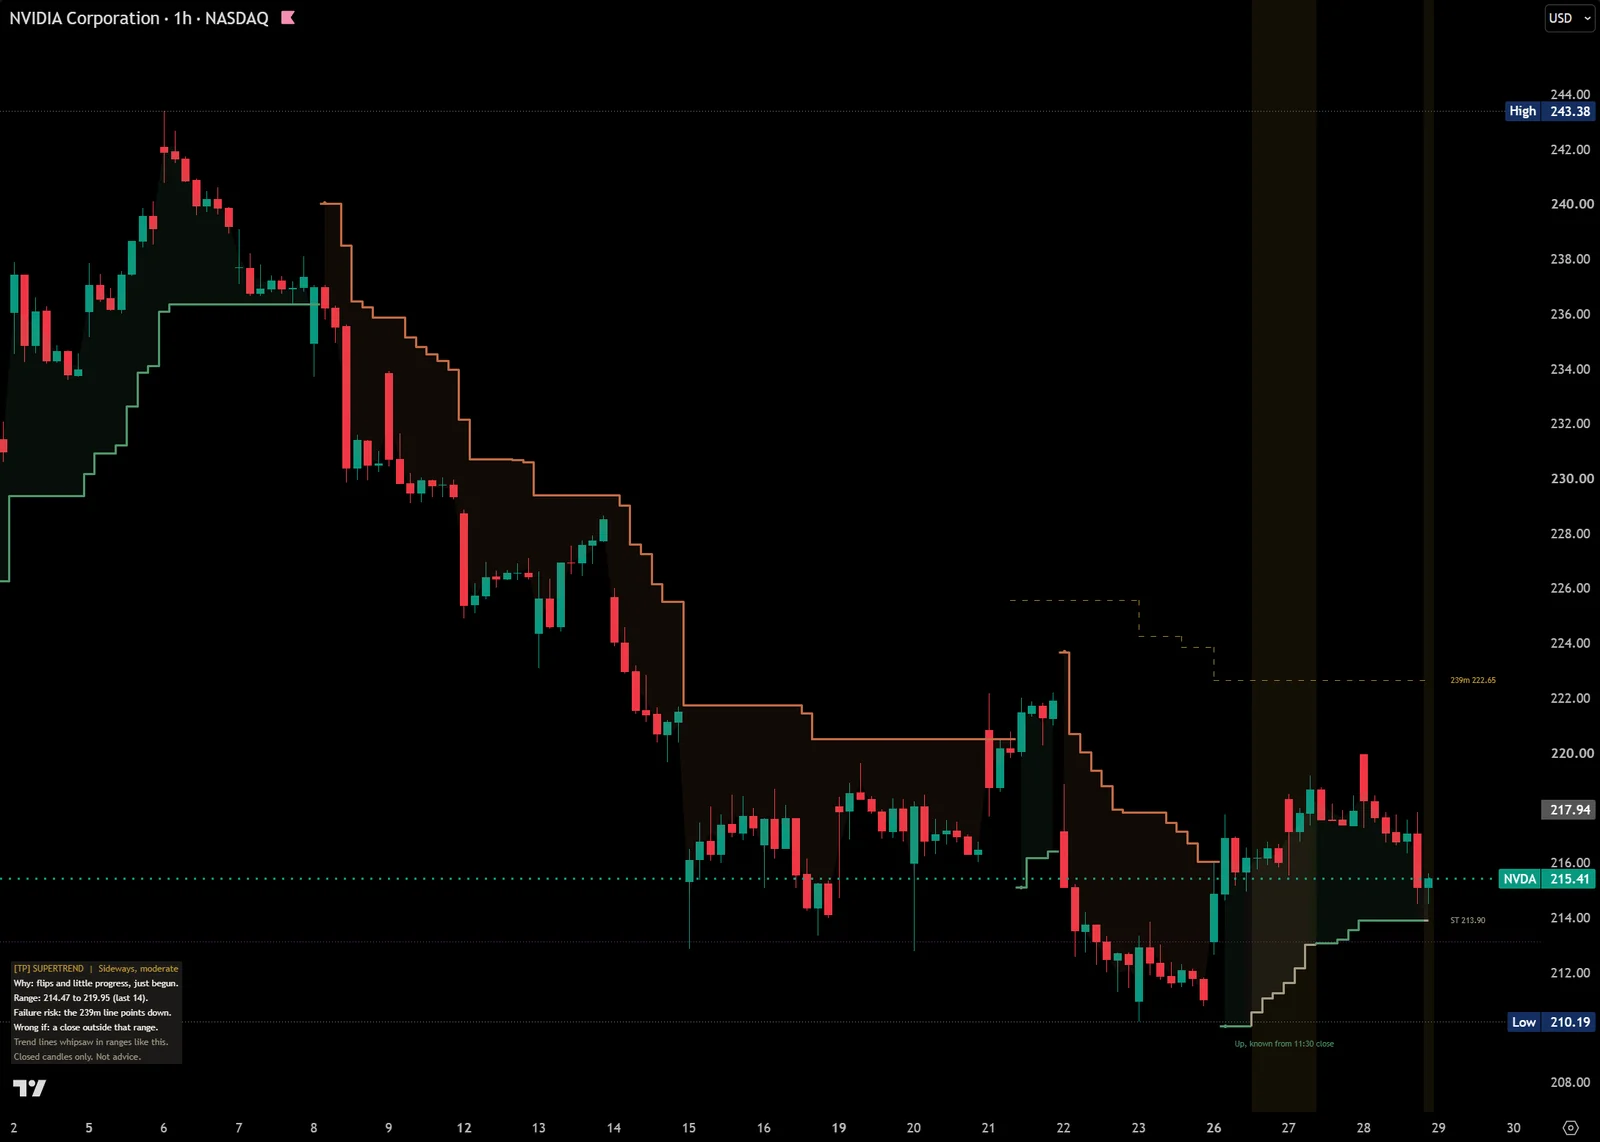
The newest flip carries a label with its side and the close it was known from: "Down, known from 14 Oct close" on NVIDIA daily, or "Up, known from 11:30 close" on NVIDIA one hour. You can see at a glance how many candles the line has trailed since.

Back to the guide
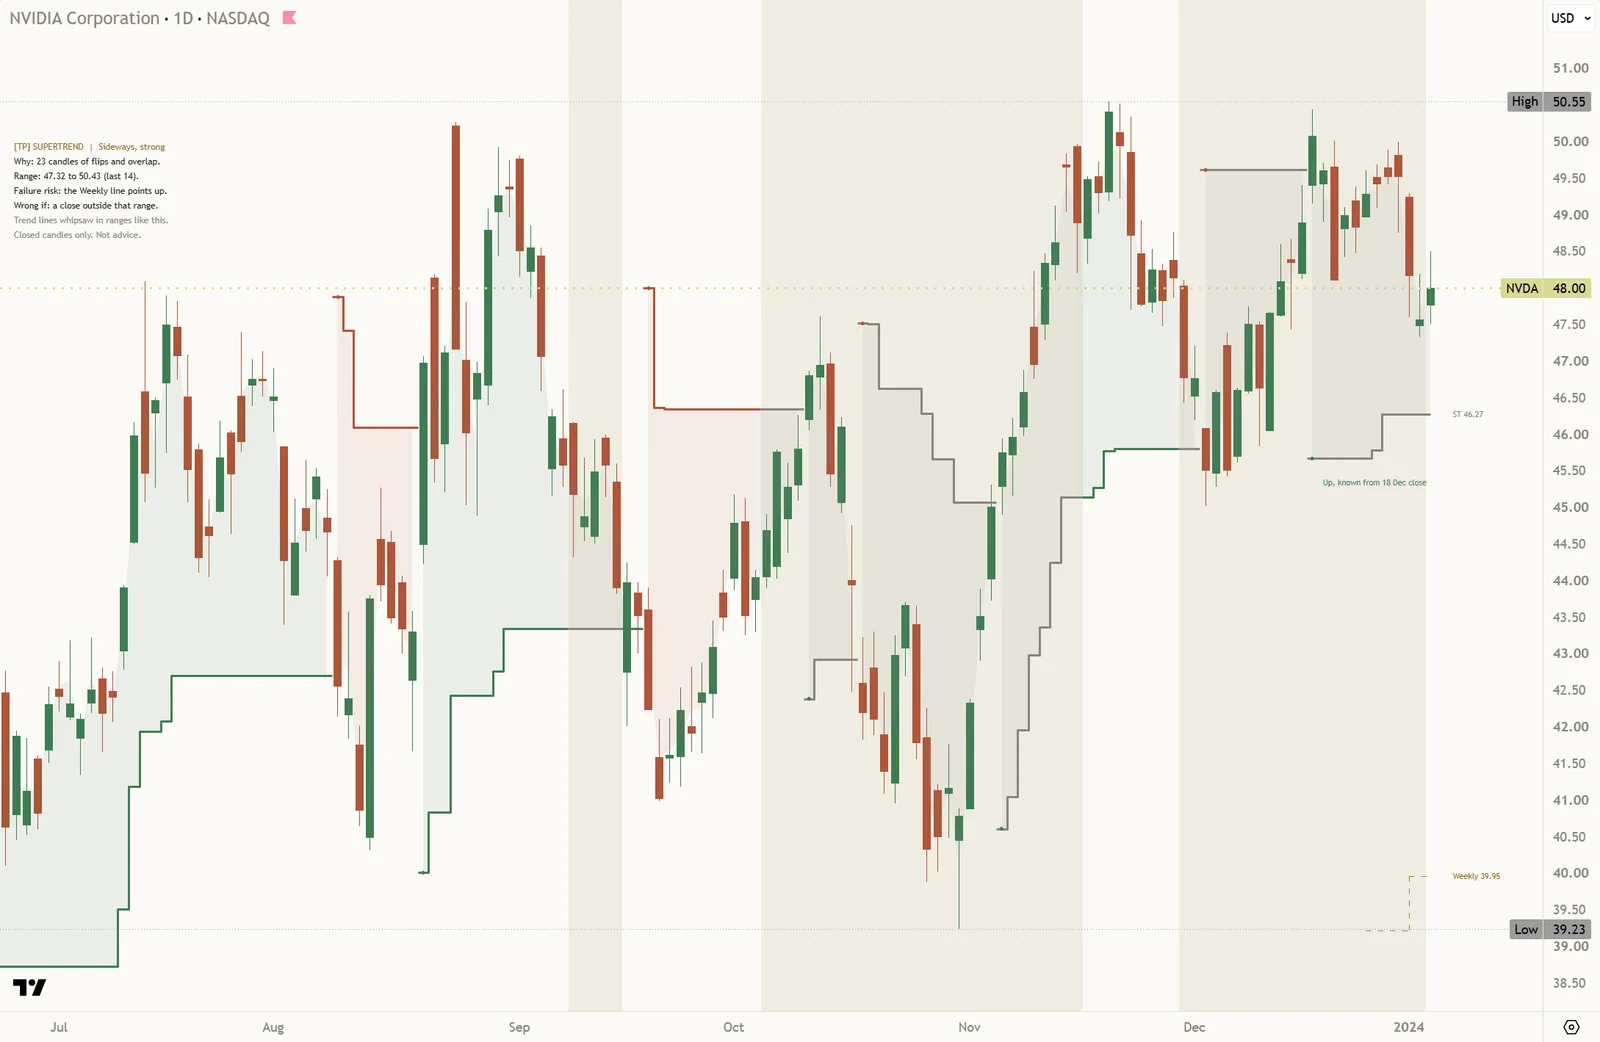
Light NVIDIA daily chart from July 2023 to early January 2024: the step line flips back and forth between green, terracotta and grey, wide gold bands shade the choppy stretches, and the Mentor panel at the top left reads Sideways, strong, with the range 47.32 to 50.43.

 Sideways shading

Sideways needs 2 of 3 checks on closed candles: the line flipped 3 or more times in the last 40 candles; a range, by the same test the [TP] Regime - Mentor uses, so the two never disagree about what a range is; and little progress, price travelled a lot but got almost nowhere over the last 20 closes.

It starts after 2 closes in a row and ends after 3, and once it starts it holds at least 5 candles, so the shading never comes in thin slivers. While Sideways, the panel shows the range of the last 14 closed candles, and the read is wrong on a close outside it.

On the chart above (NVIDIA daily, Bar Replay to the 4 Jan 2024 close): "Sideways, strong", "Why: 23 candles of flips and overlap.", "Range: 47.32 to 50.43 (last 14)." and "Wrong if: a close outside that range." The shading describes chop on the chart you have open. It does not tell you which flip will fail.

Back to the guide

Right-edge labels

"ST" with the line's value on the last close ("ST 230.28" on NVIDIA daily), and the bigger-picture line's value ("Weekly 189.50"). Hover "ST" for the settings in use. When the bigger-picture value is out of view, its label says (below) or (above).

Back to the guide
Dark NVIDIA one-hour chart in late October 2026: a terracotta step line comes down with price, then a green line after a flip at the right, a dashed gold 239-minute line above price labelled 239m 222.65, gold shading over the last stretch, and the Mentor panel at the bottom left reading Sideways, moderate.

The bigger-picture line

The same Supertrend on a larger timeframe, drawn as a thin dashed gold step for the most recent candles only. The timeframe follows a ladder of 14, 29, 59, 239 and 390 minutes, then Daily, Weekly and Monthly. On Auto it takes the first step at least 3 times your chart: a 15 minute chart is read against 59 minutes, an hour chart against 239 minutes, a daily chart against the Weekly. You can also pick it by hand.

On the chart above (NVIDIA one hour, 28 Oct 2026) the dashed "239m 222.65" line sits above price, and the panel names it: "Failure risk: the 239m line points down." On a Monthly chart the panel says there is no bigger picture above it.

Back to the guide

Two panel views

Compact (default)

The read and its strength, Why, the range on a Sideways read, the risk line, Wrong if, a short reminder of how the tool behaves, and the footer "Closed candles only. Not advice."

Full

Everything in Compact, plus three rows: the bigger picture in words ("Weekly: on the up side at its last close."), the flip history on this chart in words ("Flips here: most stuck, few turned back."), and a settings note ("A factor of 4 would flip less often here."). Hover the last two for the counts behind them.

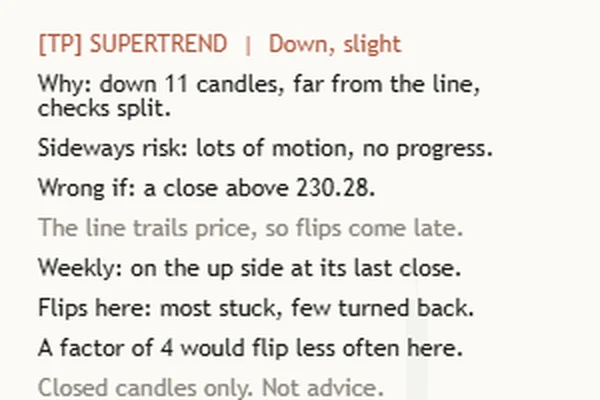
The Full panel on a light chart, in small type: Down, slight, Why, Sideways risk, Wrong if, the reminder line, then Weekly: on the up side at its last close, Flips here: most stuck, few turned back, A factor of 4 would flip less often here, and the footer.
The Full panel, NVIDIA daily, read on 29 Oct 2026 from the last closed candle.
Light or dark, it matches

Panel background is Solid by default, with Tint and See-through as options. Theme Auto follows the chart background: Paper on a light chart, Ink on a dark one. Rows wrap at 44 characters, so the panel fits a phone, and Auto keeps it to a left corner so the newest candles stay clear.

The reads it gives

Each read is a plain sentence about the line on this chart, with a price from this chart. It says where price is, never what to do.

A firm side

"Why: up 54 candles, well clear of the line."

Price has held one side for a long time and sits far from the line. The risk line reminds you of the cost: "Failure risk: line far off; turns show late."

A side with doubts

"Why: down 11 candles, far from the line, checks split."

A side, but the evidence does not all agree. The strength drops to slight, and the risk line says what is pulling against it.

Chop, named

"Why: 23 candles of flips and overlap."

The line has flipped often and price has gone nowhere. The read is Sideways, with the range of the last 14 closed candles as its edges.

The bigger picture against you

"Failure risk: the 239m line points down."

The larger timeframe's line is on the other side. The panel says so, and the strength loses a step.

One chart, three moments, as the panel read them

NVIDIA (NVDA), the same indicator at default settings. The first two are stepped in Bar Replay, the third is the read on 29 Oct 2026.

[TP] SUPERTREND | Sideways, strong Why: 23 candles of flips and overlap. Range: 47.32 to 50.43 (last 14). Failure risk: the Weekly line points up. Wrong if: a close outside that range.
Daily, the 4 Jan 2024 close. The line had flipped back and forth for weeks, so the read was Sideways, with a range as its edges.
[TP] SUPERTREND | Up, strong Why: up 54 candles, well clear of the line. Failure risk: line far off; turns show late. Wrong if: a close below 78.41.
Daily, the 7 Mar 2024 close. Price left the range upward and stayed far above the line, which had been up since the 18 Dec close.
[TP] SUPERTREND | Down, slight Why: down 11 candles, far from the line, checks split. Sideways risk: lots of motion, no progress. Wrong if: a close above 230.28.
Daily, read on 29 Oct 2026. Down since the 14 Oct close, but slight, and the risk line warns that the chart is starting to chop.
No hiding a flip

Every flip keeps its mark, including the ones that turned back soon after. That is what lets the Full panel describe this chart's flips honestly.

Words, not scores

There are no percentages, no scores and no win rates on the panel. Strength is in words, and the flip history is this chart's own past, never a promise.

It answers "which factor?"

The settings note says whether a factor one step lower or higher would have flipped less often on this chart. Hover it to see how often each would have flipped.

How the Mentor helps you at every level

Same indicator, same panel. What you take from it grows with you. The quoted lines are the panel's own words.

  1. Level 1

    Beginner

    What gets in the way

    • Reading a colour change as a call to act.
    • Forgetting that the line moves after price.
    • Not knowing which close would prove the read wrong.

    The habit it builds: name the side, then find the close that would break it.

    What the Mentor says

    Reminder line"The line trails price, so flips come late."

    Wrong if (NVDA daily, 29 Oct 2026)"Wrong if: a close above 230.28."

  2. Level 2

    Intermediate

    What gets in the way

    • Following every flip in a range.
    • Treating a side only a few candles old as settled.
    • No edges when the market goes sideways.

    The habit it builds: ask whether the chart is trending or chopping before trusting a flip.

    What the Mentor says

    Reminder line, Sideways"Trend lines whipsaw in ranges like this."

    Range (NVDA daily, 4 Jan 2024)"Range: 47.32 to 50.43 (last 14)."

  3. Level 3

    Advanced

    What gets in the way

    • Reading one timeframe in isolation.
    • Ignoring how far the line sits from price.
    • Trusting a flip without knowing how flips went here.

    The habit it builds: checking the bigger-picture line and this chart's flip history before trusting a side.

    What the Mentor says

    Bigger picture (NVDA 1h, 28 Oct 2026)"Failure risk: the 239m line points down."

    Full panel (NVDA daily, 29 Oct 2026)"Flips here: most stuck, few turned back."

  4. Level 4

    Expert

    What gets in the way

    • Tuning the factor until an old chart looks clean.
    • Treating a long side as a promise.
    • Forgetting how late a far-off line turns.

    The habit it builds: a steady second pair of eyes that states its limits every time.

    What the Mentor says

    Settings note (NVDA daily, 29 Oct 2026)"A factor of 4 would flip less often here."

    Risk line (NVDA daily, 7 Mar 2024)"Failure risk: line far off; turns show late."

Three things to remember

  1. The line is a summary of the past. It shows which side price has held, not where it must go.
  2. Every read has a Wrong if close. Look at it first. It tells you how far price can go before the read is wrong.
  3. History, not a promise. The flip history describes this chart's past. The next flip can go either way.

Honest about lag, honest about limits

Any factor, any length

A lower factor hugs price and flips more; a higher one flips less and turns later. The optional Adaptive factor moves the factor by 0.5 when candles are wider or calmer than usual, and the Full panel says which. No factor is the right one on every chart.

What it does not do

No arrows, no percentages, no odds, and no claim about what comes next. Distance to the line, side age, the last flip's lag and the Sideways checks are in the Data Window if you want the numbers behind the words.

Settings

The defaults work out of the box. These are the ones worth knowing.

On a small screen, swipe the table sideways to see every column.
SettingWhat it doesDefault
ATR length / Factor / Source / ATR methodThe line itself. At the defaults it matches the standard built-in Supertrend. A lower factor draws the line closer to price and flips sooner and more often.
hl2closehlc3ohlc4RMASMA
10; 3.0; hl2; RMA
Show Sideways read / Flips counted over / Flips that count as frequentThe frequent-flips check. With Show Sideways read off, the header reads Up or Down only.On; 40; 3
Range check length / Range overlap floor / Clear trend strengthThe range check, the same test the [TP] Regime - Mentor uses.14; 55; 25
Progress check length / Low progress belowThe little-progress check: how much price travelled against how far it got.20; 0.25
Closes to start Sideways / Closes to end Sideways / Shortest Sideways stretchHow many closes a Sideways read needs to start and to end, and the fewest candles it holds once it starts.2; 3; 5
Show bigger-picture line / Bigger timeframe / Manual timeframe / Bigger-picture line lengthThe larger-timeframe line, from its last closed candle. It is drawn only inside the visible candles, so it never stretches the price scale.
AutoManual
On; Auto; Daily; 40 candles
Volume note on flips / Adaptive factorOptional. A hollow mark and a note for flips on light volume; a factor that moves 0.5 with wider or calmer candles. Neither changes the default line.Off; Off
Show flip marks / Show latest flip label / Show right-edge label / Show Sideways shadingThe marks, labels and shading on the chart.On
Fill between price and line / Fill see-through / Line width / Label sizeThe side-coloured fill and how the line and labels are drawn.On; 91
Show Mentor / Panel detail / Panel text size / Panel positionCompact or Full panel. Auto keeps it to a left corner so the newest candles stay clear.
CompactFull
AutoTop LeftBottom Left
On; Compact; Tiny; Auto
Panel background / Theme / Line width in charactersSolid, Tint or See-through; Auto follows the chart background (Light uses Paper, Dark uses Ink); rows wrap at 44 characters so they fit a phone.Solid; Auto; 44
Read alerts with levelsOne alert that sends the full read with this chart's prices.On

Every setting has a small (i) next to it. Hover over it, or tap it on a phone, and it explains that setting in plain English, right there on your chart.

Alerts

Each alert says what happened, once, after the candle closes. None of them tells you what to do.

  • Supertrend flipped up / flipped downthe line flipped on a closed candle.
  • Supertrend flipped (either side)one alert for both flips.
  • Close near the Supertrend linethe first close within half an ATR of the line.
  • Read changed to Sideways / Read left Sidewaysthe Sideways read started or ended.

With "Read alerts with levels" on and "Any alert() function call" chosen, one alert sends the full read with this chart's prices when the read changes or a close leaves the Sideways range.

TradingView shows a general note, "This alert may not function as intended", on scripts that draw lines and labels. It is a standard warning for this kind of script. The alerts here fire once, on the finished candle.

Learn more

Start with the lesson, then watch the indicator explained.

Foundry lesson

Supertrend: a trailing line, read honestly

What the line is, how ATR and the factor build it, why every flip is late, how to spot chop, the bigger picture, and a working view with the close where it is wrong. Concept first, indicator second, with a quiz.

Open the lesson
Trading journal

Keep a study log

Note each flip as it happens, write down its Wrong if close, then record what happened, right or wrong. Over time your own notes show you more than any single chart.

Coming soon

Watch it explained

Coming soon Video, about 2 minutes

How to read [TP] Supertrend - Mentor

Every part of the indicator on a real chart: the line, the flip marks, the Sideways shading, and the read with its Wrong if close.

Coming soon Video, about 2 minutes

Supertrend flips late. Here is how to read it.

How the line is built, why every flip comes after the turn, and how to tell a trend from chop on your own chart. Concept first, then the indicator.

The Titan suite

A glimpse here, the depth there

Supertrend Mentor reads one lens deeply: the trailing line and which side price holds. The full suite reads that together with momentum, volume, structure and flow, in the same plain-English Mentor voice.

See the full suite
Get it

Find it on TradingView

Full version for members on TradingView from 16 November 2026. Free Lite version in December. Check back on the day.

Full version for members on TradingView from 16 Nov. Free Lite version in December.

Questions

Is it free?

Not the full version. [TP] Supertrend - Mentor is for members on TradingView from 16 November 2026, as part of membership. A free Lite version follows in December. Leave your email at the top of this page and we will tell you the day it is out.

Does it repaint?

No. Everything is judged on finished candles. The candle still forming shows the line from the last close, so nothing on the chart or the panel changes mid-candle. The bigger picture comes from its last closed candle, and every flip is stamped with the close it was known from. Check it in Bar Replay.

Is the line the same as the standard Supertrend?

Yes, at the defaults (ATR length 10, factor 3.0, source hl2, RMA) it matches the standard built-in Supertrend. The Mentor adds the read, the marks and the shading around it. It never moves the line.

Where does the header read come from?

From the side of the line, how far price sits from it against the chart's own normal candle range, whether the bigger-picture line agrees, and the three Sideways checks. It is always Up, Down or Sideways with a strength in words, a Why, a risk line and a Wrong if close.

Where does the flip history come from?

From the chart it sits on, and nothing else: this chart's own last 500 closed candles. No number is carried in from other markets or from an offline study, and the panel puts it in words, not percentages.

Which factor should I use?

There is no right one. 3.0 is common because many people use it. The Full panel's settings note says whether one step lower or higher would have flipped less often on the chart in front of you, which is a better guide than any rule of thumb.

Does it tell me when to act?

No. It describes the line, which side price holds, and where its read would be wrong. It cannot see what comes next. Decisions stay with you.

Get our weekly market brief free.