Read the Market
Current market reading
Daily research and timely briefings on what matters.
ReadDaily market research for traders and investors · as of 12 Nov 2026
Plain-English research on every session, an ethical read on every stock we cover, and the tools to learn, journal and decide for yourself.
New here? Start free, no card needed Members: open your deskLondon · 12:55 UTCInto the close, the tape is rotating, with Healthcare and Retail catching a bid while Auto and Basic Resources fade.
Open today’s full desk noteCurrent market reading
Daily research and timely briefings on what matters.
ReadSearch evidence and context
Company and securitisation screens with source-linked evidence.
InvestigateResearch the condition
Decode flows, breadth and regimes within institutional context.
UnderstandApply the framework
Courses and playbooks to apply a repeatable, evidence-led process.
LearnWatch, Shield and Floor
Monitor, protect and review ideas with the Desk and private Floor.
See the deskOn the desk today
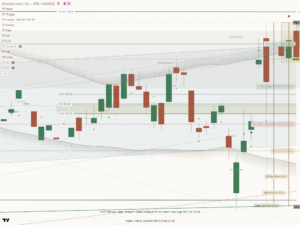 AmazonAmazon at $266.11 is in a controlled pullback rather than a broken advance, despite…
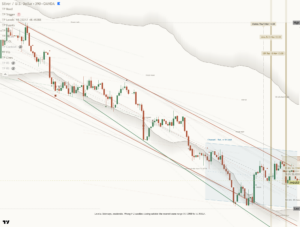 SilverSilver is under pressure at $51.23 after finishing the last session 1.0 percent lower,…
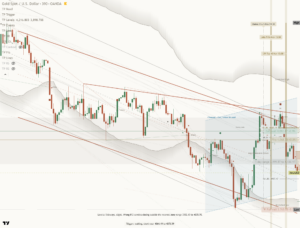 GoldGold is under controlled pressure rather than in outright breakdown, with the last price…
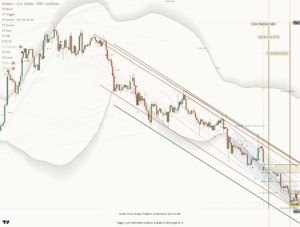 SolanaSolana is pressing the weak end of its recent structure, with the last price…
Inside the global desk
How Titan turns a moving market day into a disciplined research practice.
See how the desk worksStraight from the desk
 NAS100 holds 28374 into NY: chips bid, VIX wakes, metals sold
The one-breath open: Nasdaq 100 (NAS100) still marks 28374.25 (+2.28 from 27740.79) into the New York prep, S&P 500 (US500)…
Read the brief
 NAS100 chip lift meets London: Far East sold, Continent must choose
The one-breath open: US equities left a concentrated green board overnight: Nasdaq 100 (NAS100) 28374.25 (+2.28 from 27740.79), S&P 500…
Read the brief
 NAS100 closed 28374 on a 2.28 lift: Asia must prove the bid is…
NAS100 closed 28374 on a 2.28 lift: Asia must prove the bid is real PRE-ASIA · HANDOFF TEST · WEDNESDAY…
Read the brief
Economic calendar
Market news
 SPY Trades 11.20 Above 749 Max Pain on Nov 11 Weekly Expiry
Expiry Max Pain and Spot Gap SPY prints at 760.20 against the 749.00 max pain strike for the…
 VIX Falls 9.66 Percent to 17.58 as Term Structure Turns Upward
VIX Session Dynamics VIX closed at 17.58 after a 9.66 percent decline from 19.46 because the single-session drop…
 SPY Max Pain at 749.00 Holds Price Near Settlement on 10 Nov…
Max Pain Location Versus Spot SPY max pain for the 10 Nov 2026 weekly sits at 749.00 which…
 VIX Falls to 19.81 Below Five-Day Average of 21.784
VIX Session Dynamics VIX closed at 19.81 after a 0.55 percent decline because it sits 1.97 points below…
The ethical edge
names clear the Titan values & ethics screen. Every ticker is checked and labelled in every read. Our curated lists and our trading book hold only names that pass. How we show ethics
Screen any tickerThe movers · desk intelligence
Across the compliant universe, 7 Nov-12 Nov: the names quietly turning up, the ones rolling over, and the compliant names with earnings ahead.



Ethical movers · into & out of compliant
Out of compliance: 0072.KL, 0078.KL, 1113.HK, 1322.SR, 1831.SR, 1833.SR. A move into or out of compliant is a rare, deliberate event; when one happens, you see it here first.
Not financial advice · research, not a recommendation · Titan Protect
The market map
Where the tape is leading and lagging across the eleven S&P sectors, as of 12 Nov 2026.
Open Intelligence
The public ledger
Proof is available to inspect; it is not a performance promise.
Over the last 8 weeks, 79% of our scored direction reads were right, ranging from 70% to 84% week to week. Every call is on the track record.
Weekly verified accuracy · last week 70%
Titan composite indices
Each rules-based composite since 2020, its average annual return and year-by-year record against the benchmark. Open any index for the full breakdown.
| Yr | Basket | S&P 500 |
|---|---|---|
| 2020* | +29% | +16% |
| 2021 | +15% | +27% |
| 2022 | -8% | -19% |
| 2023 | +18% | +24% |
| 2024 | +15% | +22% |
| 2025 | +24% | +18% |
| 2026 | +11% | +12% |
| Yr | Basket | NAS100 | S&P |
|---|---|---|---|
| 2020* | +38% | +43% | +16% |
| 2021 | +23% | +27% | +27% |
| 2022 | -23% | -33% | -19% |
| 2023 | +32% | +54% | +24% |
| 2024 | +13% | +24% | +22% |
| 2025 | +15% | +21% | +18% |
| 2026 | +23% | +13% | +12% |
| Yr | Basket | S&P 500 |
|---|---|---|
| 2020* | +14% | +16% |
| 2021 | -1% | +27% |
| 2022 | -13% | -19% |
| 2023 | +21% | +24% |
| 2024 | +18% | +22% |
| 2025 | +26% | +18% |
| 2026 | +0% | +12% |
| Yr | Basket | S&P 500 |
|---|---|---|
| 2020* | +22% | +16% |
| 2021 | +23% | +27% |
| 2022 | +2% | -19% |
| 2023 | +33% | +24% |
| 2024 | +20% | +22% |
| 2025 | +40% | +18% |
| 2026 | +15% | +12% |
Backtested since 2020, illustrative, not a live track record. * partial first year · full method on each index page.
Explore the desk
The working instruments behind the research, open to inspect.
Find a stock
Filter the whole universe down to names that fit you.
All screenersEvery filter in one place. Find a fundSearch funds by what they hold and cost. Income finderHunt reliable dividend payers. Reads alignedNames where several reads agree at once. Compare two namesPut two stocks side by side.Follow the money
See the big-money flow and positioning behind the tape.
The big pictureThe whole market, read for you. Hidden big tradesLarge orders placed away from the exchange. Where futures traders leanHow the big futures players are positioned. What is leadingWhich parts of the market are strongest. What big funds ownThe stocks major funds are holding. Options LevelsKey options strikes for a name, drawn on your chart.Trackers
A running watch on the things that move markets, updated through the day.
Insider buying & sellingWhen a company's own executives buy or sell their stock, conviction and exits. The FedRate decisions, and what they mean for you. Earnings aheadWho reports results, and when. Oil & geopoliticsGeopolitical moves that swing the oil price.Values & ethics
Screen every name against clear, published values lines.
Values researchHow we judge a company's conduct. Check any nameRun any ticker through the values screen. How the screen worksThe rules behind every verdict. Plain-English glossaryEvery term, explained simply.The Foundry / Film library
Explainers
Ideas / Mentor updates
Follow our ideas here and on X, YouTube and TradingView.
Latest Ideas
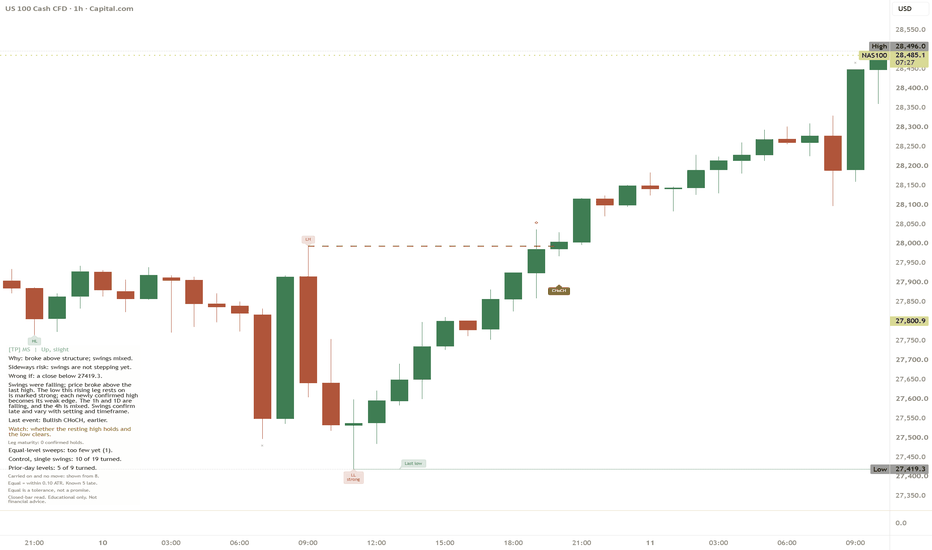
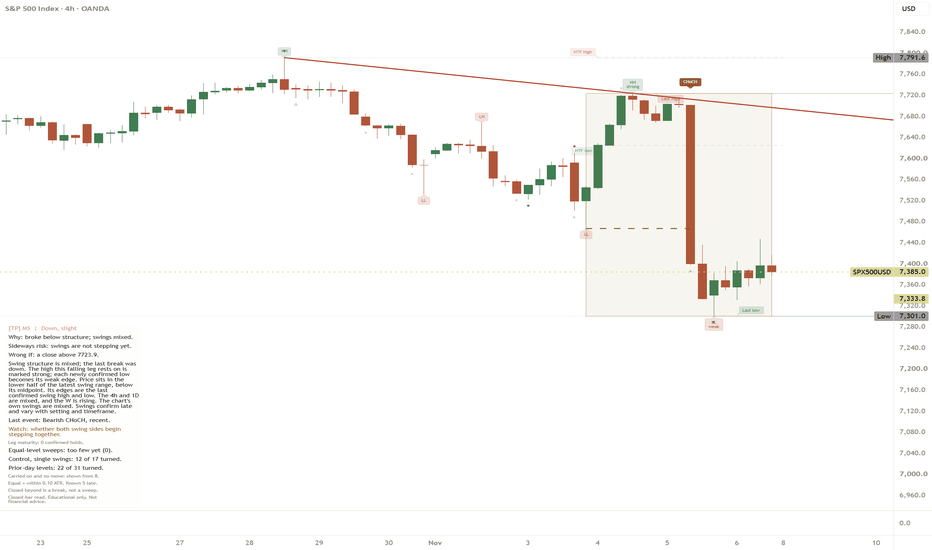
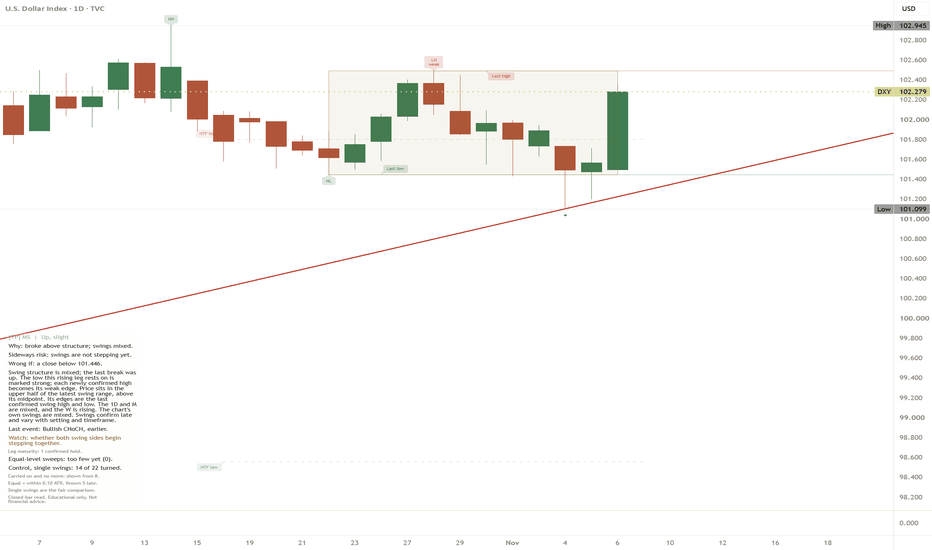
Mentor updates
 Read Suite
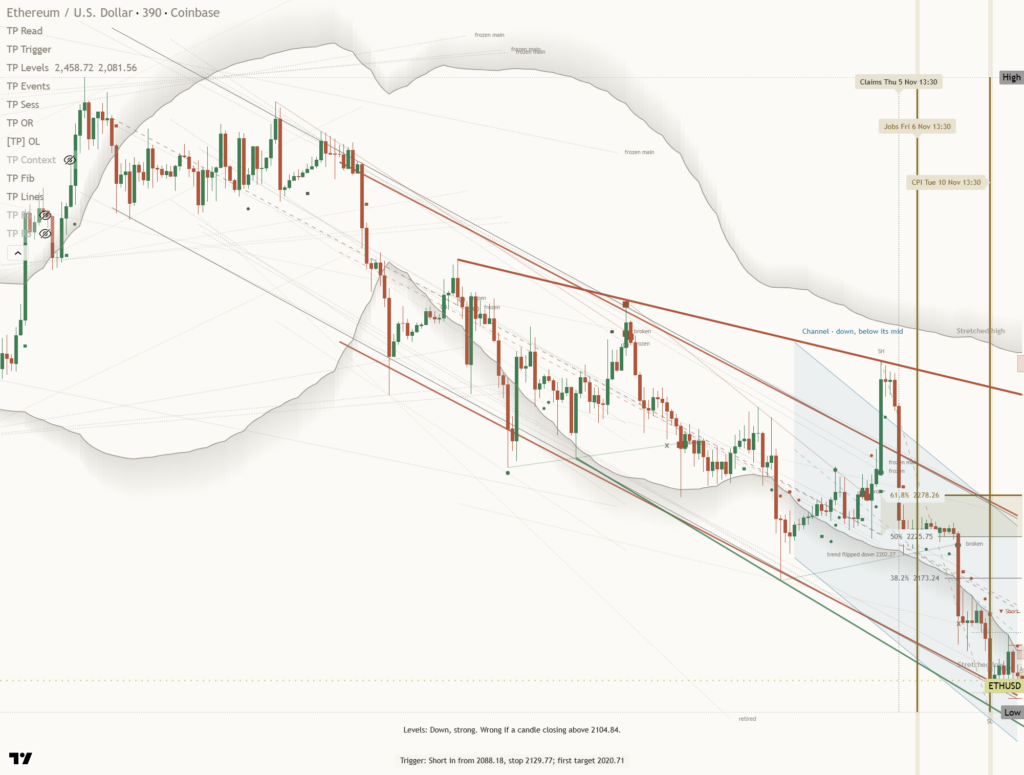
Now live on TradingView for members: one read of Up, Down or Sideways, with the reason and the price where it is wrong.
v0.1.3710 Nov 2026See the Mentor →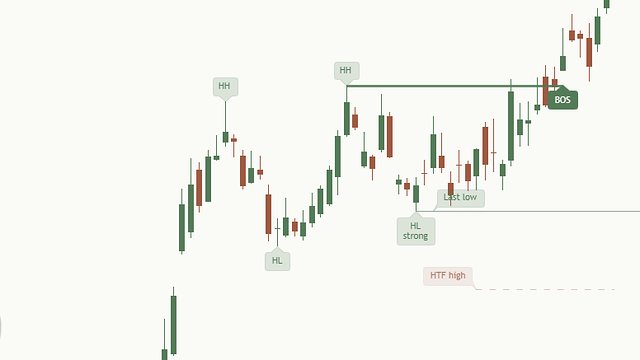 Market Structure Mentor
Now marks when price sweeps a recent high or low, and your existing settings stay as they are.
v1.6.031 Oct 2026See the Mentor →
Market Structure MentorMarks now appear only once the candle has closed, so they never vanish.
v1.3.1023 Oct 2026See the Mentor →Ideas refresh every 2 hours. Mentor links go to our own pages.
Indicators
Each Mentor indicator comes with a guide that explains the idea step by step. Start with these nine, or see all indicators.
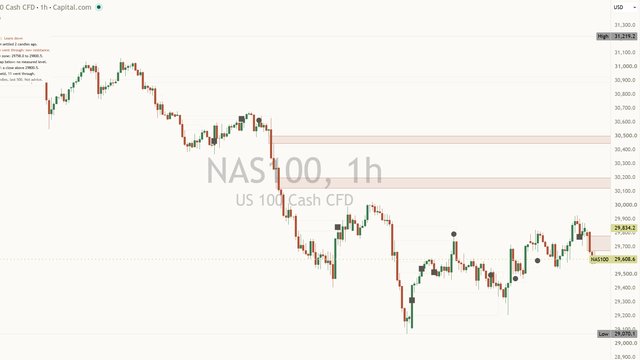 [TP] Fair Value Gaps - Mentor
A fast three-candle move drawn as a box, and what happened when price first came back to it.
Read the guide →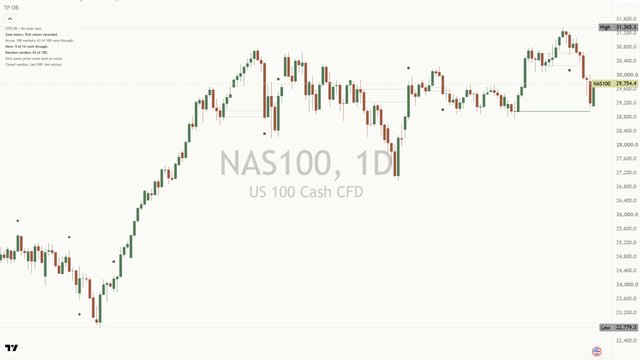 [TP] Order Blocks - Mentor
The last candle the other way before a break, kept on the chart with its first return counted.
Read the guide →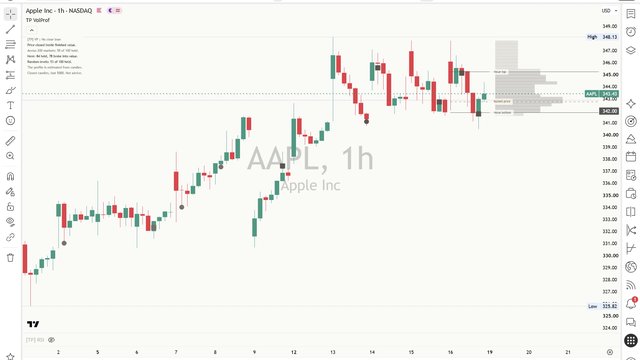 [TP] Volume Profile - Mentor
How much traded at each price in one finished period, and where price spent little time.
Read the guide →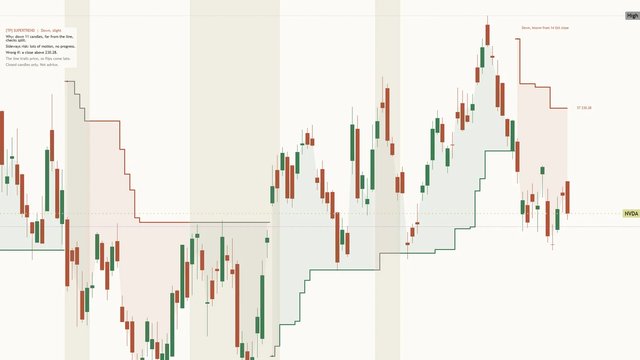 [TP] Supertrend - Mentor
The classic line with a plain read: which side price is on and how firm it is.
Read the guide →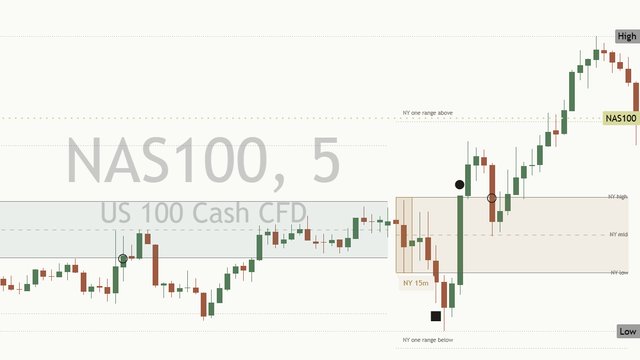 [TP] Opening Range - Mentor
The first minutes of Tokyo, London and New York, drawn on each city's own clock.
Read the guide →
[TP] Market Structure - MentorWhether confirmed swings are stepping higher or lower, and the close that would change the read.
Read the guide →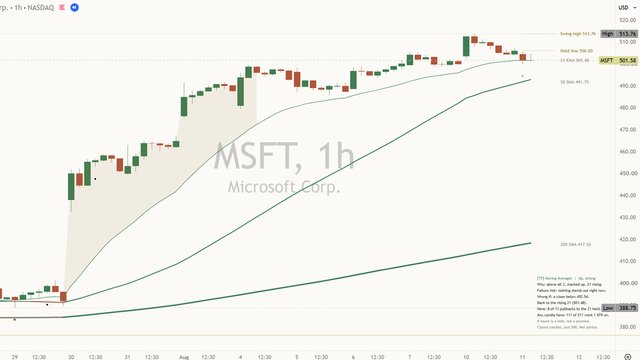 [TP] Moving Averages - Mentor
The 21, 50 and 200 lines in plain words: which side price is on and whether they are stacked.
Read the guide →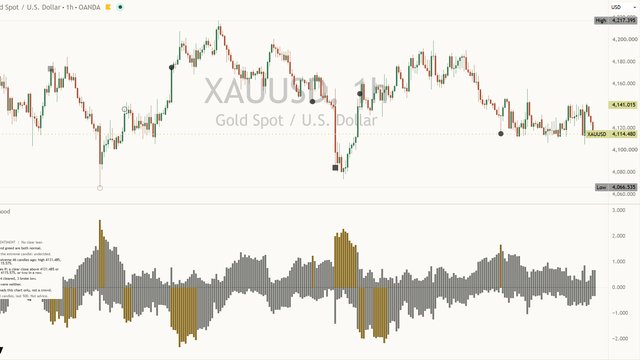 [TP] Sentiment - Mentor
Fear and greed read from this chart's own candles, and what followed past extremes.
Read the guide →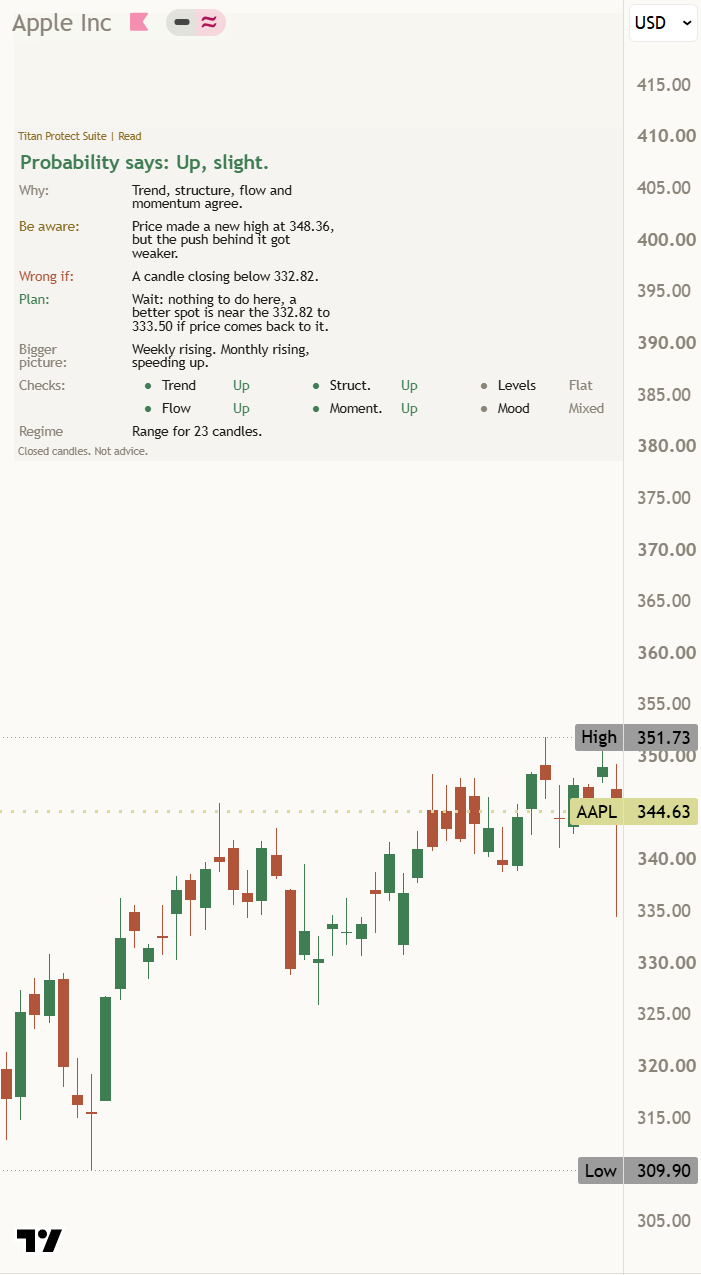 [TP] Read - Suite
One read of the chart: Up, Down or Sideways, how strong, and the close that would prove it wrong.
Read the guide →The Foundry / Reading
Start here: paper trading, discounted cash flow, stagflation.
 What ETFs mean for the ethical investor
Exchange-traded funds are the easiest way most people own the market. One ticker, one trade, instant diversification, low cost. For…
Read the article
 What Bonds and Yields Mean for the Ethical Investor
There is a puzzle at the heart of ethical investing that almost nobody explains properly. A conventional bond pays interest.…
Read the article
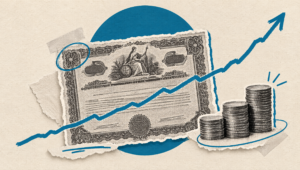 Bonds and Yields, Explained
More on the YouTube channel: new briefs daily. Subscribe so the next one reaches you.
Read the article
The Foundry / Film Room
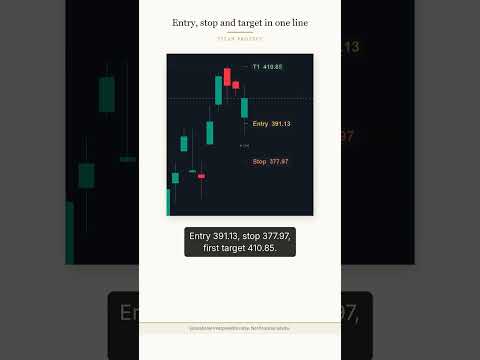
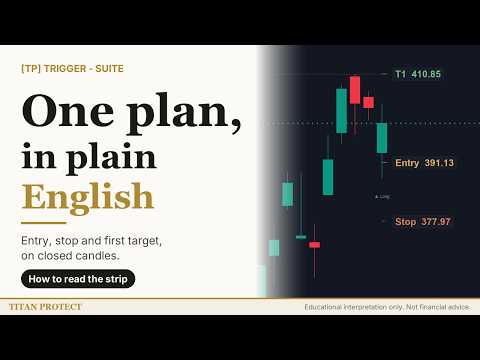
The desk reads market anatomy on film, then turns it into method you can reuse. Now showing: Entry, stop and target in one line.
Open Film RoomYour Titan Desk
Monitor the names that matter, understand market context and review your own process.
See How Members Use the DeskLeading sector · Health Care
The sector out in front over the last month, against the other ten.
Shield · risk lens
Read the market's mood before you open a deeper research path.
Floor · your journal
Your private research journal. Log each idea with its reasoning, then review how it actually played out.
Get our weekly market brief free.