Live · 25 Oct 2026 SPX 7,623.68 -0.52% NDX 28,957.53 +0.00% VIX 19.45 +2.21% GOLD 4,007.90 -1.29% CL 103.27 +3.82% BTC 80,740.13 -0.41%
Free TradingView indicator

[TP] Opening Range - Mentor

The opening range is the high and low of the first minutes of a session. Many traders mark it and watch which side price closes beyond. This indicator draws it for Tokyo, London and New York, each on its own city's clock, and tells you in plain words which textbook play is on your chart right now, with the level it measures.

Most opening range tools ask for a fixed time offset, so their boxes drift by an hour twice a year when the clocks change. This one reads every session on its home city's time, so it is right all year without an edit. When price closes beyond the range, the panel names the play: a break, the Classic ORB once the break has held four closes, a break and retest, or a failed break. It gives the level that play measures, and the close that would change the read. It never says what to do. It reads finished candles only.

Coming to TradingView on 10 Nov

--days--hours--mins--secs

How to read it
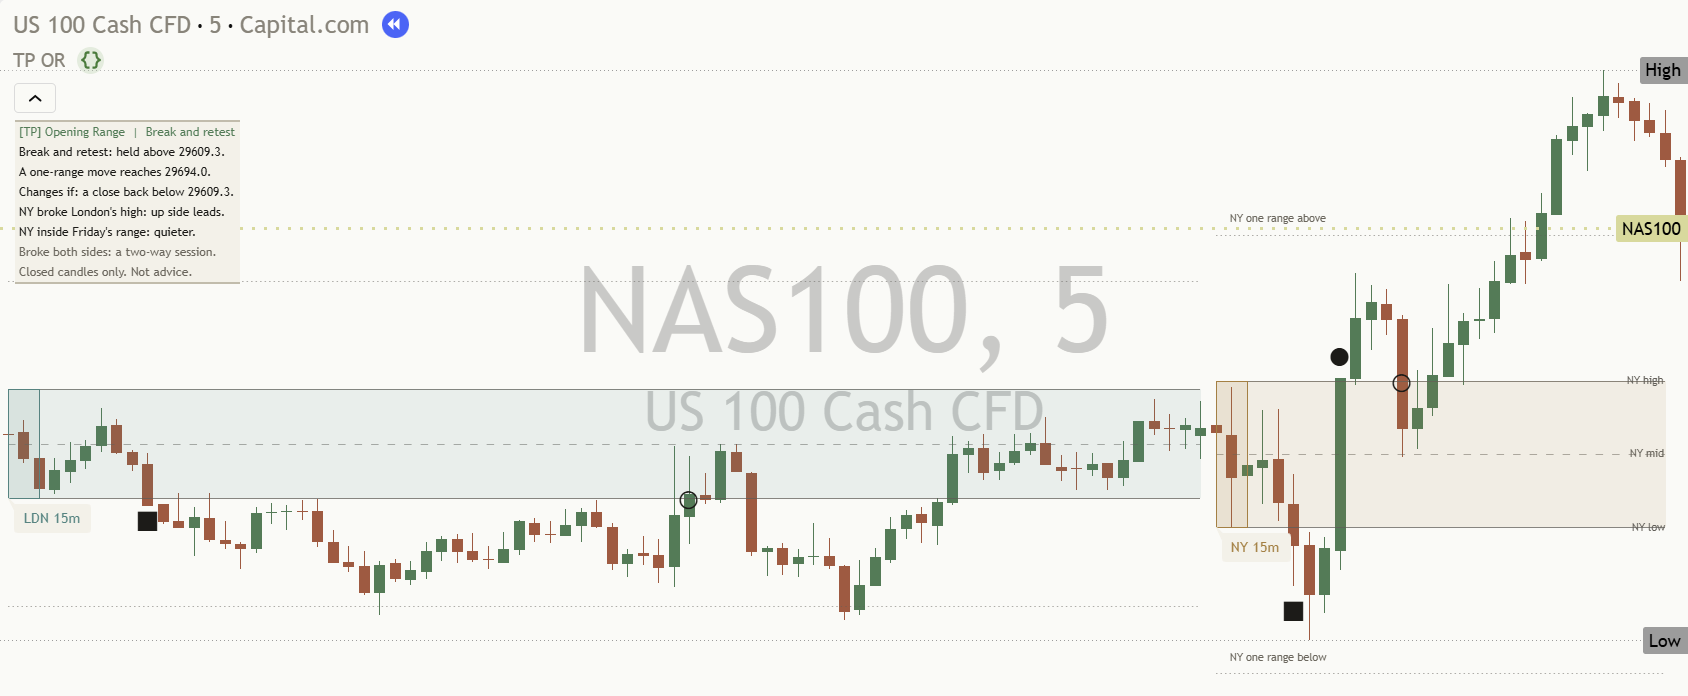
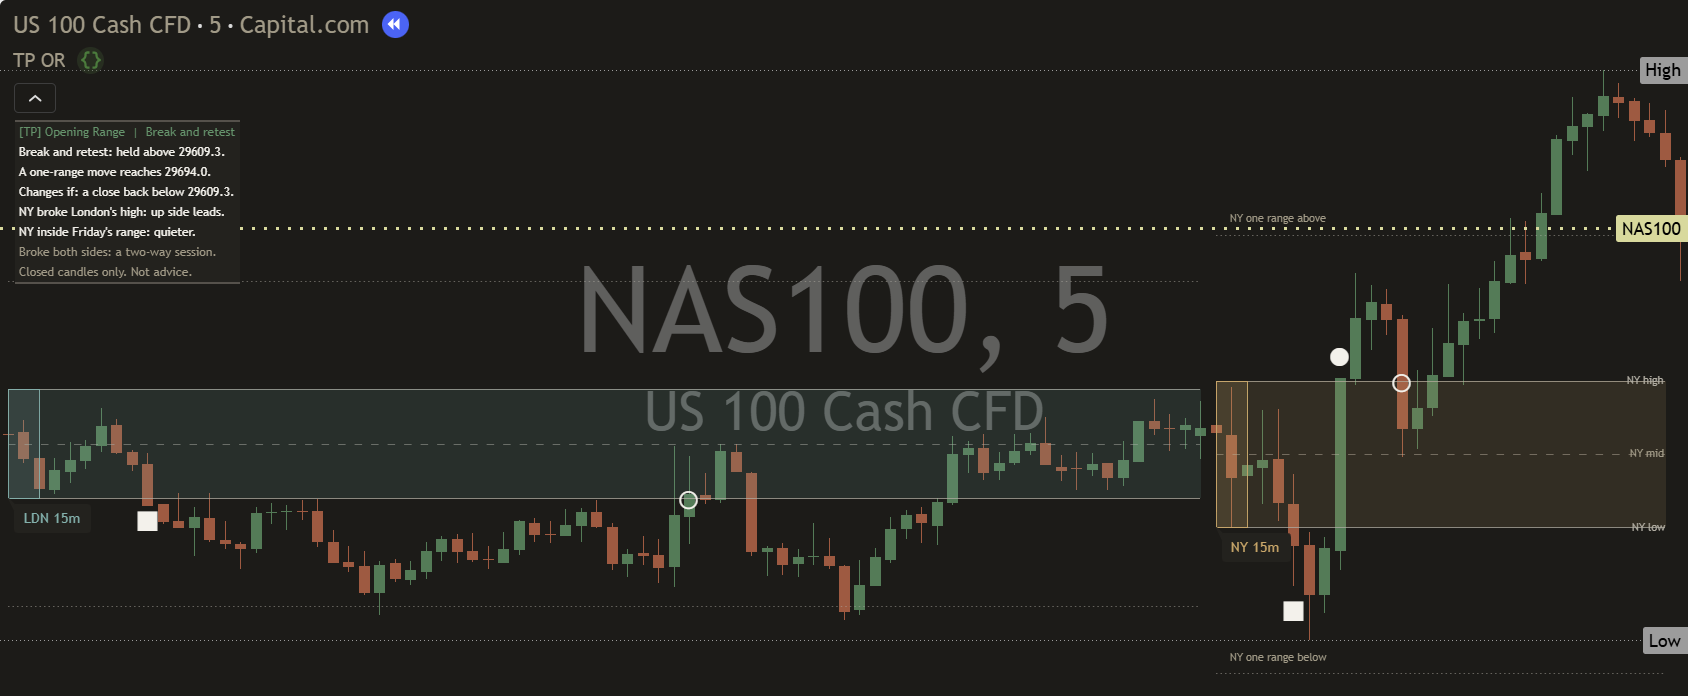
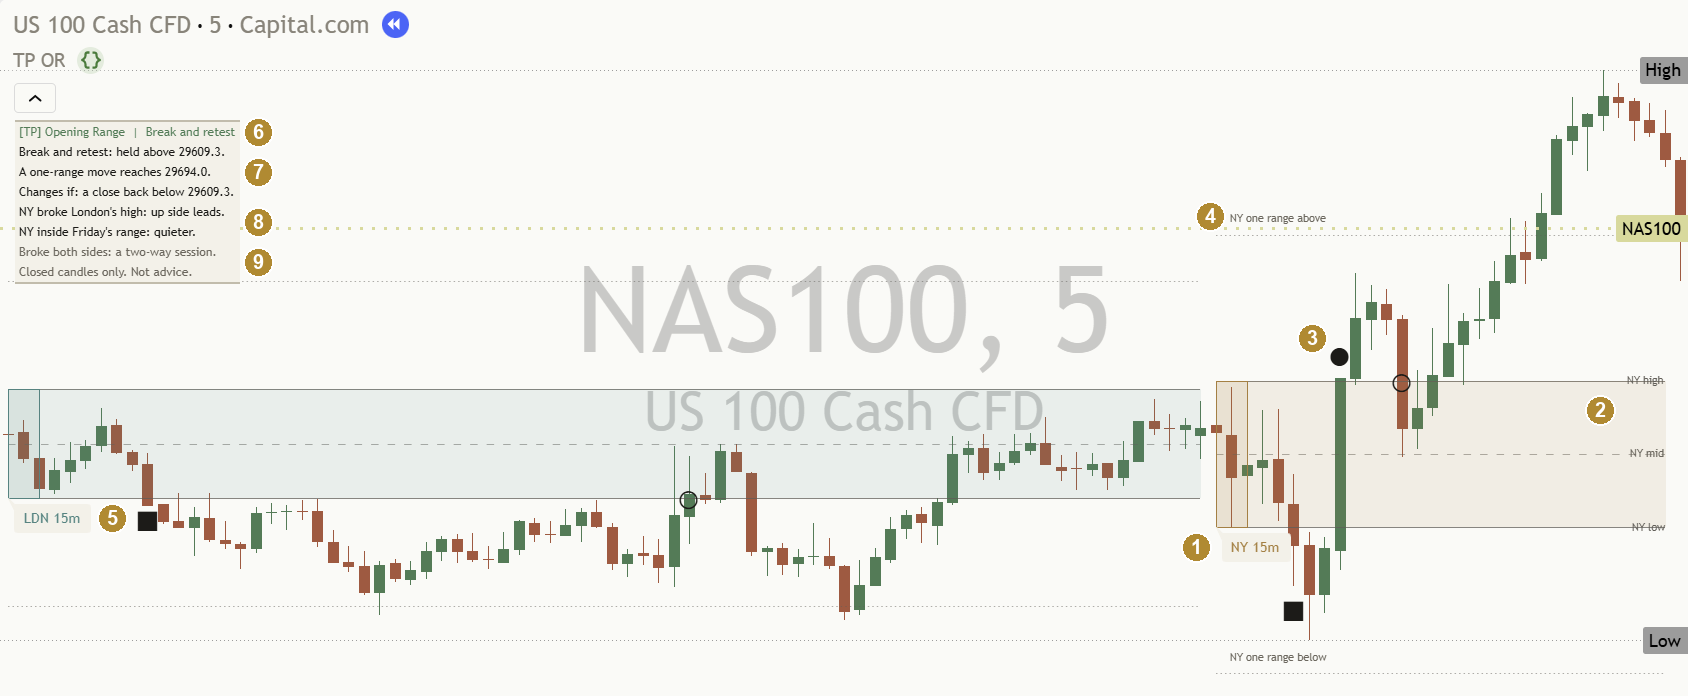
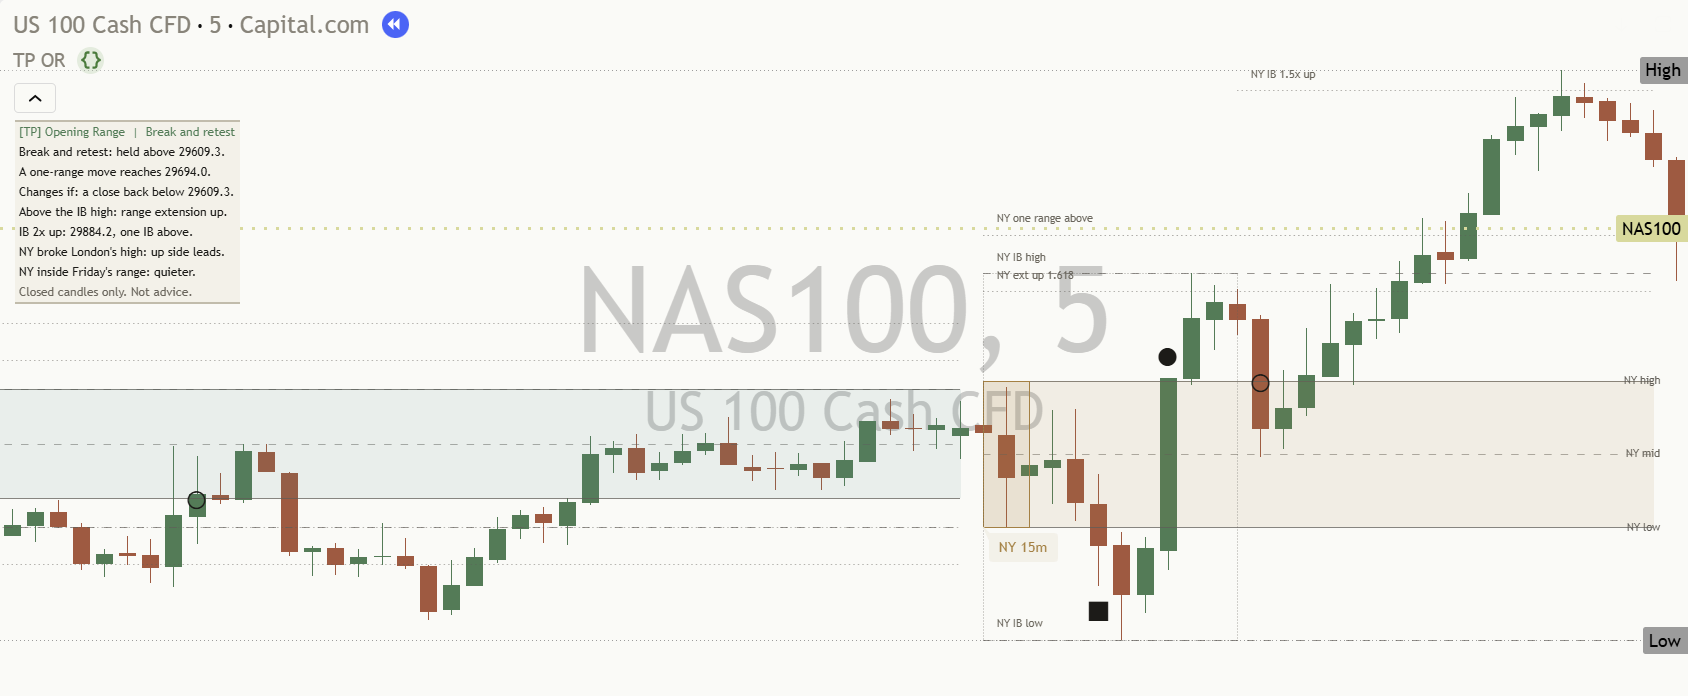
[TP] Opening Range - Mentor on a light NAS100 five-minute chart: the London and New York opening ranges as soft shaded boxes, a square, circle and ring where price closed beyond and back, the one-range lines above and below, and the Mentor panel at the top left naming a break and retest. [TP] Opening Range - Mentor on a dark NAS100 five-minute chart: the London and New York opening ranges as soft shaded boxes, a square, circle and ring where price closed beyond and back, the one-range lines above and below, and the Mentor panel at the top left naming a break and retest.
NAS100 five minutes, New York session, Monday 19 October 2026, with "One range above and below" switched on. A real chart, an example only, not a recommendation.

What it is in 30 seconds

The first minutes after a market opens often set the tone for the session, so the high and low of those minutes are among the oldest levels traders watch. Ours draws them right for every session, says in plain words what price has done with them, and names the textbook play when there is one. It describes what has happened. It does not say what comes next.

Every city on its own clock

Tokyo opens at 09:00 Tokyo time, London at 08:00 London time, New York at 09:30 New York time, all year. When the clocks change in one city and not the other, the boxes stay where they belong.

It names the play

A break, the Classic ORB, a break and retest, or a failed break, each with its level: "A one-range move reaches" a price, or "Opposite side in play" at the other edge. You get a level you can use on the chart.

It never says what to do

Every play comes with the close that would change it, and the panel reminds you: "A named play is a pattern, not a promise." No odds, no win rates, no arrows. Decisions stay with you.

What counts as an opening range here

Opening range tools disagree on the times, the length and what a break is, and most never say. This one uses one set of rules, built from your chart's own finished candles.

  1. 1. The window, on the city's clockEach session's range is its first 15 minutes by default (1 to 240, set per session), read on that city's own time. A candle belongs to the range if it opens inside the window.
  2. 2. Set when the window closesThe range is set on the candle that closes at the end of the window. Until then the panel says it is forming. After that, its high, middle and low never move.
  3. 3. Judged on closesA break is a finished candle closing beyond the high or low. A wick beyond decides nothing. A close back inside within 3 candles of the break is a failed break.
Daylight saving, handled

London and New York change their clocks on different weekends, and for a week or two each spring and autumn the gap between their opens is an hour shorter. Each session here follows its own city, so it is right in those weeks too.

Only on charts that fit

A 15 minute range needs candles that divide it evenly: 1, 3, 5 or 15 minutes. On a chart that does not fit, nothing is drawn and the panel names the charts that do. On daily charts it says: "Opening ranges need an intraday chart."

Stocks at their own open

On a stock or a fund, the range starts at the exchange's own first candle of the day, on the exchange's clock: 09:30 for a US stock, 09:15 for an Indian stock on the NSE. Forex, futures, gold and crypto use the city sessions.

The plays it names

These are the textbook opening range plays, from Toby Crabel, Mark Fisher, Mike Bellafiore, Linda Raschke and Larry Williams. The panel names one only while it is true on your chart, and only while the session is open. The prices below are the form of each line; on your chart they are that range's own prices.

Break above or below

The first finished close beyond the range. The panel counts the closes beyond as they come: "Above 2650.00 for 1 of 4 closes: early." Nothing is called held yet.

Classic ORB long, Classic ORB short

The break has held for 4 closes, the break candle included, without coming back to the edge. Why 4: a close back inside within 3 candles is a failed break, so the 4th close is the first that can no longer fail that way.

Panel, the form"Classic ORB long: held above 2650.00." / "A one-range move reaches 2662.50."

Break and retest

After the break, a later candle came back close to the broken edge (within about a third of a typical candle's size) and still closed beyond it.

Panel, the form"Break and retest: held above 2650.00."

Failed break

Price closed beyond the range, then closed back inside within 3 candles. The panel names the other edge, because that is the side now in play, and the close that would change the read.

Panel, the form"Failed break: back inside the range." / "Opposite side in play: 2637.50."

The measured level

"A one-range move" is the range's own height added beyond the broken edge. A 12.50 range broken at 2650.00 measures 2662.50. It is a distance on the chart, not a promise that price gets there, and the panel says so: "A measured move is a distance, not a goal."

What it will not say

It names the play and the level the play measures. It never tells you to act on it, never shows a price to get out at, a position size or a percentage, and never shows how often a play worked in the past. The plays are patterns traders have written about for decades, not promises. Every play line comes with a "Changes if" line, so the other side of the story is always on the panel.

Each part, up close

Up and down are treated the same way, mirrored. The marks use shapes, never arrows, and the range's colour only ever means which session it is, never which way price went.

Or el range paper Or el range ink

 The range box and its tag

Each range is a thin outline with a light fill in its session's colour: Tokyo plum, London teal, New York amber, Sydney slate, your own session grey. The small tag at its start says which session and how many minutes. Hover it for the high, the low and the size.

The chart keeps the last 3 ranges of each session by default ("Ranges kept per session", 1 to 10). Older ones leave oldest first, so the chart stays calm.

Back to the chart
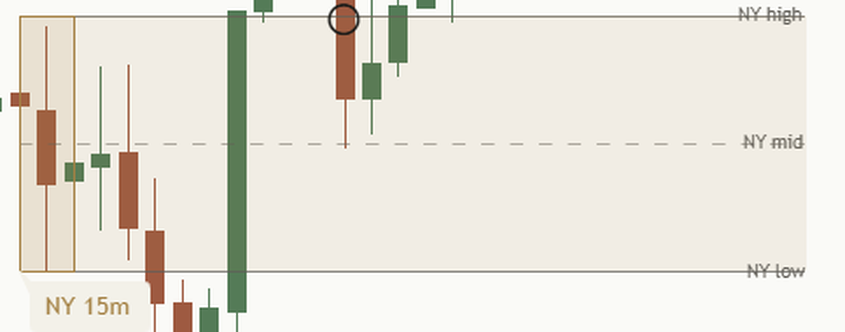
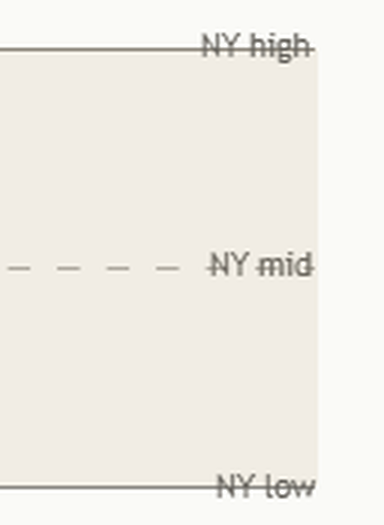
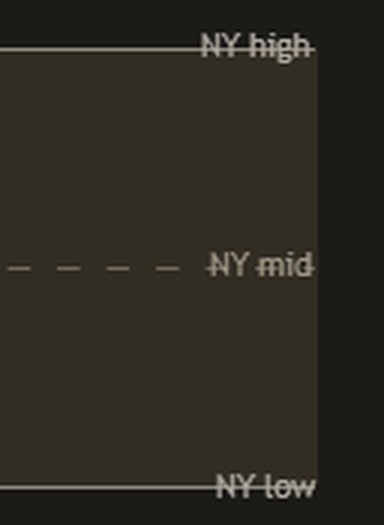
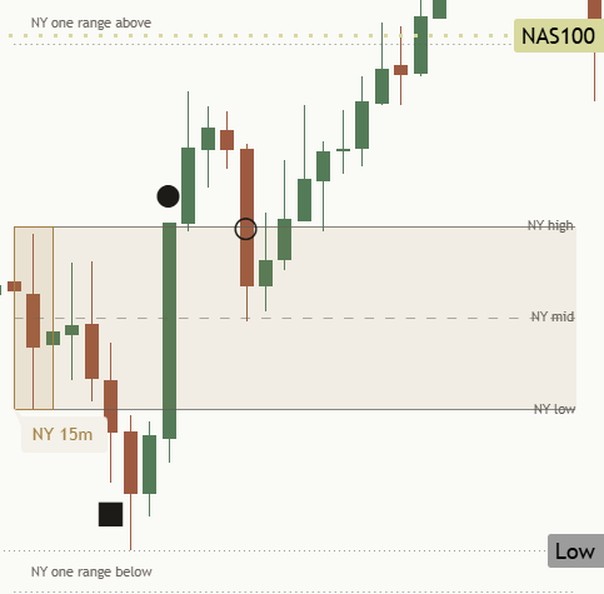
Close-up of the right end of the New York range on a light chart: the high and low as solid lines and the middle as a dashed line, each named NY high, NY mid and NY low. Close-up of the right end of the New York range on a dark chart: the high and low as solid lines and the middle as a dashed line, each named NY high, NY mid and NY low.

High, mid and low

The high and low are solid lines in a plain neutral colour, and the middle is a lighter dashed line ("Show midline", on). They run to the session's close, or on to the next open with "Carry lines to the next open". The current range's three prices also sit on the price scale.

Whether price closes in the top or bottom half of the range is one of the simplest reads there is. On Full detail the panel says which half price is in.

Back to the chart
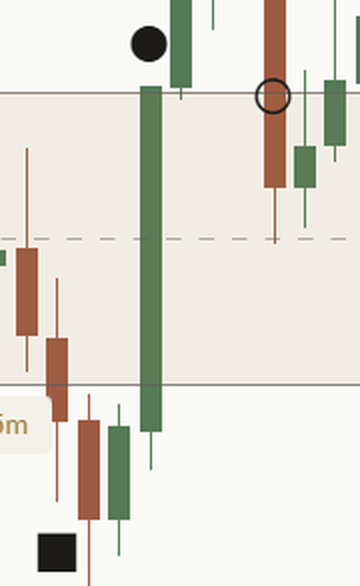
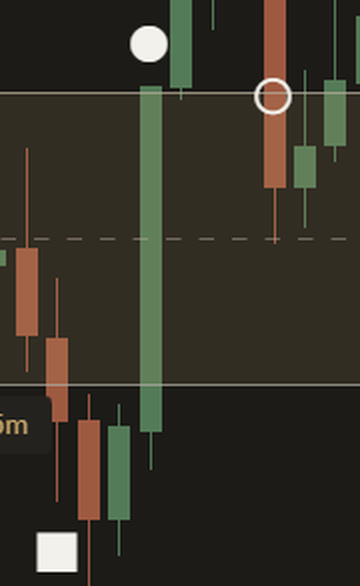
Close-up of the break marks on a light chart: a square under a candle that closed below the range, a filled circle above the candle that closed above it, and a ring on the high where a later candle closed back inside. Close-up of the break marks on a dark chart: a square under a candle that closed below the range, a filled circle above the candle that closed above it, and a ring on the high where a later candle closed back inside.

   Break marks

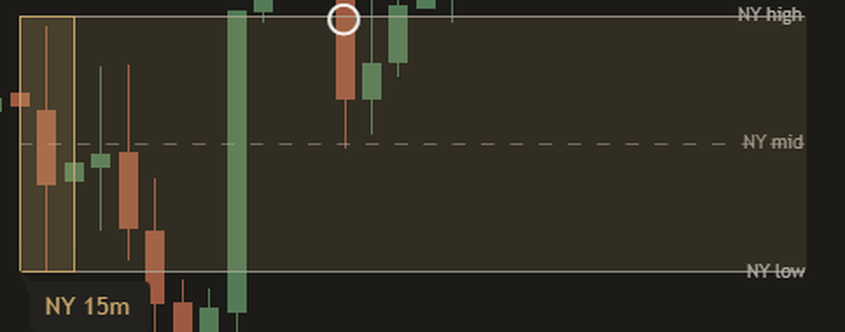
A filled circle marks the first close above the range, just above that candle. A square marks the first close below it, just under that candle. A ring marks the first close back inside, on the line price came back through. Each appears once per range, when the candle has closed, and never moves.

On this chart New York first closed below its range, then one big candle closed straight above it, and a few candles later one candle closed back inside before price went on above. The marks are in one plain colour, so the shape carries the meaning. "Marks drawn" keeps the last 12 across all sessions.

Back to the chart
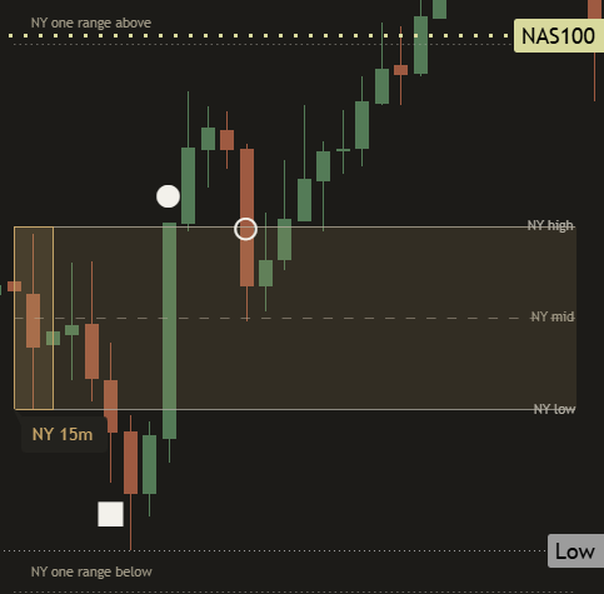
Close-up of the one-range lines on a light chart: a thin dotted line one range height above the New York high and another one range height below the low, each named in small muted text. Close-up of the one-range lines on a dark chart: a thin dotted line one range height above the New York high and another one range height below the low, each named in small muted text.

One range above and below

With "One range above and below" on (off by default), two thin dotted lines sit one range height beyond the high and the low. They show the range's own size as a distance on the chart. This is the level the panel names as "A one-range move reaches".

In "Plays and levels" you can add more measured levels: "Range extensions (1.272, 1.618, 2.0)", the "Prior day high and low", and the "Initial Balance (London and New York)", the high and low of the first hour with lines half an hour's range and one full range beyond. "Nearest levels only" (on) draws just the two measured levels nearest price on each side, so the chart stays readable.

Opening range mentor levels nas100 5m
Extra levels on, "Nearest levels only" on: two measured levels on each side of price.
Back to the chart
Close-up of the earlier London opening range on a light chart: a soft teal box with its LDN 15m tag, kept on the chart while the New York session trades. Close-up of the earlier London opening range on a dark chart: a soft teal box with its LDN 15m tag, kept on the chart while the New York session trades.

 An earlier session

Earlier sessions stay on the chart in their own colours, so the next session can be read against them. The panel compares New York with London and Tokyo, and London with Tokyo, using where each earlier session's high and low stood when the later one opened.

When a later session trades beyond an earlier one's high or low without a single close beyond it, then comes back inside, the panel says so plainly, for example "London swept Tokyo's high, back inside."

Back to the chart
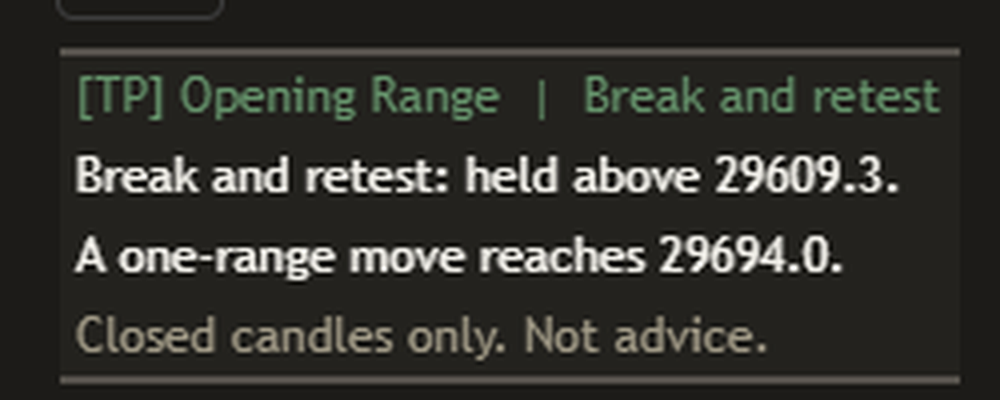
Close-up of the panel header on a light chart: [TP] Opening Range | Break and retest, in the up colour. Close-up of the panel header on a dark chart: [TP] Opening Range | Break and retest, in the up colour.

Header

The header gives the answer first: the state of the latest session, or the play when one is live. "No range yet", "Forming", "Inside the range", "Break above", "Classic ORB long", "Break and retest", "Failed break", "Back inside", and after the close "Broke up, held" or "Session over".

Only the header carries colour: the up colour above the range, the down colour below it, gold for inside, back inside or a failed break. Everything under it is plain text.

Back to the chart
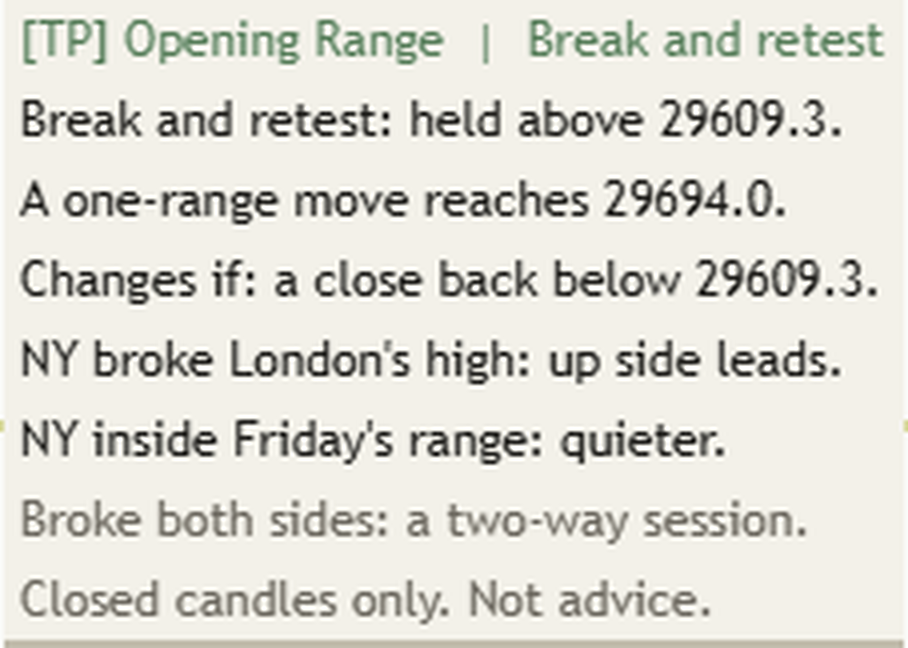
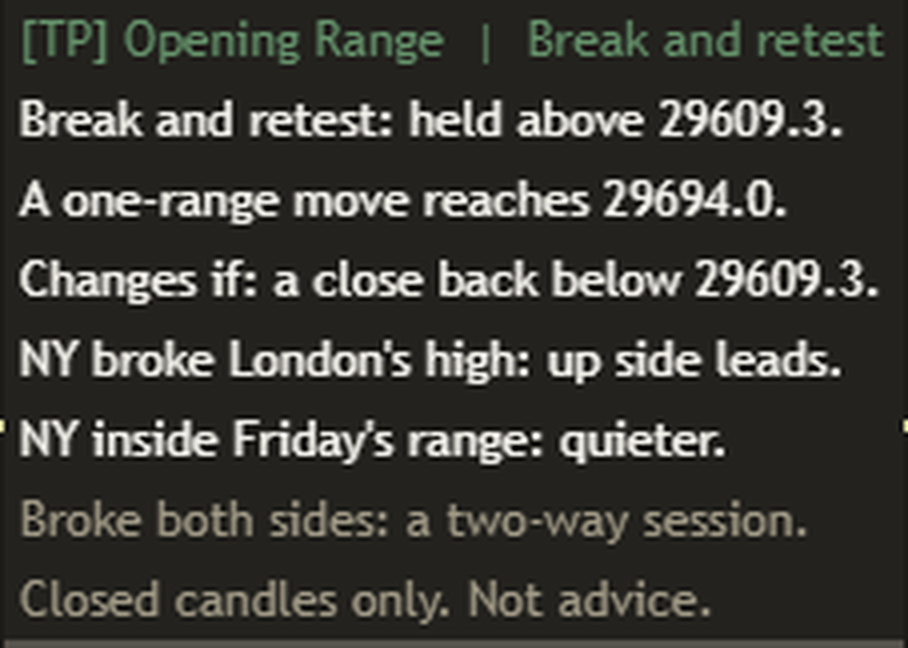
Close-up of the Standard Mentor panel on a light chart: the header, the break and retest line, the one-range move, the change line, two session context lines, the teaching line and the footer. Close-up of the Standard Mentor panel on a dark chart: the header, the break and retest line, the one-range move, the change line, two session context lines, the teaching line and the footer.

The play rows

Under the header, three rows carry the play: what happened, the level it measures, and the close that would change it. The Standard panel on the chart at the top of this page (NAS100, five minutes, New York, 19 October 2026), word for word, top to bottom:

  • The header: "[TP] Opening Range | Break and retest"
  • The play: "Break and retest: held above 29609.3."
  • The measured level: "A one-range move reaches 29694.0."
  • What would change it: "Changes if: a close back below 29609.3."

Read it plainly: New York's range ran from 29524.6 to 29609.3, a size of 84.7. Price broke above it, came back close to the high and still closed above. One range height above the high is 29694.0. A close back under 29609.3 would end this read.

Back to the chart
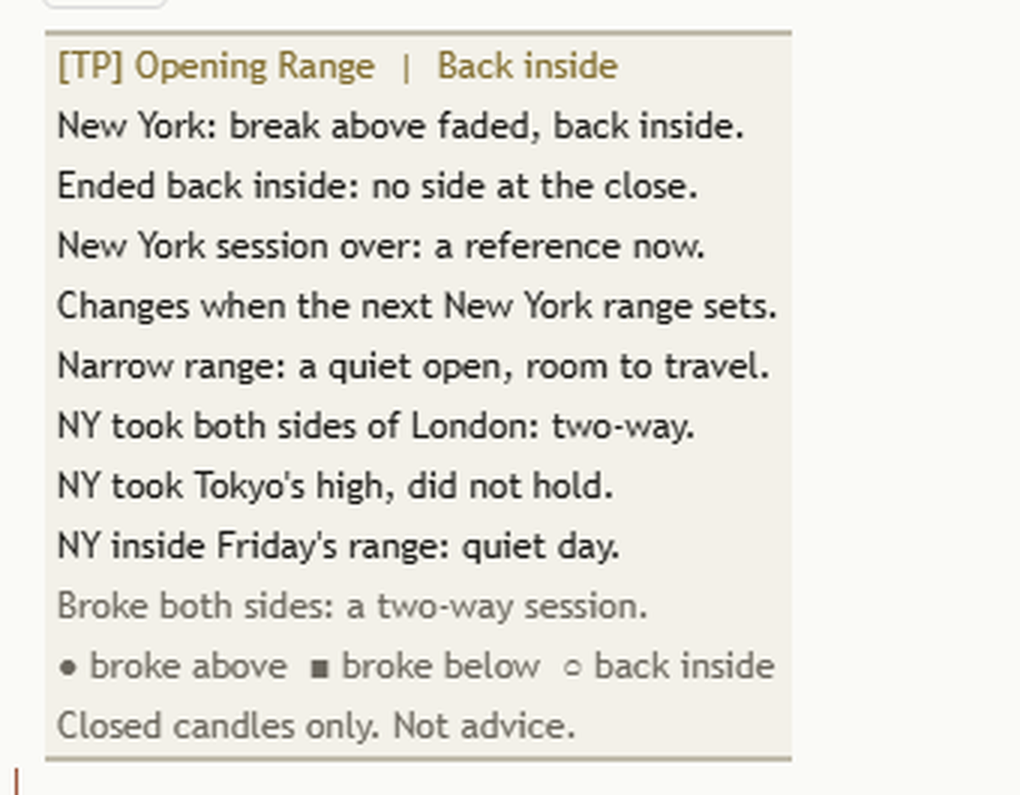
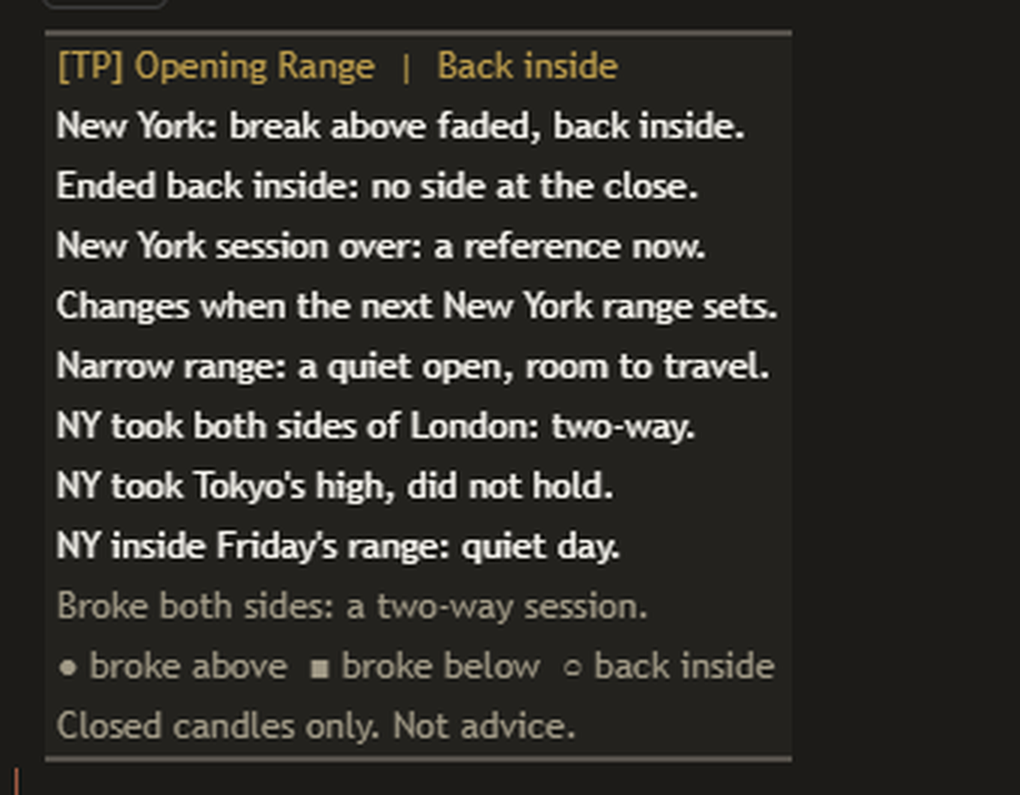
Close-up of the Full panel on a light chart after the New York close: the state, the size of the range, and three lines on how New York sat against London, Tokyo and the previous day. Close-up of the Full panel on a dark chart after the New York close: the state, the size of the range, and three lines on how New York sat against London, Tokyo and the previous day.

Session context

Below the play, the panel says how this session sits against the others, each as a plain fact with what it means. On the chart at the top of this page:

  • Against today's earlier session: "NY broke London's high: up side leads."
  • Against its own session the trading day before: "NY inside Friday's range: quieter."

It also says where the session opened against the prior trading day's range and whether it tested that day's high or low. Standard shows the two lines that matter most; Full shows them all. If a context line reads the other way from a live play, Standard leaves it out and Full keeps it with "Wider references read the other way." Once the session is over, the lines turn to the past tense, as in this Full panel from an earlier test build.

Back to the chart

Teaching line and footer

The muted line near the bottom is a brief lesson. While a play is live it reads "A named play is a pattern, not a promise." Otherwise it changes with each new range: "The range is a reference line, not a wall.", "A failed break is a fact, not a forecast.", "The first minutes set a range, not a day.", "Wide ranges leave less room; check the size." or "Each session opens in its own city's time." When a session has closed beyond both sides, it says "Broke both sides: a two-way session."

The footer is always the same: "Closed candles only. Not advice."

Back to the chart
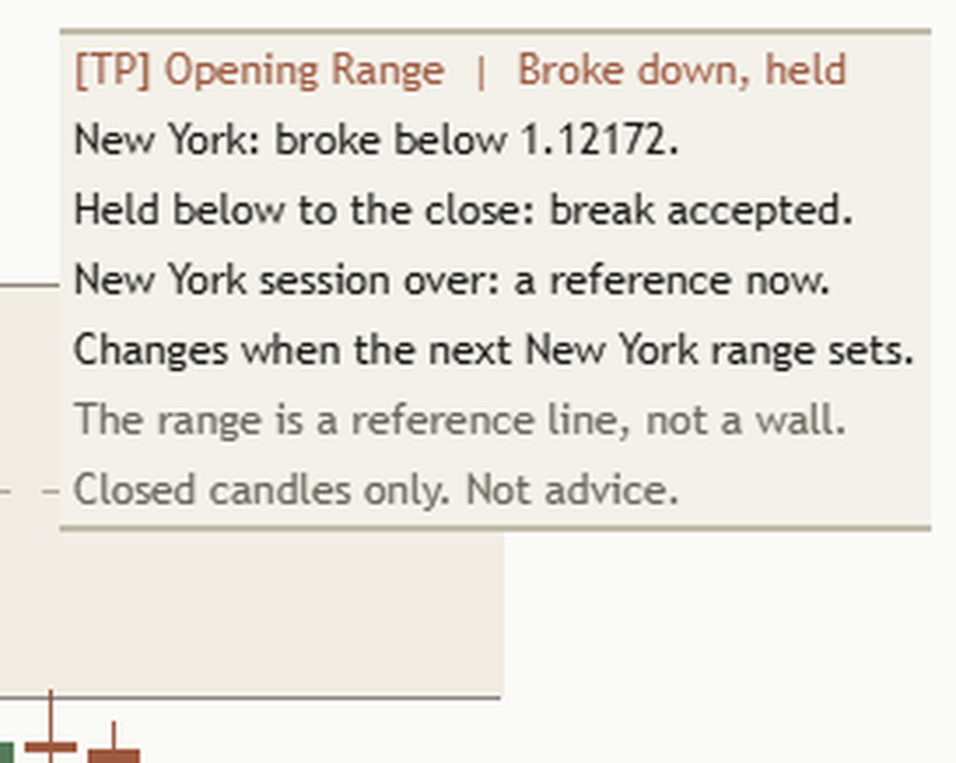
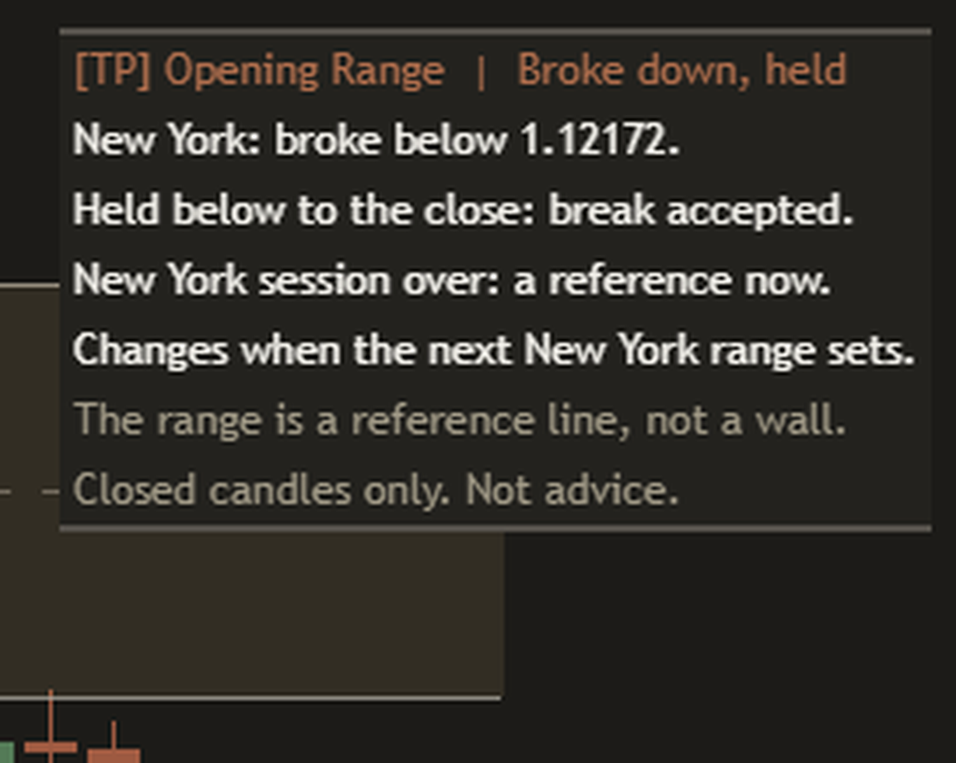
Close-up of the panel after the New York close on a light chart: broke down, held below to the close, and a note that the range is now a level to read the next session against. Close-up of the panel after the New York close on a dark chart: broke down, held below to the close, and a note that the range is now a level to read the next session against.

After the close

Once a session is over, its plays are no longer named. The panel says how it ended instead, in the past tense: "Broke down, held" with "Held below to the close: break accepted.", or "Broke up, late" with "Ended above after only 2 of 4 closes." when the session closed before the break had held 4 closes. The range then stays on the chart until the next one.

Back to the chart

Three panel layouts

Phone

Four lines in Tiny text: the header, the play or state, its measured level, and the footer.

The Phone panel on a dark chart: [TP] Opening Range | Break and retest, the play line, the one-range move and the footer.
Standard (default)

The play rows, up to two context lines, the teaching line and the footer. About seven lines.

Full

Everything in Standard, plus every context line, the size of the range against this chart's last 20 ranges of that session, the measured levels you switched on, and the mark key.

How the Mentor helps you at every level

Same indicator, same panel. What you get from it grows with you. The quoted lines are the panel's own words. Prices marked as the form of a line are there to show its shape, not read from a chart.

  1. Level 1

    Beginner

    What gets in the way

    • Boxes drawn at the wrong hour, because the tool was set to a fixed time offset.
    • Treating the range's edges as walls price has to respect.
    • Reading a wick poking out of the range as a break.

    The habit it builds: seeing the opening range as the first minutes of a session, on that city's clock, judged on closes.

    What the Mentor says

    Teaching line"The range is a reference line, not a wall."

    Teaching line"Each session opens in its own city's time."

  2. Level 2

    Intermediate

    What gets in the way

    • Calling a break on the first close beyond the range, before it has held.
    • Not noticing when price slips back inside within a few candles.
    • Forgetting how big the range was before judging how far price went.

    The habit it builds: counting the closes beyond the edge, and naming a failed break as soon as it is one.

    What the Mentor says

    Break, the form"Above 2650.00 for 1 of 4 closes: early."

    Failed break"Failed break: back inside the range."

  3. Level 3

    Advanced

    What gets in the way

    • Mixing up a break that came back and held with one that failed.
    • Reading a measured level as a place price must reach.
    • Forgetting the close that would end the read.

    The habit it builds: the play, its measured level and its change line, read together as one thought.

    What the Mentor says

    NAS100 five minutes, 19 Oct 2026"Break and retest: held above 29609.3."

    Same chart"A one-range move reaches 29694.0."

  4. Level 4

    Expert

    What gets in the way

    • Reading one session in isolation, without the sessions before it.
    • Treating a sweep of an earlier session's high as a break.
    • Letting the play's name stand in for the reasons behind it.

    The habit it builds: a steady second pair of eyes: this session against today's earlier ones and against yesterday, with the limit every time.

    What the Mentor says

    Session context, 19 Oct 2026"NY broke London's high: up side leads."

    Teaching line"A named play is a pattern, not a promise."

It reads both sides the same way

Above the range Held 4 closes

Classic ORB long. The one-range move is measured above the high.

The form"Classic ORB long: held above 2650.00."

Below the range Held 4 closes

Mirrored: Classic ORB short, measured below the low.

The form"Classic ORB short: held below 2637.50."

Back inside Within 3 candles

A failed break. The other edge is in play.

The form"Opposite side in play: 2637.50."

Three things to remember

  1. Closes decide. A wick beyond the range is not a break, and a break is only named the Classic ORB once it has held 4 closes.
  2. Read the change line too. Every play comes with the close that would end it. A play can fail on the next candle.
  3. A measured level is a distance. "A one-range move reaches" a price says how far one range height is. It does not say price will get there.

Honest about timing, honest about limits

Finished candles only

The range is set when the candle at the end of the window closes, and every state, mark, play and alert waits for a finished candle. Nothing changes because of the candle that is still forming, and a reloaded chart shows exactly what it showed live. Bar Replay shows what the panel said at the time.

What it does not do

No arrows, no percentages, no odds and no count of how plays turned out before. It does not say why price broke, who was behind it, or what comes next. Every price on the panel comes from the ranges on the chart you are on. A holiday with no candles in the window gives no new range, and the panel keeps reading the last one as "Session over".

Change the range length and the range, the plays and the levels all change with it. No length is the right one; 15 minutes is the common choice.

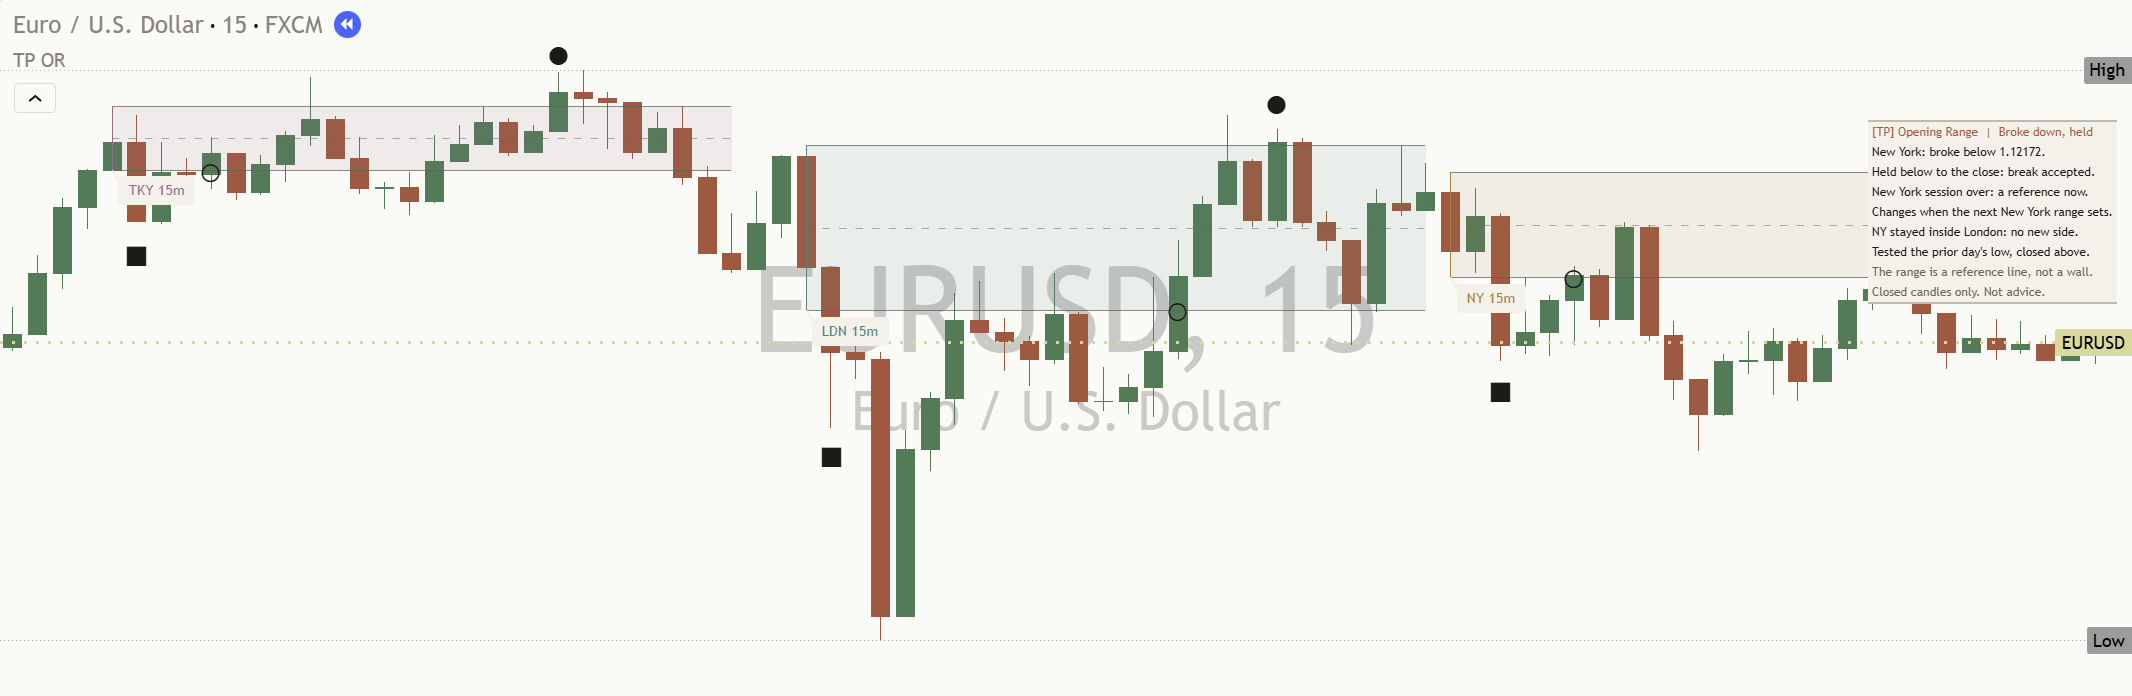
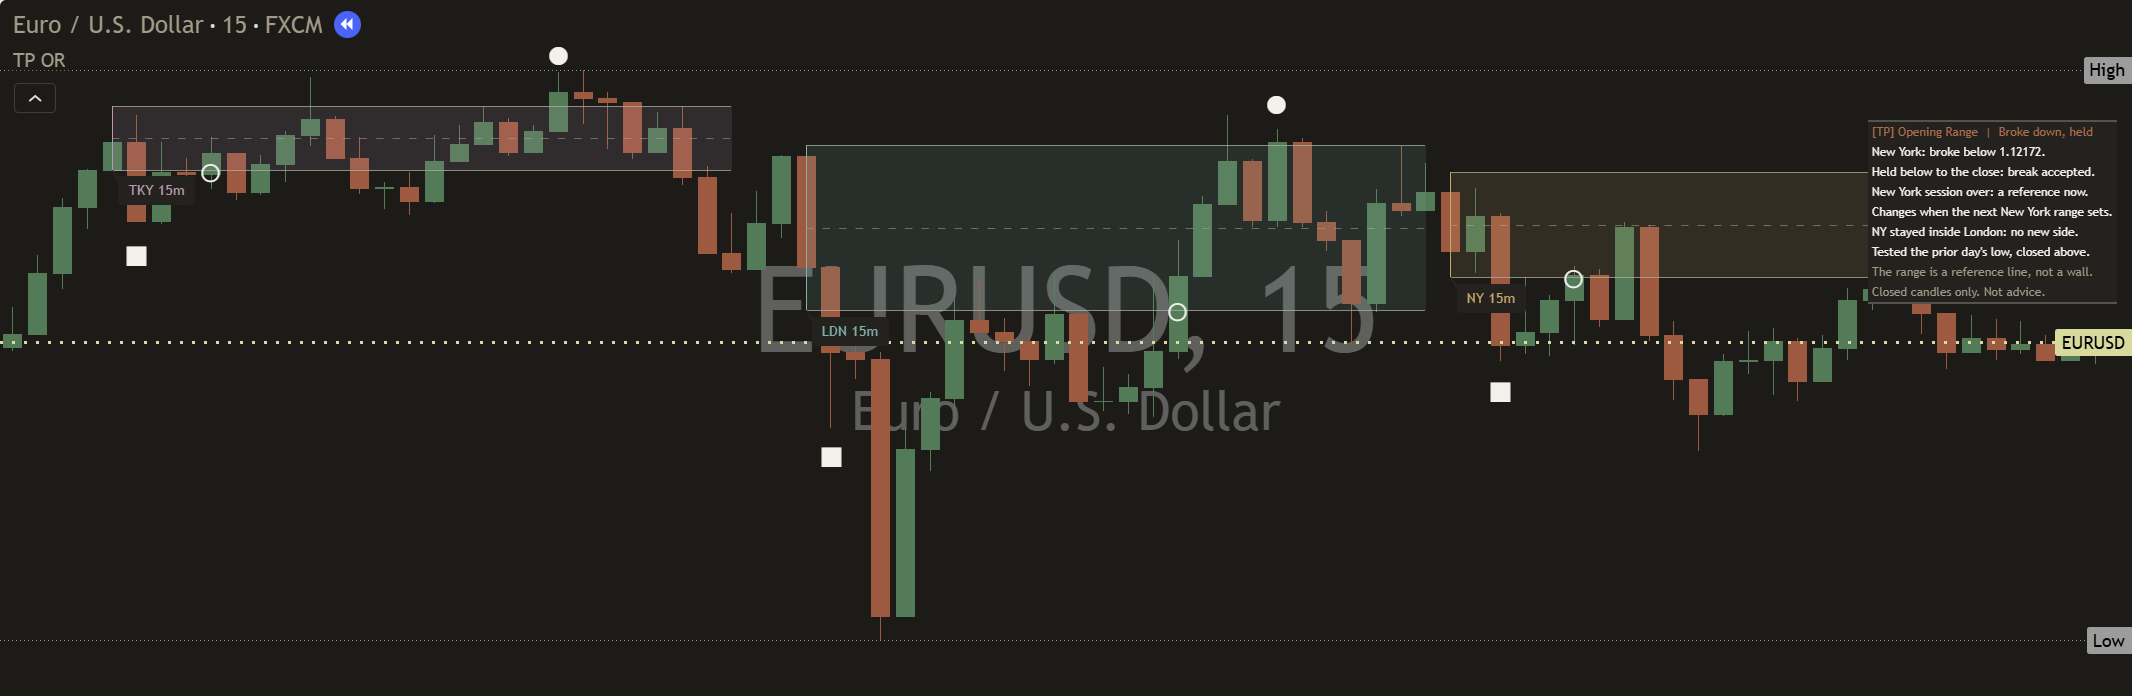
EURUSD fifteen-minute chart with the Opening Range Mentor at default settings: the Tokyo, London and New York ranges in their own soft colours, break marks on each, and the panel after the New York close. Dark EURUSD fifteen-minute chart with the Opening Range Mentor at default settings: the Tokyo, London and New York ranges in their own soft colours, break marks on each, and the panel after the New York close.
EURUSD fifteen minutes, default settings: Tokyo, London and New York on one chart, each on its own clock, read after the New York close.
The Phone panel on a dark chart, four lines readable at phone width.
At phone width, the Phone layout keeps it to four lines in Tiny text.

Settings

The defaults work out of the box: Tokyo, London and New York on, 15 minute ranges, the Standard panel. These are the settings worth knowing.

On a small screen, swipe the table sideways to see every column.
SettingWhat it doesDefault
Sydney / Tokyo / London / New York, Range length in minutesWhich sessions to draw, and the length of each one's range (1 to 240 minutes). Each can have its own length, for example London 15 and New York 30.
SydneyTokyoLondonNew York
Tokyo, London, New York on; 15
Stocks: use the exchange's own openOn a stock or fund, the range starts at the exchange's own first candle of the day, on its clock, with its own length.On; 15
Ranges kept per session / Show midline / Line namesHow many past ranges of each session stay on the chart (1 to 10), the dashed middle line, and the names at the line ends.3; On; On
One range above and below / Carry lines to the next open / Yesterday's high and lowDotted lines one range height beyond each side; lines that run on to the next open; and the same session's high and low from the day before.Off; Off; Off
Weekends tooAdds Saturday and Sunday, for markets that trade all week.Off
Range extensions (1.272, 1.618, 2.0) / Prior day high and lowMeasured lines 0.272, 0.618 and one full range beyond each side (a Fibonacci convention, not evidence), and the prior trading day's high and low. The panel reads the prior day even with its lines off.Off; Off
Initial Balance (London and New York) / IB 1.5x and 2x linesThe high and low of the first hour of London and New York (5 to 240 minutes), with lines half a first-hour range and one full first-hour range beyond.Off, 60; On
Nearest levels onlyOf the measured levels you switched on, draws only the two nearest price on each side. Turn it off to see them all.On
Open times (each city's own clock)The open of each session, in that city's local time.Sydney 10:00, Tokyo 09:00, London 08:00, New York 09:30
Custom session (Name, City clock, Open, Range length in minutes, Read the range for hours)Your own session on any of 14 city clocks or UTC, for example an overnight range or a local exchange.Off; 00:00 New York, 390 minutes, 16 hours
Mark breaks / Marks drawn / Mark sizeThe circle, square and ring, how many to keep across all sessions (0 to 30), and how big they are.
TinySmallNormalLarge
On; 12; Normal
Show the Mentor panel / Panel detailPhone shows four lines, Standard adds the change line and context, Full adds everything.
PhoneStandardFull
On; Standard
Where to put the panelAuto picks the top corner with the most empty room above the candles, or pick any of nine spots.
AutoTop LeftTop Right
Auto
Panel text size / ColoursTiny is the usual choice for a phone. Colours on Auto matches your chart: Paper on a light chart, Ink on a dark one.
TinySmallNormalLarge
Tiny; Auto
Plain-words alertsOne alert that describes each event in words, with the prices.On

Every setting has a small (i) next to it. Hover over it, or tap it on a phone, and it explains that setting in plain English, right there on your chart.

Light or dark, it matches

The ranges, marks and panel come in a warm light and a warm dark palette. With "Colours" on Auto, it reads your chart background and picks the right one. The marks keep their shapes in both, so their meaning never depends on colour.

Alerts

Each alert says what happened, once, after a candle closes, with the prices. None of them tells you what to do.

For the full sentence with the prices, create one alert on this indicator with "Any alert() function call". It names the session, the play, the edge and the measured level, for example:

  • Range setLondon: the opening range is set, high X, low Y.
  • BreakLondon: break above, a candle closed above the range high X. It reads as a Classic ORB long once it holds 4 closes. A one-range move reaches Y.
  • Classic ORBLondon: Classic ORB long, held above the range high X for 4 closes. A one-range move reaches Y.
  • Break and retestLondon: break and retest, came back to the high X and held above it. A one-range move reaches Y.
  • Failed breakLondon: failed break, back inside the range. Opposite side in play: Z.
  • First hourNew York: a candle closed above the Initial Balance high X, range extension up.
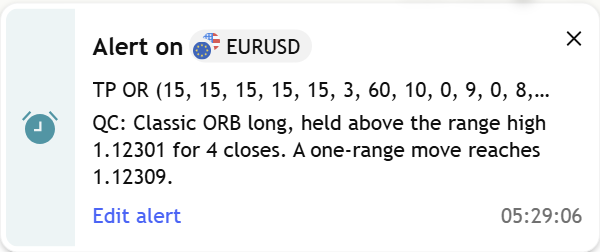
A TradingView alert pop-up from the indicator: Classic ORB long, held above the range high 1.12301 for 4 closes. A one-range move reaches 1.12309.
An alert as it arrives, from a test session on a one-minute euro chart (20 October 2026).

TradingView's alert dialog also lists 32 conditions by name, if you want one event only: "<session> range set", "<session> closed above", "<session> closed below" and "<session> failed break" for Sydney, Tokyo, London, New York, Custom and the Exchange open; "Classic ORB long (any session)", "Classic ORB short (any session)", "Break and retest (any session)" and "Failed break (any session)"; and the four first-hour conditions for London and New York. "Plain-words alerts" in the settings switches the sentence alert off.

Learn more

Start with the lesson, then watch the indicator explained.

Foundry lesson

The opening range: the first minutes, and what price did with them

What the opening range is, why each session needs its own city's clock, what counts as a break, and how to read the three textbook plays and their measured levels without treating them as promises. Concept first, indicator second, with a quiz.

Open the lesson
Trading journal

Keep a study log

Note each session's range and size, write what you expect before the first close beyond it, then write down which play it turned into, right or wrong. Over time your own notes show you more than any single chart.

Coming soon

Watch it explained

Coming soon Video, about 2 minutes

How to read [TP] Opening Range - Mentor

Every part of the indicator, one at a time, on real charts: the session boxes on their own clocks, the high, middle and low, the marks, the named plays with their measured levels, and the session context.

Coming soon Video, about 2 minutes

The opening range explained: three plays, one honest read

What the opening range is, why the clocks matter, what makes a break, a Classic ORB, a break and retest or a failed break, and why a measured move is a distance, not a goal. Concept first, then the indicator.

One concept, read well

[TP] RSI - Mentor, [TP] Volume - Mentor, [TP] Market Structure - Mentor, [TP] Trend - Mentor, [TP] VWAP - Mentor, [TP] Fibonacci - Mentor, [TP] MACD - Mentor, [TP] Bollinger Bands - Mentor, [TP] Regime - Mentor, [TP] Market Board - Mentor, [TP] Order Blocks - Mentor, [TP] Support and Resistance - Mentor, [TP] Volume Profile - Mentor, [TP] Opening Range - Mentor and [TP] Elliott Wave - Mentor each read one thing deeply, for free. Markets rarely move on one thing. The full Titan suite reads them together: momentum, volume, trend structure and flow, combined into one plain-English read.

Questions

Is it free?

Yes. [TP] Opening Range - Mentor will be free on TradingView from 10 November 2026. Add it from the Indicators menu. Nothing is locked.

What is the opening range, in plain words?

The highest and lowest price of the first few minutes of a session, most often the first 15. It is a small map of where the session started. What price does next, relative to that map, is what the panel reads.

Which sessions, and what happens when the clocks change?

Tokyo, London and New York are on by default; Sydney and your own custom session are one click away. Each is read on its home city's local time, so when the UK or the US changes its clocks, the box stays on that city's open. You never edit a time offset.

Does it repaint?

No. The range is set when the candle at the end of the window closes, and every state, mark, play and alert waits for a finished candle. Once a range is set, its high, middle and low never move.

Why does the Classic ORB need 4 closes?

Because a close back inside within 3 candles of the break counts as a failed break. Until the 4th close beyond the edge, the break could still fail that way, so the panel calls it "Break above" or "Break below" and counts the closes. On the 4th, if it has not come back to the edge, it becomes the Classic ORB.

What does "A one-range move reaches" mean?

It is the range's own height added beyond the broken edge. If the range is 84.7 points tall and price broke above 29609.3, one range height above is 29694.0. Traders have measured the open this way for decades. It is a distance on the chart, not a forecast, and price may never get there.

Why no win rate, odds or backtest?

Because a number like that would come from other markets and other days, not from the chart in front of you, and it would read as a promise. The panel only shows prices and counts of candles from your own chart. Whether to act on a play stays your decision.

Does it work on stocks, including Indian and European stocks?

Yes. With "Stocks: use the exchange's own open" on (the default), a stock or fund gets one range from the exchange's own first candle of the day, read on the exchange's clock. US stocks use the 09:30 New York open; a stock on the NSE, Xetra or Hong Kong gets its own open range.

Which chart timeframe should I use?

One that divides the range length evenly and is no longer than it. For a 15 minute range, a 1, 3, 5 or 15 minute chart. If the chart does not fit, nothing is drawn and the panel names the charts that do. On daily charts and above it draws nothing.

Does it tell me when to act?

No. It names the play that is on the chart and the level that play measures, with the close that would change the read. It never says to act on it, and it cannot see what comes next. Decisions stay with you.

The chart looks busy. What can I do?

It starts clean: three sessions, three ranges each, extra levels off. If you switched levels on, keep "Nearest levels only" on, lower "Ranges kept per session", or turn off the sessions you do not trade. "Panel detail" on Phone keeps the panel to four lines.

Get our weekly market brief free.