Updated 06:01 GMT, 1 Nov 2026 SPX 7,580.07 -1.82% NDX 28,384.85 -3.46% VIX 19.42 +12.91% GOLD 3,898.90 -3.29% CL 104.12 +2.08% BTC 77,765.00 +0.73%
Members From 17 Nov TradingView indicator

[TP] Event Guard - Mentor

The scheduled releases that move markets, marked on your chart and read in plain words: how careful to be right now, when the release is due in UTC, why it matters for your candles, and when the read eases again.

Fed decisions, the jobs report and inflation data can turn a calm chart into a wide one in a minute. The times are public, but they are easy to forget in the middle of a session. This one shades the candle that holds each release, tags it with its name and time, and keeps a short card in the corner that says Heavy, Careful, Thin or Clear, with the reason and the time the read changes.

Full version for members on TradingView from 17 Nov. Free Lite version later.

How to read it

The full version is for members from 17 Nov. Free Lite version later. Leave your email and we will tell you the day it is out.

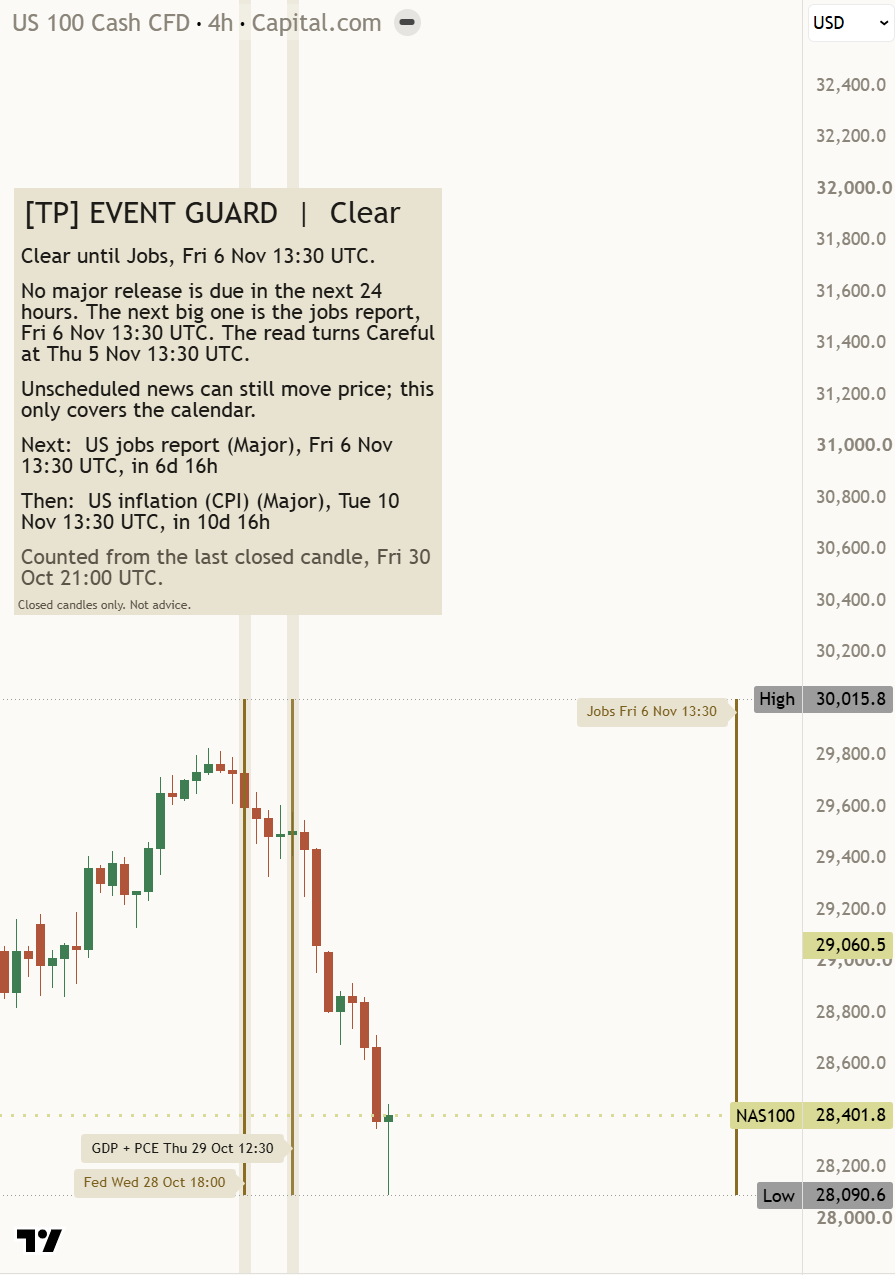
Event Guard card on a Nasdaq 100 four-hour chart: Clear until the jobs report, Fri 6 Nov 13:30 UTC, next the inflation report Tue 10 Nov, with past Fed and GDP releases shaded and the jobs report marked ahead.
Nasdaq 100 (NAS100) four hours, captured on 1 Nov 2026 on the private build, with display settings changed from the defaults (panel moved off the candles). A real chart, an example only, not a recommendation.

What it is in 30 seconds

It is a calendar that lives on your chart. It marks the scheduled releases that tend to widen candles and tells you, in plain words, how careful to be right now. It does not say which way price will go.

What is due

The release, its weight (Major, Moderate or Minor), the time in UTC and how long to go, counted from the last closed candle.

Why it matters

Every read says what the release can do to your candles: widen into the number, run wide both ways after it, or go thin on a holiday.

When it eases

Every read ends with the time it changes, such as "The read eases to Clear at 19:00.", so you know how long the care lasts.

Four reads, set by the calendar

The header is always a read. It comes from the release times and two windows you can change, never from price.

  1. HeavyA Major release (a Fed rate decision, the US jobs report or US inflation, CPI) is due within 4 hours, or came out in the last hour.
  2. CarefulA Major release is due within 24 hours, or a Moderate one (such as US growth, GDP, or spending and PCE prices) is due within 4 hours or came out in the last hour.
  3. ThinToday is a US market holiday or an early close. With fewer trades, candles can be thin and one order can move price more than usual.
Clear

Nothing inside the windows. The card still names the next big release and the time the read turns Careful.

Closed candles only

Every time on the card is counted from the last closed candle on your chart, so nothing changes while a candle is still forming.

The calendar, not the news

It covers scheduled releases, US market holidays and options and VIX expiries. Unscheduled news can still move price, and the Clear card says so.

Each part, up close

Every quote below is the card's own text on the private build that will be released, captured on NAS100 on 30 Oct 2026. Chart, timeframe and the candle clock are named with each one.

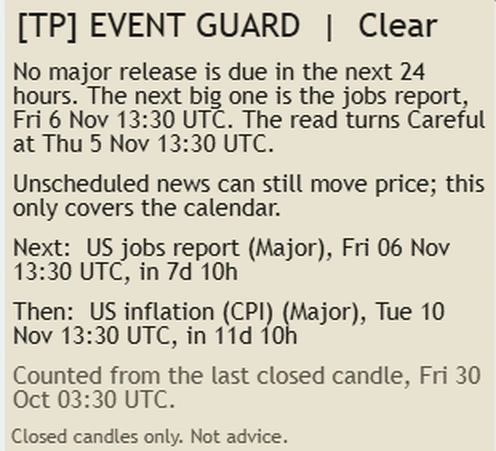
The [TP] Event Guard card reading Clear on a light NAS100 390 minute chart. No major release is due in the next 24 hours. The next big one is the jobs report, Fri 6 Nov 13:30 UTC. The read turns Careful at Thu 5 Nov 13:30 UTC. Unscheduled news can still move price; this only covers the calendar. Next: US jobs report (Major), Fri 06 Nov 13:30 UTC, in 7d 10h. Then: US inflation (CPI) (Major), Tue 10 Nov 13:30 UTC, in 11d 10h. Counted from the last closed candle, Fri 30 Oct 03:30 UTC.

The read

One word after the name: Heavy, Careful, Thin or Clear. Heavy and Careful are drawn in gold so they stand out; Clear and Thin in the card's plain text colour.

On NAS100 above (390 minutes, last closed candle Fri 30 Oct 03:30 UTC) the read was Clear: "No major release is due in the next 24 hours. The next big one is the jobs report, Fri 6 Nov 13:30 UTC. The read turns Careful at Thu 5 Nov 13:30 UTC."

Back to the guide
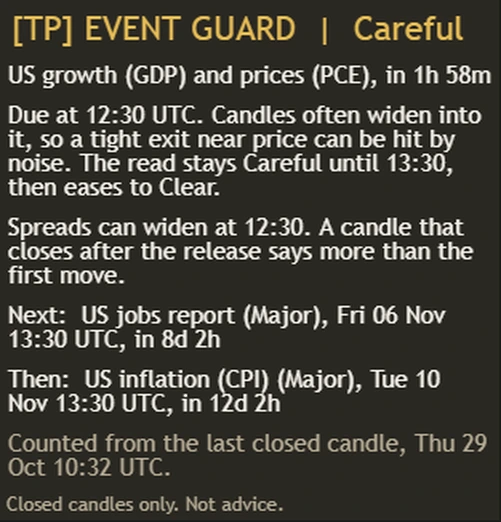
The [TP] Event Guard card reading Careful on a dark NAS100 14 minute chart, before a release. US growth (GDP) and prices (PCE), in 1h 58m. Due at 12:30 UTC. Candles often widen into it, so a tight exit near price can be hit by noise. The read stays Careful until 13:30, then eases to Clear. Spreads can widen at 12:30. A candle that closes after the release says more than the first move. Next: US jobs report (Major), Fri 06 Nov 13:30 UTC, in 8d 2h. Then: US inflation (CPI) (Major), Tue 10 Nov 13:30 UTC, in 12d 2h. Counted from the last closed candle, Thu 29 Oct 10:32 UTC.

The event row

The first row names the release the read is about, in plain words, and the time to go or the time since. Releases at the same time are named together.

On NAS100, 14 minutes, in Bar Replay with the last closed candle at Thu 29 Oct 10:32 UTC: "US growth (GDP) and prices (PCE), in 1h 58m". The time to go is said once, here, and not repeated below.

Back to the guide

The why row

Three things in one short paragraph: when it is due, why it matters for your candles, and when the read changes. The times are worked out from the read's own windows, never typed in.

The same card, before the release: "Due at 12:30 UTC. Candles often widen into it, so a tight exit near price can be hit by noise. The read stays Careful until 13:30, then eases to Clear."

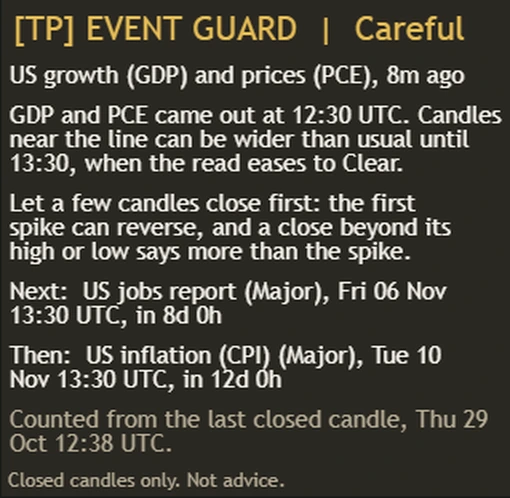
After a release the row turns to what came out: "GDP and PCE came out at 12:30 UTC. Candles near the line can be wider than usual until 13:30, when the read eases to Clear."

Back to the guide
The [TP] Event Guard card reading Careful on a dark NAS100 14 minute chart, 8 minutes after a release. US growth (GDP) and prices (PCE), 8m ago. GDP and PCE came out at 12:30 UTC. Candles near the line can be wider than usual until 13:30, when the read eases to Clear. Let a few candles close first: the first spike can reverse, and a close beyond its high or low says more than the spike. Next: US jobs report (Major), Fri 06 Nov 13:30 UTC, in 8d 0h. Then: US inflation (CPI) (Major), Tue 10 Nov 13:30 UTC, in 12d 0h. Counted from the last closed candle, Thu 29 Oct 12:38 UTC.

The be-aware row

One habit for the moment you are in. Before a release: "Spreads can widen at 12:30. A candle that closes after the release says more than the first move."

After it, as on this card from 12:38 UTC: "Let a few candles close first: the first spike can reverse, and a close beyond its high or low says more than the spike."

On a Clear day it is the honest limit: "Unscheduled news can still move price; this only covers the calendar."

Back to the guide

Next and Then

The next two releases after the one the read is about, each with its weight, date, UTC time and time to go. Releases at the same time share one row.

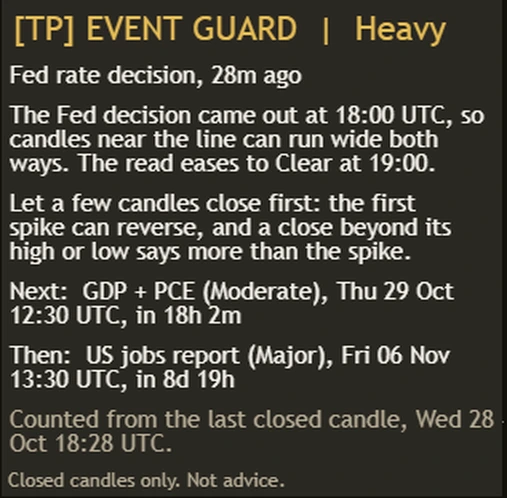
From the Heavy card on 28 Oct: "Next: GDP + PCE (Moderate), Thu 29 Oct 12:30 UTC, in 18h 2m" and "Then: US jobs report (Major), Fri 06 Nov 13:30 UTC, in 8d 19h".

Back to the guide
The [TP] Event Guard card reading Heavy on a dark NAS100 14 minute chart. Fed rate decision, 28m ago. The Fed decision came out at 18:00 UTC, so candles near the line can run wide both ways. The read eases to Clear at 19:00. Let a few candles close first: the first spike can reverse, and a close beyond its high or low says more than the spike. Next: GDP + PCE (Moderate), Thu 29 Oct 12:30 UTC, in 18h 2m. Then: US jobs report (Major), Fri 06 Nov 13:30 UTC, in 8d 19h. Counted from the last closed candle, Wed 28 Oct 18:28 UTC.

The clock line

Every "in" and "ago" on the card is counted from the close of the last closed candle, and the card says which one: "Counted from the last closed candle, Wed 28 Oct 18:28 UTC." On a 390 minute chart that clock moves once a candle; on a 14 minute chart, every 14 minutes.

The last line is always "Closed candles only. Not advice."

Back to the guide

Event lines and shading

A solid gold line sits on the open of the candle that holds each Major or Moderate release, and that candle gets a light gold shade once it has closed. Major lines are the brighter gold. Minor events, holidays and early closes get a muted dotted or dashed line and no shade.

Past events are drawn 10 days back and upcoming ones 7 days ahead, as far as the chart has room. A release in a closed-market gap goes on the first candle after it.

Back to the guide

Event tags

Each line carries a short tag with the release and its UTC time, such as "Fed 28 Oct 18:00" or, when two come out together, "GDP + PCE 29 Oct 12:30". Hover a tag for the full name, the time and its weight.

Tags sit in the clearer band above or below the candles, stack when releases are close, and are moved just past the last-price line so they never sit on it.

Back to the guide

Two card views

Compact (default)

The read, the event row, the why and be-aware rows, Next and Then, the clock line and the footer.

Full

Everything in Compact, plus a line that says when the date table was checked and how far its release dates run.

What it covers, and how much weight each one gets

Each event carries a weight. The weight decides whether it can make the read Heavy or Careful, and whether its candle is shaded.

Major

Fed rate decisions, the US jobs report and US inflation (CPI). Tags: Fed, Jobs, CPI. Heavy within 4 hours ahead or the hour after; Careful within 24 hours.

Moderate

US growth (GDP), spending and PCE prices, retail sales, producer prices, job openings and the quarterly options expiry. Careful within 4 hours ahead or the hour after.

Minor (off by default)

Weekly jobless claims, factory surveys, industrial output, housing, durable goods, the monthly options expiry and VIX expiry. Drawn when you turn them on; they never change the read.

Holidays and early closes

US market holidays and early closes make the read Thin on the day. Other markets keep their own calendars, so check yours if you trade outside US hours.

One release, before and after

The same chart, NAS100 on 14 minutes, stepped through in Bar Replay on 29 Oct 2026, the morning US growth (GDP) and PCE prices came out together at 12:30 UTC.

[TP] EVENT GUARD | Careful US growth (GDP) and prices (PCE), in 1h 58m Due at 12:30 UTC. Candles often widen into it, so a tight exit near price can be hit by noise. The read stays Careful until 13:30, then eases to Clear. Spreads can widen at 12:30. A candle that closes after the release says more than the first move. Counted from the last closed candle, Thu 29 Oct 10:32 UTC.
Two hours before: the due time, why candles may widen, and how long the care lasts.
[TP] EVENT GUARD | Careful US growth (GDP) and prices (PCE), 8m ago GDP and PCE came out at 12:30 UTC. Candles near the line can be wider than usual until 13:30, when the read eases to Clear. Let a few candles close first: the first spike can reverse, and a close beyond its high or low says more than the spike. Counted from the last closed candle, Thu 29 Oct 12:38 UTC.
Eight minutes after: what came out, how long candles may stay wide, and one habit for the first minutes.
Due, why, when it eases

No read without a time, a reason and the moment it changes. That rule runs through every card it can give.

Words, not scores

There are no odds, no scores and no win rates on the card. It does not guess how the number will land or which way price goes.

Times in UTC

Every time is in UTC, with daylight saving already handled, so a 13:30 UTC release reads the same wherever you are.

How it helps you at every level

Same indicator, same card. What you take from it grows with you. The quoted lines are the card's own words.

  1. Level 1

    Beginner

    What gets in the way

    • Not knowing a big release is due today.
    • Being surprised when a calm chart turns wide in a minute.
    • Mixing up release times across time zones.

    The habit it builds: glance at the header before you look at anything else.

    What it says

    Event row (NAS100, 29 Oct 10:32 UTC)"US growth (GDP) and prices (PCE), in 1h 58m"

    Why row"Due at 12:30 UTC."

  2. Level 2

    Intermediate

    What gets in the way

    • Leaving a tight exit right next to price into a release.
    • Reading the first spike after a number as the move.
    • Treating every release as equally heavy.

    The habit it builds: give the first candles after a release room, and know which releases carry the most weight.

    What it says

    Why row, before (NAS100, 14 min)"Candles often widen into it, so a tight exit near price can be hit by noise."

    Be-aware row, after"Let a few candles close first: the first spike can reverse, and a close beyond its high or low says more than the spike."

  3. Level 3

    Advanced

    What gets in the way

    • Planning a position that runs straight through a jobs report.
    • Forgetting the release two days out while you watch today's.
    • Not knowing when the care is over.

    The habit it builds: know the next two releases and when each read eases before you plan the week.

    What it says

    Next (NAS100, 28 Oct 18:28 UTC)"Next: GDP + PCE (Moderate), Thu 29 Oct 12:30 UTC, in 18h 2m"

    Heavy, after the Fed"The read eases to Clear at 19:00."

  4. Level 4

    Expert

    What gets in the way

    • Trusting a calendar more than it deserves.
    • Forgetting that unscheduled news is not on it.
    • Not checking how far the dates run.

    The habit it builds: a steady second pair of eyes on the calendar that states its own limits.

    What it says

    Clear (NAS100, 390 min)"Unscheduled news can still move price; this only covers the calendar."

    Clock line"Counted from the last closed candle, Fri 30 Oct 03:30 UTC."

Three things to remember

  1. A release can widen candles both ways. The card says when, not which way.
  2. Every read has a time it eases. Look at it first. It tells you how long the care lasts.
  3. It covers the calendar, not the news. Unscheduled headlines can move price on a Clear day.

Honest about the data, honest about limits

Where the dates come from

The release dates come from our economic calendar data and are written into the script as one date table, with every time already in UTC. Holidays, early closes and options and VIX expiries are worked out from fixed rules. Pine cannot read a file, so the table travels with the script.

How far the dates run

The first release lists dates up to 9 Dec 2026, from a table checked on 29 Oct 2026; holidays and expiries run to 30 Jun 2027. The Full card says so, and when your chart passes the last listed release the card says it in words on every view.

What it is not

It is not a news feed. Unscheduled headlines, speeches and surprises are not on it. It does not know how a number will land, and it does not say which way price will go after it.

What it does not do

No arrows, no odds, no countdown colours and no claims about results. The weights (Major, Moderate, Minor) are our call, written in one table, and the page lists every event in each group.

Settings

The defaults work out of the box. These are the ones worth knowing.

On a small screen, swipe the table sideways to see every column.
SettingWhat it doesDefault
Major / Moderate / Minor eventsWhich weights are drawn. Minor events are off by default to keep the chart calm.On; On; Off
Options and VIX expiries / Market holidays and early closesMonthly and quarterly options expiry, VIX expiry, and US holidays and early closes.On; On
Show event lines / labels / Shade the event candleThe gold line, the tag and the light shade on the candle that holds a release.On; On; On
Days back / Days aheadHow far back past events are drawn, and how far ahead upcoming ones are drawn.10; 7
Heavy window / Careful window (hours)How close a release has to be before the read turns Heavy or Careful.4; 24
Show Mentor / Panel detail / Panel text size / Panel positionCompact or Full card. Auto sits Bottom Left and moves Top Left when price sits low on the chart. Use Tiny on phones.
CompactFull
AutoTop LeftBottom Left
On; Compact; Small; Auto
Panel offset / Panel background / Theme / Line width in charactersLift the card off the corner by rows; Solid, Tint or See-through; Auto follows the chart background (Paper on a light chart, Ink on a dark one); rows wrap at 44 characters so the card stays phone safe.0; Solid; Auto; 44
Suite Read card on chartIf you run the Titan Suite, turn this on so the card and tags stay clear of the Suite Read card.
OnOff
Off

Every setting has a small (i) next to it. Hover over it, or tap it on a phone, and it explains that setting in plain English, right there on your chart. If candles draw over the card or the tags, right-click the indicator, then Visual order, then Bring to front.

Learn more

Start with the lesson, then the deeper Foundry lessons it builds on.

Watch it explained

Coming soon Video, about 2 minutes

How to read [TP] Event Guard - Mentor

Every part of the indicator on a real chart: the four reads, the event row, the why row, Next and Then, the lines, shading and tags.

Coming soon Video, about 2 minutes

Trading around scheduled news, explained plainly

Why a scheduled release can widen candles both ways, why the first spike is often not the move, and what a calendar cannot tell you. Concept first, then the indicator.

The Titan suite

The calendar here, the rest of the picture there

Event Guard reads one thing: what the calendar holds. The suite reads momentum, volume, trend structure and flow, in the same plain-English voice.

See the full suite
Get it

Members from 17 Nov

Full version for members on TradingView from 17 November 2026. Free Lite version later. Leave your email at the top of this page and we will tell you the day it is ready.

Members from 17 Nov: get notified

One concept, read well

Event Guard reads one thing: what the economic calendar holds. The free Mentor indicators, [TP] RSI - Mentor, [TP] Volume - Mentor, [TP] Market Structure - Mentor, [TP] Trend - Mentor, [TP] VWAP - Mentor, [TP] Fibonacci - Mentor, [TP] MACD - Mentor, [TP] Bollinger Bands - Mentor, [TP] Regime - Mentor, [TP] Market Board - Mentor, [TP] Order Blocks - Mentor, [TP] Support and Resistance - Mentor, [TP] Volume Profile - Mentor and [TP] Elliott Wave - Mentor, each read one other thing deeply, for free. Markets rarely move on one thing. The full Titan suite reads them together: momentum, volume, trend structure and flow, combined into one plain-English read.

Questions

Is it free?

Not the full version. [TP] Event Guard - Mentor is for members on TradingView from 17 November 2026, as part of membership. A free Lite version follows later. Leave your email at the top of this page and we will tell you the day it is out.

Which time zone are the times in?

UTC, everywhere on the card and the tags. Daylight saving is already handled when the table is built, so a release does not drift by an hour in summer.

Does it repaint?

No. Every time on the card is counted from the last closed candle, and the shade is drawn only once the event candle has closed. Nothing changes while a candle is forming.

Which markets does it work on?

Any chart. The releases are US ones (the Fed, US jobs, US inflation and the rest), which move most markets, and the holidays are US market holidays. If you trade a market with its own holidays, check its calendar too.

I run the Titan Suite. Anything to change?

Yes, one setting. Turn on "Suite Read card on chart" so the card and tags stay clear of the Suite Read card. It is off by default because most people run Event Guard on its own.

What happens when the dates run out?

The card tells you. The Full card always shows when the date table was checked and how far its release dates run. Once your chart passes the last listed release, every view says so in words, and only holidays and expiries are drawn after that.

Does it tell me when to act?

No. It tells you what the calendar holds, why it can matter for your candles and when its read eases. It cannot see how a number will land or where price goes next. Decisions stay with you.

Get our weekly market brief free.