The cup and handle: checked rule by rule
Look at any chart and say, in plain words, whether it holds a cup and handle that passes the textbook rules, which rule a near miss failed, and where its breakout level sits.
By the end of this lesson you will be able to look at any chart and say, in plain words, whether it holds a cup and handle that passes the textbook rules, which rule a near miss failed, and where its breakout level sits. You will also be able to read the breakout, the failed break and the measured move as facts and distances, not promises, and say why most charts have no cup at all.
1. What a cup and handle is
Foundry lesson. Free, no gate. Page: /foundry/cup-and-handle/. Educational interpretation only. Not financial advice.
How to use this lesson at your level
- Beginner: sections 1 to 4 and the traps in section 14. Get the habit of checking a cup against its rules before calling it one.
- Intermediate: add sections 5 to 8. The handle, volume, the breakout and the failed break.
- Advanced: sections 9 to 12. The measured move, the inverse, timing, and a working view with the price where it is wrong.
- Expert: section 13, plus the honest limit in every section. The skill is knowing how rare the real thing is.
See the matching indicator: [TP] Cup and Handle - Mentor draws the cup, handle and breakout level and names the rule a near miss failed.
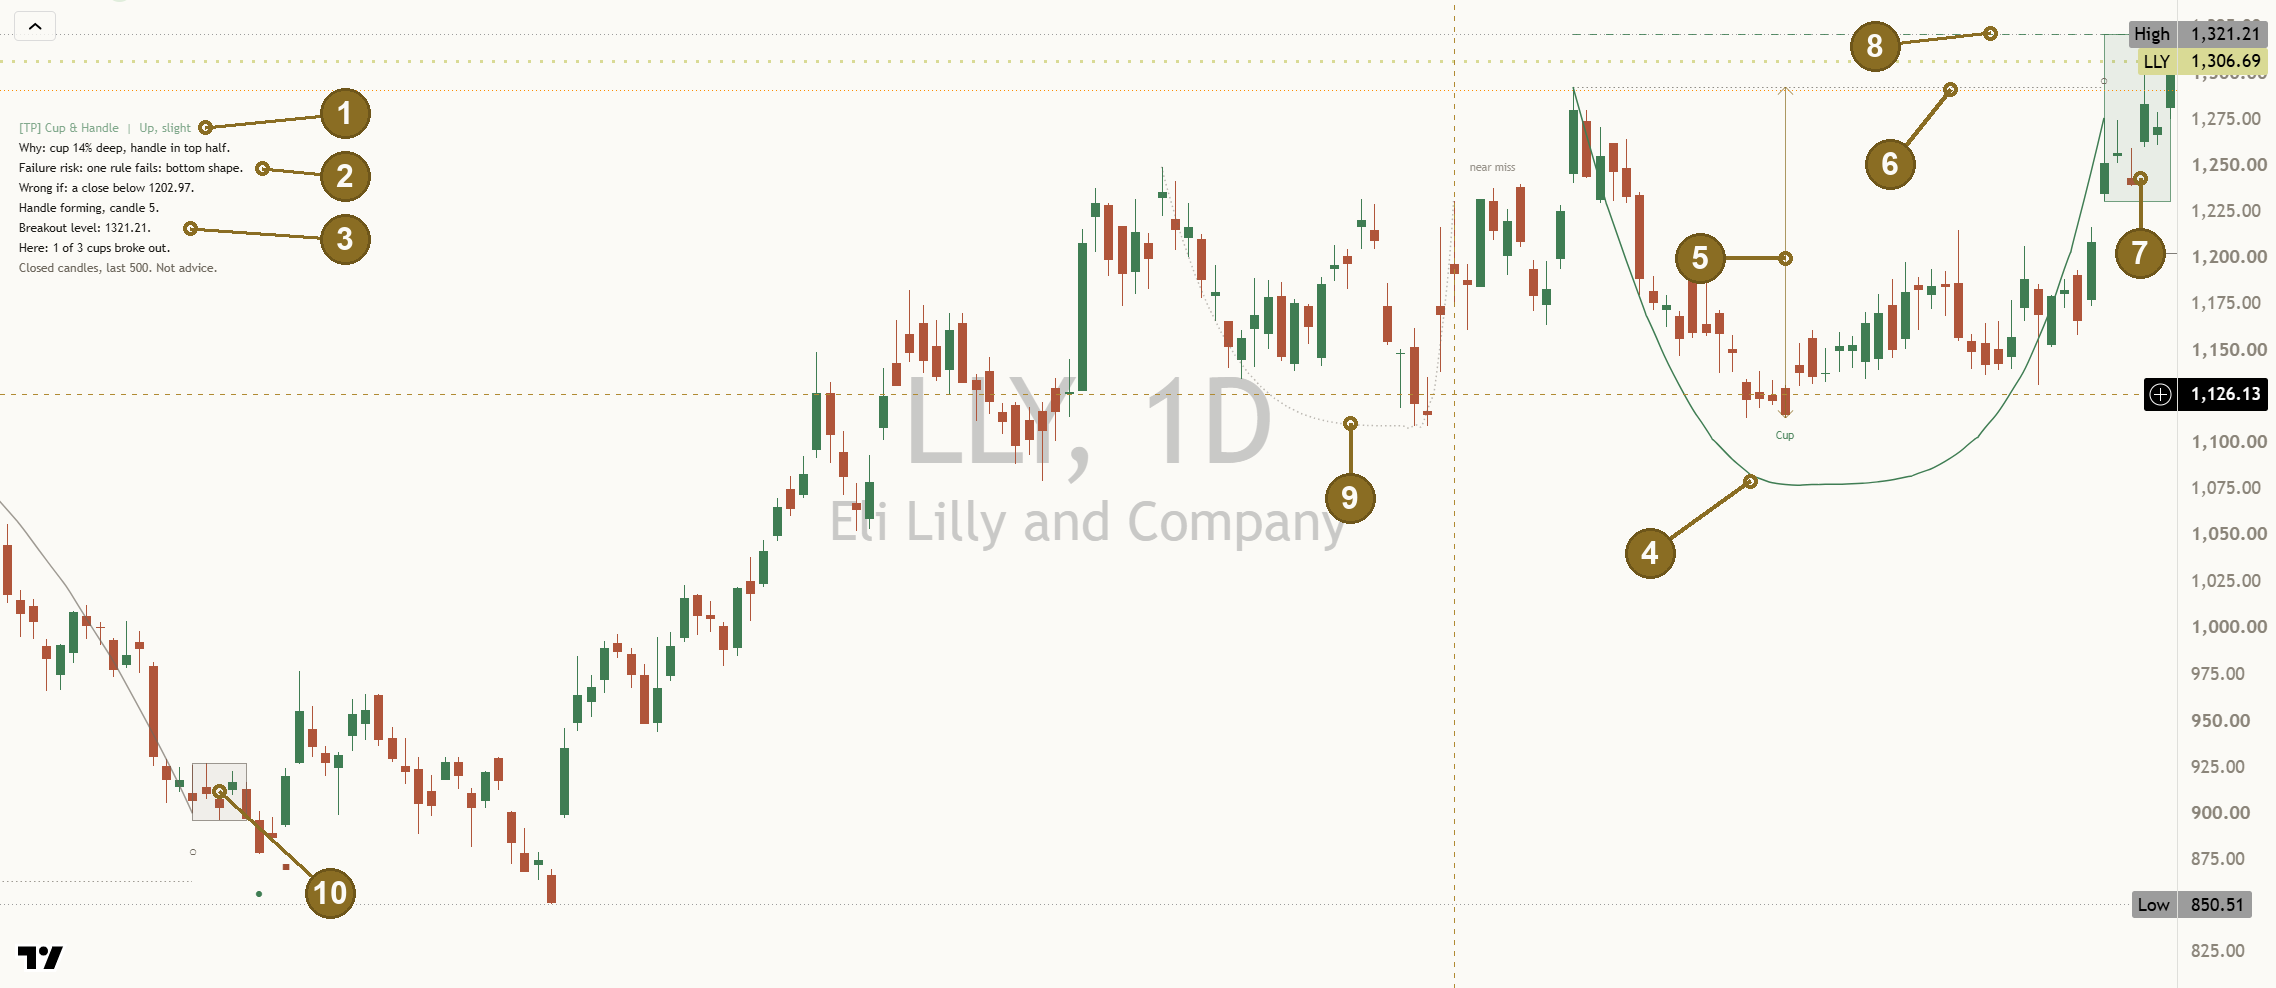
A cup and handle is a chart shape that forms over weeks or months. Price rises, then falls back in a rounded dip (the cup), climbs back to near where the dip began (the rim), pauses with a small drift lower (the handle), and then may push above the handle's high.
William O'Neil made it famous in the 1980s as one of the bases he saw before many large rises in stocks. His rules give the pattern a shape you can check. A picture you imagine is something else.
Honest limit: a pattern is a shape the past made. It does not tell price what to do next.
2. The rules, as commonly summarised
The textbook cup is usually summarised like this:
- A prior advance into the left rim, around 30 percent or more.
- A cup 12 to 33 percent deep, measured from the left rim to the low.
- 7 to 65 weeks long.
- A rounded bottom, a U and not a V: price spends some time near the low.
- A right rim that comes back close to the left rim.
These numbers come from summaries of O'Neil's work, and different books round them differently. Treat each one as a setting you can see and change, not a law.
Honest limit: a rule is a choice. Loosen it and more cups appear.
3. A U, not a V
The rounded bottom is the rule people skip most. A sharp V, straight down and straight back up, has the same depth as a cup but none of the slow, quiet base that the pattern is meant to show. A simple test: what share of the cup's closes sit in its lower third? A V has very few.
Honest limit: a cup that fails the shape rule can still be followed by a rise. The rule describes the textbook pattern, not the only way price goes up.
4. Most charts have no cup
A strict cup is rare. On most charts, most of the time, nothing passes all the rules. A tool that finds a cup everywhere is not following the rules. An honest one says "no base" most days, and shows the closest candidate with the rule it failed.
Honest limit: rare means the counts on any one chart will be small, so read them with care.
5. The handle
After the right rim, the textbook wants a short pause that drifts a little lower: about 1 to 5 weeks long, 3 to 15 percent deep from its high, and staying in the upper half of the cup. A handle that sinks into the lower half has given back too much.
The handle's high becomes the breakout level. The handle's floor is the price where the pattern would be broken.
Honest limit: the handle is a pause, not a promise.
6. Volume
O'Neil's version cares about volume: quiet volume in the bottom of the cup and in the handle, as the pressure to get out fades, and a clear rise in volume on the breakout candle. Half of the textbook pattern is in the volume, and most tools ignore it.
Some symbols have no real volume (forex, or feeds that only count ticks). There the volume rule cannot be tested, and a fair tool says so and holds back its confidence.
Honest limit: a volume rule is only as good as the volume data.
7. The breakout, judged on a close
A wick above the handle's high happens all the time. A breakout is a finished candle that closes above it. Waiting for the close costs a little speed and saves a lot of false starts.
Honest limit: a break is an event, not a forecast.
8. The failed break, and why it must stay on the chart
Some breakouts reverse almost at once: price closes back under the breakout level within a few candles. Others never get going and the handle sinks through its floor. These are the patterns that other tools quietly drop from their pictures, so the history looks cleaner than it was.
A failed break is a fact. It belongs on the chart and in the count.
Honest limit: a failed cup in one direction does not mean the other direction now wins.
9. The measured move: one cup depth
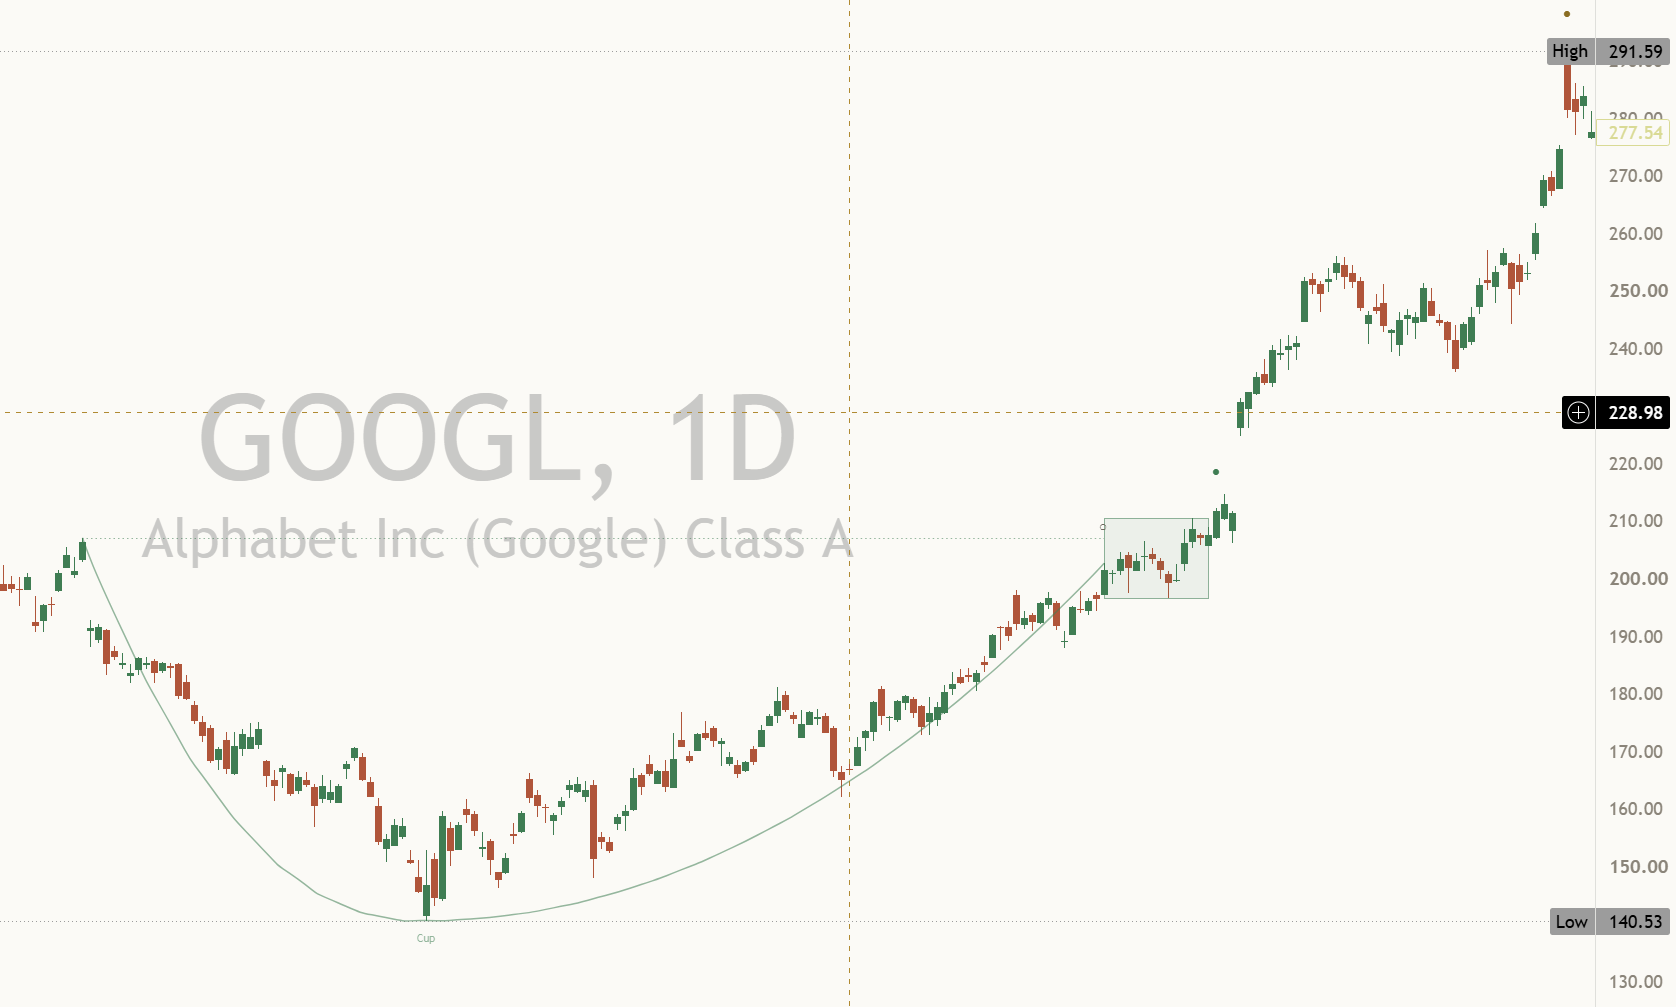
Many traders add the cup's depth to the breakout level to get a measured move. If the cup was 40 points deep and the breakout level is 200, one cup depth up is 240.
Honest limit: a measured move is a distance, not a goal. Sometimes price travels that far, sometimes it does not.
10. The inverse: a dome with a handle
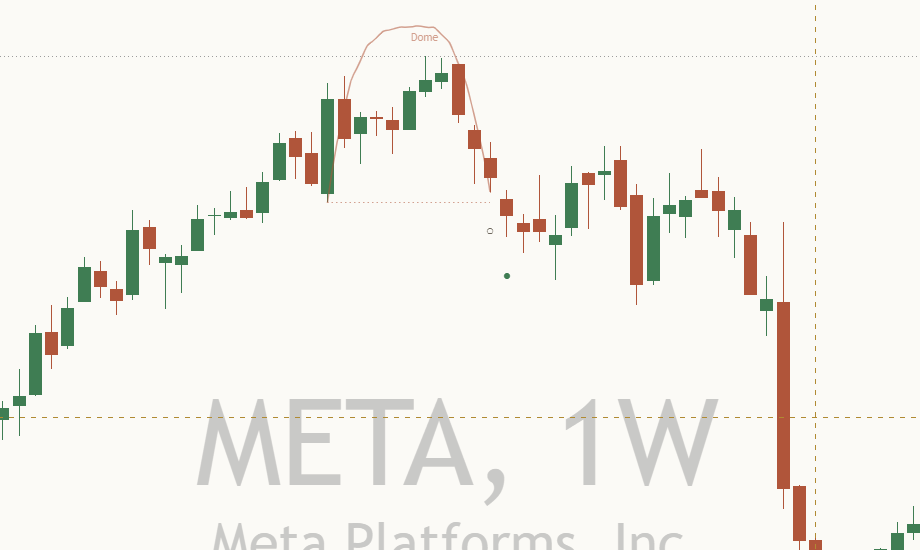
Turn the pattern upside down and you get the inverse: a rounded dome over the highs, a small handle that drifts up, and a breakdown level under the handle's low. The same rules apply in mirror, and one dome depth down is its measured move.
Honest limit: the inverse is rarer still, and it carries the same limits as the cup.
11. Timing: when could you have known?
You cannot know a dip is the cup's low while it is happening. It only becomes the low once price has climbed well away from it. So a cup can only be named some time after its bottom, and a handle only after the right rim is in.
Many pattern pictures hide this. They draw the cup from its low as if it was known that day. When you check any pattern tool, ask one question: from which candle could this pattern actually have been seen?
Honest limit: every pattern comes late. Drawing it early on a past chart makes a tool look better than it could have been live.
12. A working view: up, down or sideways, and where it is wrong
Experienced traders always hold a working view, even when it is weak. A cup gives you one when a handle is forming that passed the rules: the read is up while the handle holds, and wrong on a close through the handle floor. After a breakout, the read stays up and is wrong on a close back under the breakout level. With no handle live, the cup is only context, and the view comes from the price trend.
A good working view always comes with three more things:
- Why: the one fact it rests on, for example "cup 14% deep, handle in top half".
- The main risk: what would most likely spoil it, for example the one rule that failed.
- Wrong if: the price where the view is plainly wrong.
How strong a view is should mean how many of the pattern's own rules agree. It is not odds. And a view should not flip on every candle: wait for two closes before calling a change.
Honest limit: a read says where price is against the pattern, not where it goes next.
13. Honest limits, all in one place
- Rules: commonly summarised textbook numbers, each a setting.
- Rarity: most charts have no cup; small counts.
- Timing: a cup is only known after its low.
- Closes decide: a wick above the handle decides nothing.
- Failures count: a chart with only the cups that worked is a cleaned-up chart.
- Volume: only as good as the data.
- Measured moves: a distance, not a goal.
- Counts: history from this chart, not a promise.
14. Six common traps
- Seeing a cup in every dip. Check depth, length, shape and the prior advance first.
- Calling a V a cup. Look for time spent near the low.
- Calling a wick a breakout. Only a finished candle's close decides.
- Ignoring a deep handle. A handle in the lower half of the cup has given back too much.
- Treating one cup depth as a promise. It is a distance.
- Holding a view with no price where it is wrong. Write the Wrong if level down with the view.
15. Practise it
- Pick a few stocks on daily and weekly charts and keep them for a few months.
- When you think you see a cup, measure its depth and length, and count the closes in its lower third.
- Write down the rule it would fail, if any, before you look at the panel.
- When a handle forms, note its high (the breakout level) and its floor.
- Keep a one-line log per pattern, including the ones that failed.
- After a handful of patterns, compare your log with the panel's count.
Key takeaways
What to remember
- A cup and handle is a rounded base with a short handle and a breakout level at the handle's high.
- The textbook rules (depth, length, a rounded bottom, a handle in the upper half, a prior advance, volume) are settings, not laws.
- Most charts have no cup; an honest tool says so and names the near miss.
- A cup is only known after its low. Judge it from the moment it was known.
- Breakouts and failed breaks are judged on finished candles, and failures stay on the chart.
- One cup depth is a measured distance, not a goal. The inverse mirrors every rule.
- A working view is up, down or sideways, with why, the main risk and the price where it is wrong.
- Counts from one chart are history, not promises.
16. See it on a chart: [TP] Cup and Handle - Mentor
Everything in this lesson is built into [TP] Cup and Handle - Mentor, a free indicator coming to TradingView on 20 November 2026. It draws the cup, the handle and the levels on your price chart and talks you through them in plain English, so you can practise on live markets instead of from memory.
Its first promise is the honest one. Every rule is a named setting, and when nothing passes, the closest candidate is drawn faint and dotted with the first rule it failed. Each pattern says when it became known, every mark sits on the candle that confirmed it, and failed patterns stay on the chart in grey. Step through it in TradingView's Bar Replay and you will see exactly what the chart showed at the time.
Here is where each part of the lesson shows up:
- The rules (sections 1 to 4). "Cup depth, at least" (12) and "at most" (33), "Cup length, weeks" (7 to 65), "Rounded bottom: closes in the lower third" (15), "Needs a prior advance" (30 over 26 weeks). Each tooltip says: "Textbook default (O'Neil, as commonly summarised). A setting, not a law."
- The cup. A smooth rounded arc from rim to rim, lowest at the cup low, under the candle bodies, with a thin depth arrow and a dotted rim line.
- The handle (section 5). A box while it forms, a ring on the candle where it began. "Handle length, weeks" (1 to 5), "Handle depth" (3 to 15), "Handle in the upper half" (on). "The handle is a pause, not a promise."
- Volume (section 6). "Volume tests" checks the dry-up in the cup bottom and the handle. With no volume on the symbol it says "No volume on this symbol." and caps strength at moderate.
- Breakouts and failed breaks (sections 7 and 8). The breakout level is dashed. A filled circle marks a close above it, a square a failed break back below within 3 candles, a diamond outline a retest.
- One cup depth (section 9). A thin gold dotted line at one cup depth above the breakout level, with its price: "A pattern measure, not a forecast."
- The inverse (section 10). "Pattern" set to Both (default), Cup and handle, or Inverse. The dome, the breakdown level and one dome depth down are the mirror.
- Timing (section 11). Every pattern's tooltip says "Known from" a date. Below one hour nothing is drawn unless "Run below 1 hour" is on: "Why: cups are a weekly and daily pattern."
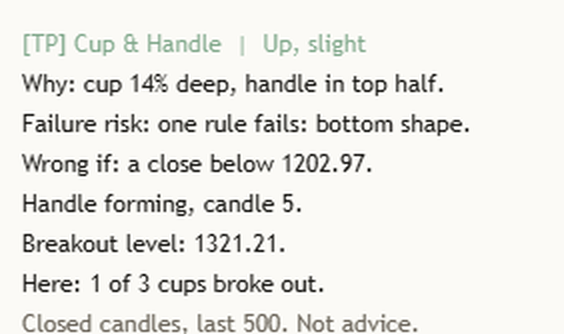
- The header (section 12). It always gives a read, never "no clear lean": Up, Down or Sideways, with slight, moderate or strong. On the Eli Lilly daily chart on 23 Oct 2026, with a handle forming, it read "[TP] Cup & Handle | Up, slight", "Why: cup 14% deep, handle in top half.", "Failure risk: one rule fails: bottom shape.", "Wrong if: a close below 1202.97.", "Handle forming, candle 5.", "Breakout level: 1321.21." and "Here: 1 of 3 cups broke out." The read changes only after 2 closes in a row. Strength counts how many of the pattern's own live rules agree. It is never odds.
- The count. "Here:" counts this chart's finished cups in the last 500 candles, failures included. With none it says "Here: none yet in 500 candles." Every number on the panel comes from the chart it sits on.
- The teaching line. In the Full panel, a line such as "A strict cup is rare; most charts have none." or "A break is an event, not a forecast." The footer: "Closed candles, last 500. Not advice." It never prints a percentage of success and never tells you what to do.
A good way to use it: before you look at the panel, decide whether you see a cup and which rule worries you. Then read the header, its Wrong if price and the risk line. Where you disagree is where you learn.
Quick answers
What is a cup and handle pattern?
A cup and handle is a chart shape that forms over weeks or months. Price rises, then falls back in a rounded dip (the cup), climbs back to near where the dip began (the rim), pauses with a small drift lower (the handle), and then may push above the handle's high. A pattern is a shape the past made. It does not tell price what to do next.
What are the textbook rules for a cup and handle?
The textbook cup is usually summarised as a prior advance of around 30 percent or more, a cup 12 to 33 percent deep and 7 to 65 weeks long, a rounded bottom (a U and not a V), and a right rim that comes back close to the left rim. These numbers come from summaries of O'Neil's work and different books round them differently, so treat each one as a setting, not a law.
What makes a good handle?
After the right rim, the textbook wants a short pause that drifts a little lower: about 1 to 5 weeks long, 3 to 15 percent deep from its high, and staying in the upper half of the cup. A handle that sinks into the lower half has given back too much. The handle's high becomes the breakout level.
What counts as a breakout from a cup and handle?
A wick above the handle's high happens all the time. A breakout is a finished candle that closes above it. Waiting for the close costs a little speed and saves a lot of false starts. A break is an event, not a forecast.
How do you measure the target of a cup and handle?
Many traders add the cup's depth to the breakout level to get a measured move. If the cup was 40 points deep and the breakout level is 200, one cup depth up is 240. A measured move is a distance, not a goal. Sometimes price travels that far, sometimes it does not.
Test yourself
Take the 15-question quiz below to check what stuck.
Question 1 of 15 · Beginner
In a cup and handle, what is the handle?
Question 2 of 15 · Beginner
How is cup depth usually measured?
Question 3 of 15 · Beginner
What is the difference between a U and a V bottom?
Question 4 of 15 · Beginner
An honest cup tool shows no cup on most charts most of the time. Why is that fair?
Question 5 of 15 · Intermediate
What does the textbook want from the handle?
Question 6 of 15 · Intermediate
A candle's wick pokes above the handle's high but it closes below it. What is that?
Question 7 of 15 · Intermediate
Price closes above the breakout level, then closes back below it two candles later. What is the honest way to record it?
Question 8 of 15 · Intermediate
What does the textbook version want from volume?
Question 9 of 15 · Intermediate
On a forex chart with no real volume, what should a fair cup tool do with the volume rule?
Question 10 of 15 · Advanced
A cup is 40 points deep and its breakout level is 200. What is one cup depth up, and what is it?
Question 11 of 15 · Advanced
What is the inverse cup and handle?
Question 12 of 15 · Advanced
Why can a cup only be named some time after its low?
Question 13 of 15 · Advanced
A tool shows a faint dotted cup labelled near miss, and says it failed the depth rule (need 12%). What is that useful for?
Question 14 of 15 · Expert
A handle is forming on a cup that passed its rules. Your working view is Up. Where is it plainly wrong?
Question 15 of 15 · Expert
You loosen the depth and shape rules until your favourite chart shows five cups. What has changed?
Educational interpretation only. Not financial advice. Every reading comes from candles that already closed, and the counts are history, not promises about what comes next.
Learn the idea here. Apply it with the desk.
Titan Protect turns lessons like this into a daily practice: daily market research, the full framework, and the tools that put it to work. This lesson is free; the desk is where it compounds.