Reading volume: activity, effort and where the business was done
Read volume in plain words: how many showed up, whether that is unusual for this time of day, and whether all that activity actually moved price.
By the end of this lesson you will be able to look at the volume under a chart and say, in plain words, how many showed up, whether that is unusual for this market at this time, and whether all that activity actually moved price.
1. What volume is
Foundry lesson. Free, no gate. Page: /foundry/volume/. Educational interpretation only. Not financial advice.
How to use this lesson at your level
- Beginner: sections 1 to 4 and the traps in section 11. Get the habit of asking "how many showed up, compared with usual?"
- Intermediate: add sections 5 and 10. Effort against result, and whether pushes draw more volume than pullbacks.
- Advanced: sections 6 to 9. Climaxes, confirmed swings, VWAP, the busiest price and OBV, with their lag and limits.
- Expert: read the "honest limits" in every section and the expert notes in section 10. The point is not more tools; it is knowing exactly what each one can't see.
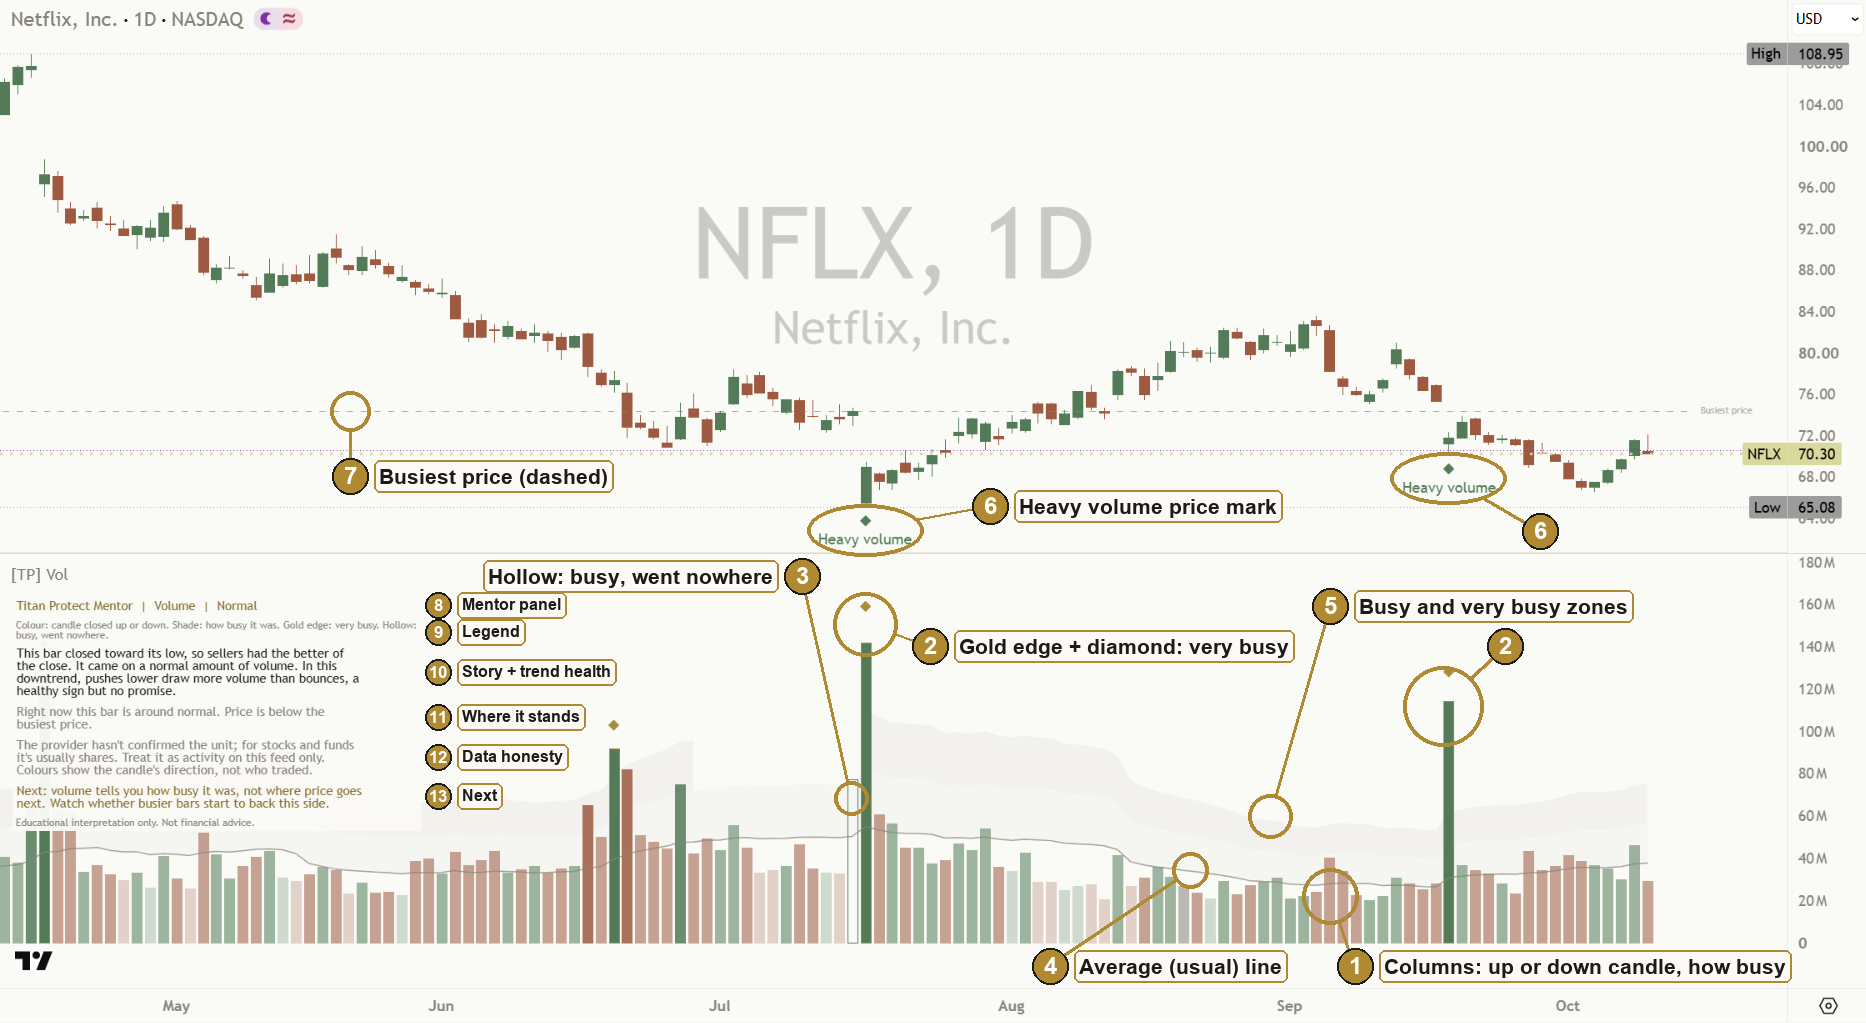
Volume counts how much changed hands during one bar. On a stock exchange that is shares. On a futures exchange it is contracts. Either way, it measures participation: how many people showed up behind a move.
Here is the whole idea in one sentence: price tells you where the market went; volume tells you how much activity it took to get there.
Two moves can look identical on the price chart and mean very different things underneath. One might have had the whole market behind it. The other might have drifted there while almost nobody was trading.
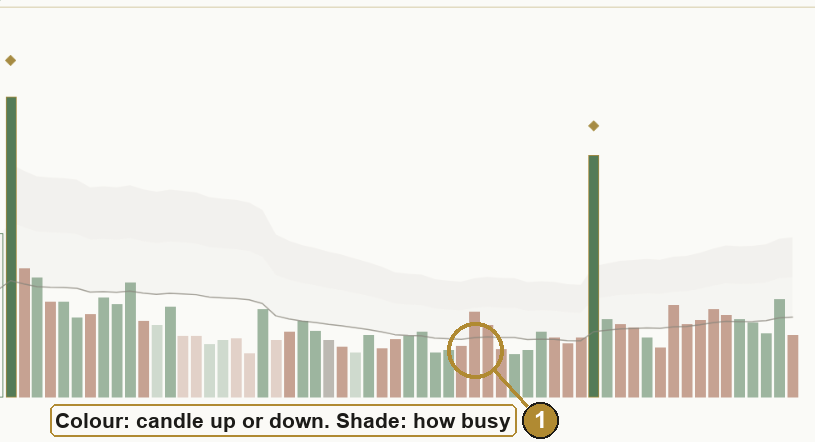
Most charts show volume as a row of columns under the price, one per bar, coloured by whether the candle closed up or down. That colouring is useful, but be careful with it. Every trade has a buyer and a seller. A green column does not mean "buyers did all the trading". It means the bar closed higher than it opened. Who actually started the trades is a different question that ordinary volume can't answer.
What this means for your chart: read the columns as the size of the crowd, and the colour as which way the candle closed. Not as a vote count, and not as a sign of who was in control.
2. Real volume and tick volume
On a stock or a future, one exchange (or a consolidated feed) sees every trade, so the volume is a real count of shares or contracts.
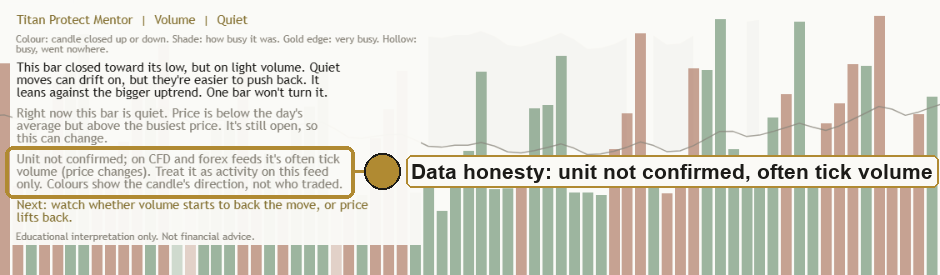
Spot forex and most CFDs are different. There is no single exchange, so your platform can't see every trade. What it shows instead is tick volume: a count of how many times the price changed during the bar. It measures activity, not shares.
That is not useless. Busy markets update their prices more often, so tick volume and real volume tend to rise and fall together. A busy tick bar usually is a busy bar. But three honest points:
- It is not a count of shares or contracts.
- It can differ from one broker or feed to the next, so only compare it with the same feed.
- Some charts, especially many index charts, carry no volume at all. On those, the honest answer is "there's nothing to read here", not a guess.
Crypto adds one more wrinkle: some feeds count volume in the coin itself, others in the currency it is priced in. Those are different units.
Ask the provider, not the market. The honest way to know the unit is to take it from what the data provider reports. Many providers don't say. When that happens, the fair thing is a hedged hint, not a claim: on stocks it is usually shares, on futures usually contracts, and on CFD and forex feeds it is often tick volume. "Usually" and "often" matter. And whatever the unit, only compare volume with the same feed: two brokers can show very different numbers for the same market.
Missing bars are gaps, not zeros. Now and then a feed skips a bar's volume. Drawing that as a zero-height column would be a small lie (it looks like nobody traded), and counting it as zero would make "usual" look smaller than it is. The honest picture leaves a gap and leaves that bar out of the average.
What this means for your chart: before reading a single column, know what the volume is counting, and where the provider doesn't say, treat it as activity on this feed only. On forex and CFD charts, read it as activity.
3. Relative activity: tall compared with what?
A column on its own tells you almost nothing. 50,000 shares is enormous for a small stock and a rounding error for a giant one. Even on the same chart, a tall column only means something next to the columns around it.
So the useful question is never "is this column big?" It is "is this column big for this market, right now?"
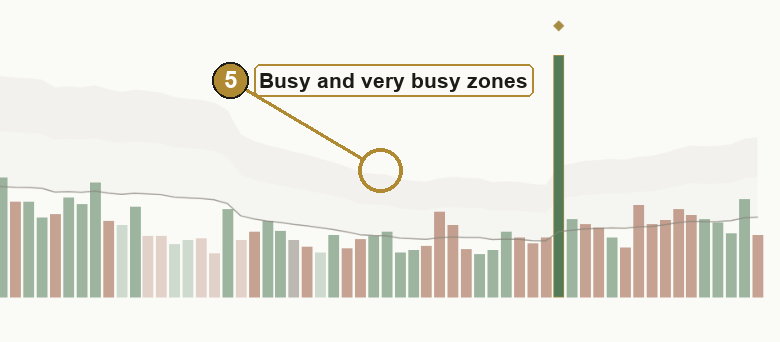
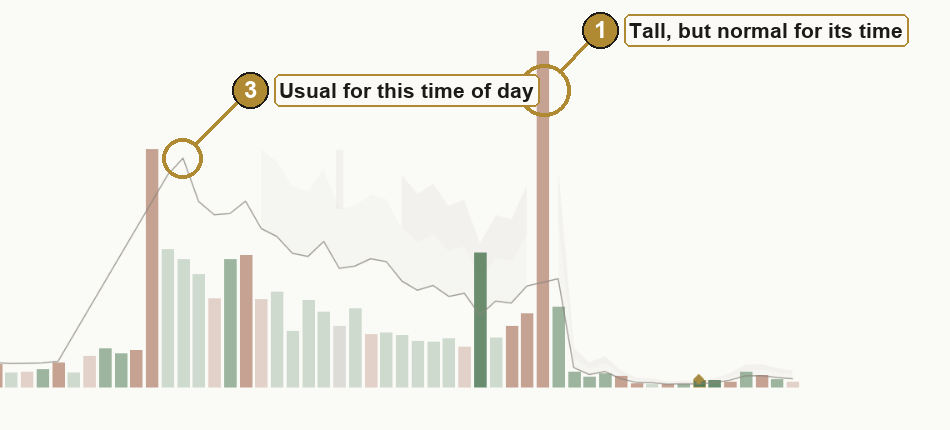
The simplest way to answer it is to compare each bar with an average of recent bars. That gives you relative activity (often called relative volume, or RVOL):
| Compared with usual | A fair description |
|---|---|
| well under (below about 0.7 times) | quiet |
| around 1 times | normal |
| 1.5 times or more | busy |
| 2 times or more | very busy |
These cut-offs are a sensible starting point, not laws of nature. What matters is the habit: always ask "compared with what?"
What this means for your chart: draw your eye to the columns that stand out from their neighbours, not simply the tallest ones on the screen.
4. Time of day: compare like with like
Markets have a daily rhythm. The open is usually busy as overnight news gets traded. The middle of the day is usually quiet. The close picks up again.
That rhythm causes a trap. If you compare every bar with one flat average, every open looks extreme and every lunchtime looks dead, even on a perfectly ordinary day. You end up paying attention to the wrong bars.
The fairer comparison is: how does this bar compare with the same time of day over the last few sessions? A busy 09:30 bar is judged against other 09:30 bars. A quiet lunchtime bar is judged against other lunchtimes. Now a busy open is just normal, and a busy lunchtime genuinely stands out.
Two honest limits:
- It needs history. You need a handful of past sessions at each time before the comparison means much.
- It only helps on shorter charts. On a 4-hour chart, a session is only a couple of bars, each mixing busy and quiet hours, so lining up "the same time" adds little. On a daily chart there is no time of day at all.
What this means for your chart: a busy bar at the open is normal. A busy bar at lunch is information. On intraday charts, judge each bar against its own time slot.
5. Effort versus result
Now the habit most volume reading skips. Richard Wyckoff, writing about markets a century ago, framed it simply: volume is the effort, the price move is the result. Compare them.
| Effort (volume) | Result (how far price travelled) | A fair reading |
|---|---|---|
| Big | Big | Genuine participation. The crowd showed up and price moved. |
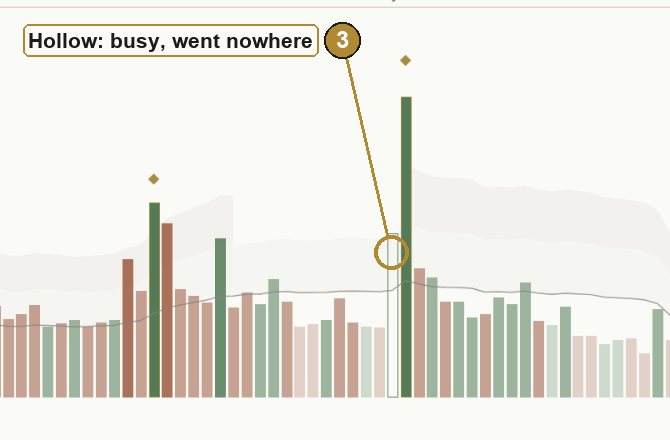
| Big | Small | Something absorbed the effort. Lots of activity, little progress. |
| Small | Big | Price moved without many people behind it. Thin moves can be easier to push back. |
| Small | Small | A quiet bar. Nothing much to say. |
"How far price travelled" is best measured against the bar's usual size, the same way volume is measured against its usual amount. A bar that covers twice its normal range is wide; one that covers half is narrow.
It works the same for both sides.
- Up side. A busy bar covers real ground and closes toward its high: plenty of volume came with a real move. A busy bar closes up but price barely moves: all that effort got little result, and sellers may have been soaking up the buying.
- Down side. A busy bar covers real ground and closes toward its low: plenty of volume came with a real move down. A busy bar closes down but price barely moves: little result again, and buyers may have been soaking up the selling.
Where the bar closed in its range is the only fair way to say which side "had the better" of a bar, and even then it is the better of the close, not proof of who did the trading.
That "soaking up" is called absorption. It is a possibility, not a fact. A busy narrow bar can also just be a pause, or two sides trading heavily at a price they both like.
What this means for your chart: ask two questions of every bar that stands out. How many showed up? How far did they get? The pair of answers is the read.
6. Climax and absorption at the extremes
Two kinds of bar are worth naming, because they tend to turn up near the end of a move.
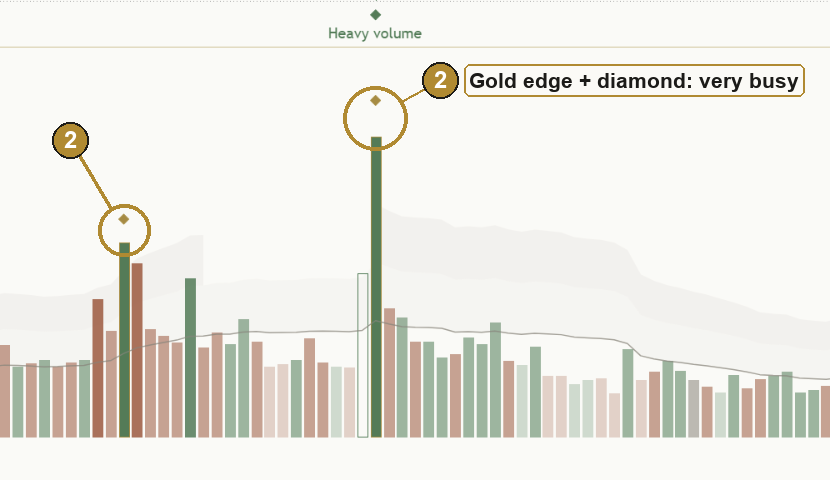
A climax. After a long run in one direction, a bar arrives that is far busier than anything recent, often with a wide range. On the way up it can be the last rush of late buyers; on the way down, the last wave of selling. Sometimes it marks the end of the move. Sometimes the move carries straight on. It is a burst of activity, not a verdict.
Stopping volume, or absorption at an extreme. A very busy bar at a high or a low where price barely moves. On the buyers' side, heavy selling into a low gets soaked up and the low holds for now. On the sellers' side, heavy buying into a high gets soaked up and the high holds for now.
Two honest things about both:
- You only know a bar was the high or the low later. A swing point can only be confirmed once a few bars after it have closed without going beyond it. Any honest marking of "heavy volume at a swing" therefore arrives a few bars late. That delay is the price of not redrawing history.
- Heavy volume at a turn shows that lots of people cared about that price. It does not guarantee the price holds. Busy lows can give way, and busy highs can be taken out.
And keep the extremes rare. If every other bar is flagged as special, none of them are.
What this means for your chart: a very busy bar at the edge of a move is a reason to look closer at what price does next. It is not an answer on its own.

7. VWAP: the day's average price
So far, volume has been about time: how busy each bar was. The next two ideas put volume onto the price axis.
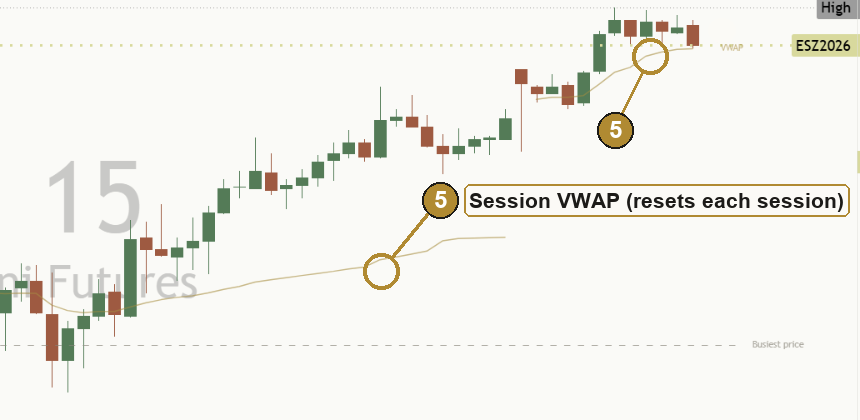
VWAP stands for volume-weighted average price. Take every trade so far today, weight each price by how much traded there, and average it. The result is the average price everyone paid today, with bigger trades counting for more. It starts fresh each session.
How to read it, both ways:
- Price above VWAP: today's trading has, on average, happened lower than where price is now. Buyers from earlier in the day are, on average, sitting on a better price than the current one.
- Price below VWAP: today's trading has, on average, happened higher. Sellers from earlier in the day are, on average, the ones with the better price.
- Price right on VWAP: price is sitting at the day's average, where neither side has the edge on the day so far.
VWAP describes the session so far. It doesn't say where price goes next, and like every volume tool it needs real volume. On tick-volume feeds it is weighted by activity rather than traded size (so "activity-weighted" is the honest name there), and on a daily chart each bar is already a whole session, so a session VWAP has nothing to add there.
What this means for your chart: on an intraday chart, ask which side of the day's average price is on. That tells you, in one glance, whether the session's trading has mostly happened below or above the current price.
8. The busiest price
Instead of asking "how much traded in each bar?", you can ask "how much traded at each price?" Stack all the volume from the last stretch of bars against the prices it traded at, and you get a volume profile: a sideways histogram along the price axis.
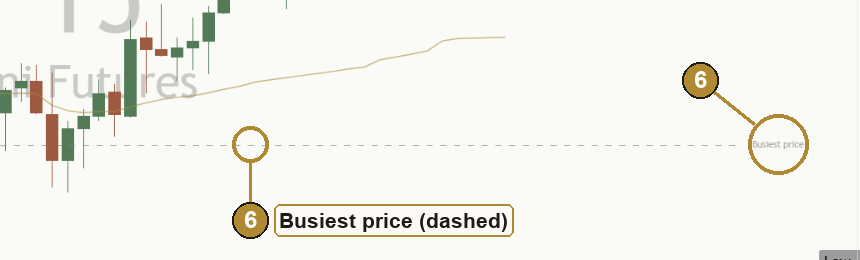
The single fullest level is the busiest price, often called the point of control. It is where the most business was done over that stretch. Markets often spend time around their busiest prices, because both sides were happy to trade there.
- Price above the busiest price: the market has moved up and away from where most of the recent business was done.
- Price below it: the market has moved down and away from it.
- Price near it: price is back where lots of people were happy to trade.
Honest limits: a full profile needs very detailed data (every trade at every price). A quick version, which places each bar's volume at that bar's typical price, gives a fair glimpse but not the exact level. And the busiest price changes as the window rolls forward.
What this means for your chart: the busiest price is a reference point, not a wall. It shows where the crowd has been most active, which helps you describe where price is now.
9. The OBV idea: is volume backing the move?
Joseph Granville came up with On-Balance Volume (OBV) in the 1960s. It is a running tally: on an up close, add the bar's volume; on a down close, subtract it. The number itself is meaningless. Its direction is the point.
The idea is that volume and price should travel together:
- Sellers' side of the question. Price pushes to a new high, but the tally doesn't. Fewer people may be backing the rise.
- Buyers' side of the question. Price slips to a new low, but the tally doesn't follow it down. Selling may be thinning out.
Three honest things about it:
- It is crude. A bar that closes up by a hair puts its whole volume on the up side.
- It is often early, and often wrong. Trends can carry on for a long time with the tally lagging behind.
- It is a heads-up, not a verdict. Like divergence on any indicator, it says "look closer", not "it's over".
What this means for your chart: when price makes a new high or low, it is worth asking whether volume came along for the ride. If it didn't, notice it, and then watch what price does.
10. Volume and price together: trend health and range breaks
Sections 5 to 9 looked at single bars and single levels. Two classic reads look at volume across a stretch of bars, alongside what price is doing.
Trend health: are pushes drawing more volume than pullbacks?
A trend never moves in a straight line. An uptrend is a series of pushes higher and pullbacks; a downtrend is pushes lower and bounces. The old observation, going back to the Dow theorists and Wyckoff, is that in a healthy trend the moves with the trend draw more activity than the moves against it.
- Healthy: pushes are busier than pullbacks. More people show up for the trend than against it.
- Thinning: pullbacks are now busier than pushes. The trend's support is thinning. Trends can run on like this for a long while, so it is a heads-up, not a turn.
- Mixed: both sides draw about the same. Volume isn't adding much either way.
Range-break participation: did people come with the break?
When price closes beyond the top or bottom of its recent range, ask how much volume came with it.
- Above-usual volume: a break with participation. These tend to be more convincing, though even they can slip back inside.
- About usual: neither a strong vote nor a weak one. Let the next few bars show whether it holds.
- Thin volume: few people came along. Thin breaks fail more often.
Two honest rules make this fair. Only count a bar that has closed outside the range (a bar that pokes out and closes back inside isn't a break). And judge "above usual" against the same usual as everything else, the same time of day on intraday charts.
At your level
- Beginner: volume is a vote of participation. A move more people join is easier to trust than one nobody joins. Healthy trend: pushes busier than pullbacks. Convincing break: more people than usual came along.
- Intermediate: compare relative activity, not raw columns, on both sides of the trend, and judge a break against its own time of day. A thin break or a thinning trend is a reason to watch more closely, not a reason to assume the opposite.
- Advanced: keep one huge bar from deciding the whole read by capping how much any single bar can count. Ask for a clear margin (for example one side 1.2 times heavier) before calling it, and hold the call until the two sides cross back, so it doesn't flip every few bars. After a break, the useful question is whether price holds outside the old range.
- Expert: both reads are context, not instructions. Trend-health turns are frequent on fast intraday charts, so anything that alerts on them should wait for the call to hold. On tick-volume feeds, breaks nearly always look "about usual", because tick activity is even; that is honest, but less informative. Neither read says where price goes next.
What this means for your chart: in a trend, compare the pushes with the pullbacks. At a break, check whether the crowd came along. Both describe the quality of a move, not its future.
11. Five common traps
These are mistakes of interpretation. Almost everyone makes them when learning to read volume.
- Reading one tall column without comparing it with anything. Tall compared with what? Without the comparison, it says nothing.
- Comparing every intraday bar with one flat average. The open always looks extreme and lunch always looks dead. Compare with the same time of day.
- Treating column colour as who did the trading, or who was in control. Every trade has a buyer and a seller. The colour only shows whether the candle closed up or down.
- Treating tick volume as share volume. On forex and CFD charts it is often activity. Check what the provider reports, and only compare against the same feed.
- Reading heavy volume as automatically good or bad. Heavy volume can start a move, carry it on, or end it. It shows that lots of people were involved, not where price goes next.
12. Practise it
Reading volume is a skill, and skills come from repetition, not from reading lessons.
- Pick one market and stick with it. One stock, one future or one currency pair you know. Its daily rhythm will soon become familiar.
- Use bar replay. Most charting platforms have a replay mode that hides the future and lets you step forward one bar at a time. Before each step, say out loud: is this bar quiet, normal or busy for its time of day? Did the activity move price, or stall? Where is price against the day's average? Then step forward and see what happened.
- Find the extremes after the fact. Scroll back through a few months and mark every very busy bar and every busy bar that went nowhere. Note which ones came near a turn and which ones came in the middle of a move. You will quickly see that none of them work every time.
- Watch a trend's pushes and pullbacks. In replay, pick a trend and note for each swing whether the push or the pullback was busier. Then find a few range breaks and note which came on above-usual volume and which on thin volume, and which held.
- Keep a short log. One line per observation: what the volume showed, what the effort-versus-result read was, what happened next. A few weeks of this teaches more than any rule.
Key takeaways
What to remember
- Volume measures participation: how much changed hands behind a move. Column colour is the candle, not the trader.
- Know what your feed counts. Shares, contracts and tick counts are different things.
- Always read volume relatively. On intraday charts, compare with the same time of day, not one flat average.
- Effort versus result is the core read: did the activity move price, or stall? It works the same for buyers and sellers.
- VWAP and the busiest price put volume on the price axis. OBV asks whether volume is backing a new high or low. All three describe; none of them predict.
- In a trend, ask whether pushes draw more volume than pullbacks. At a break, ask whether the crowd came along. Context, not a forecast.
- Take the unit from what the provider reports, compare only with the same feed, and treat missing bars as gaps.
13. See it explained live: [TP] Volume - Mentor
Everything in this lesson is built into [TP] Volume - Mentor, a free indicator on TradingView. It draws each idea on your chart and talks you through it in plain English, so you can practise reading volume on live markets instead of from memory.
Here is where each part of the lesson shows up:
- Candle direction, and how busy (sections 1 and 3). The legend says it in one line: "Colour: candle closed up or down. Shade: how busy for its time of day." The columns are green when the candle closed up, terracotta when it closed down, and grey when flat. Their shade shows how busy each bar was compared with usual: faint for quiet, medium for normal, strong for busy, full colour for very busy.
- What the volume counts (section 2). The panel takes the unit from what the provider reports (tick volume, the asset itself or the quote currency). When the provider doesn't say, it gives a hedged hint, for example "The provider hasn't confirmed the unit; for stocks and funds it's usually shares. Treat it as activity on this feed only." A bar with missing volume is left as a gap, not a false zero. On a chart with no volume it draws nothing and says so, rather than guessing.
- Relative activity (section 3). A thin grey line shows what is usual for each bar, with two very soft shaded zones above it for busy and very busy.
- Time of day (section 4). On intraday charts from 1 minute to 1 hour, each bar is compared with the same time slot over the last 10 sessions, so the usual line rises at the open and close and dips at lunch. On longer charts it uses recent bars and tells you why.
- Effort versus result (section 5). A busy bar where price hardly moved is drawn hollow, and the panel says so ("Lots of volume, but price barely moved, though it closed toward its high.") and who may have been soaking it up, for either side.
- Climax and swings (section 6). Very busy bars get a gold edge and diamond. A very busy bar that turns out to be a swing high or low gets a small Heavy volume mark on the price chart, confirmed a few bars late so it never moves afterwards.
- VWAP (section 7). One thin gold line on intraday price charts, and the panel says which side of the day's average price is on.
- The busiest price (section 8). One faint dashed line at the price where the most volume traded over the last 150 bars.
- The OBV idea (section 9). In the Full view, the panel gives a heads-up when price makes a new high or low that the running volume tally doesn't match, checked on closed bars only.
- Trend health (section 10). In an uptrend or downtrend, the panel compares the pushes with the pullbacks over the last 20 closed bars: "In this uptrend, pushes higher draw more volume than pullbacks, a healthy sign but no promise." Or, when it turns: "...so its support is thinning. A heads-up, not a turn."
- Range breaks (section 10). When a bar closes outside its recent range, the panel says how much volume came with it: "price broke above its recent range on thin volume. Thin breaks fail more often, so treat it with caution." Then the Next line says what would show the break didn't stick.
- The plain-English panel. A box on the chart that reads it all for you: where the bar closed in its range ("so buyers had the better of the close"), how busy it was for its time of day, whether the effort got anywhere, the latest standout bar, and one thing worth watching next.
- Alerts. Fourteen descriptive alerts, from a very busy swing being confirmed to a range break on thin volume. Trend-health alerts wait until the call has held, so they stay calm. The messages describe what happened. They never tell you what to do.
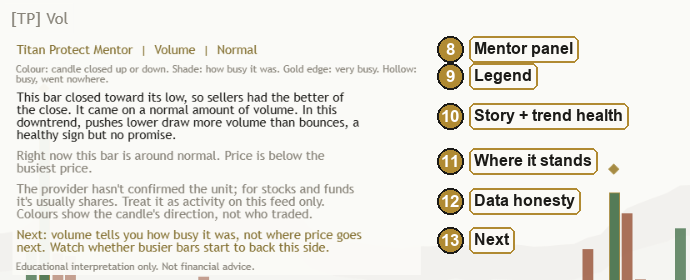
A good way to use it: turn on bar replay, add the Mentor, and read each bar yourself first. Then check your read against the panel. Where you disagree is where you learn.
Test yourself
Take the 12-question quiz below to check what stuck.
Question 1 of 12 · Beginner
What does volume actually measure?
Question 2 of 12 · Beginner
A falling candle has a terracotta volume column under it that is much taller than the columns around it. What is the plainest reading of that column on its own?
Question 3 of 12 · Beginner
Price rises on a bar with much more volume than usual. Is that automatically a good sign for buyers?
Question 4 of 12 · Intermediate
On most spot forex and CFD charts, what does the volume figure usually count?
Question 5 of 12 · Intermediate
On a 15 minute chart, the first bar after the open is twice the recent average volume, but about the same as the opening bar on each of the last ten days. How busy is it, fairly judged?
Question 6 of 12 · Intermediate
A bar closes up on very heavy volume, but its range is much narrower than usual. In effort-versus-result terms, what is the fairest reading?
Question 7 of 12 · Intermediate
A bar closes near its low on busy volume and covers much more ground than a typical bar. What does that describe?
Question 8 of 12 · Advanced
After a long slide, one bar is far busier than anything recent and turns out, once five more bars have closed, to be the swing low. How should you treat that low?
Question 9 of 12 · Advanced
Price pushes to a new 20-bar high, but On-Balance Volume stays below where it was at the previous high. What is the honest reading?
Question 10 of 12 · Advanced
Late in the session, price is sitting right on the session VWAP, which is also near the busiest price of the recent stretch. What does that describe?
Question 11 of 12 · Intermediate
Price closes above the top of its 20-bar range, but the break bar's volume is well below usual for that time of day. What is the fairest reading?
Question 12 of 12 · Advanced
In an uptrend, the pullbacks over the last 20 closed bars have been drawing clearly more volume than the pushes higher. What does that describe?
Educational interpretation only. Not financial advice. Volume describes past activity; it does not predict what price will do next.
Learn the idea here. Apply it with the desk.
Titan Protect turns lessons like this into a daily practice: live market research, the full framework, and the tools that put it to work. This lesson is free; the desk is where it compounds.