Support and resistance: where price turned, and what it did next
Look at any chart and say, in plain words, what a support or resistance level is, why a swing level is always drawn late, and what happened when price came back to it.
By the end of this lesson you will be able to look at any chart and say, in plain words, what a support or resistance level is, why a swing level is always drawn late, and what happened when price came back to it. You will also be able to read a count of past touches, held beside broke through, and say why a count is history, not a promise.
1. The idea in one sentence
Foundry lesson. Free, no gate. Page: /foundry/support-and-resistance/. Educational interpretation only. Not financial advice.
How to use this lesson at your level
- Beginner: sections 1 to 5 and the traps in section 16. Get the habit of seeing a level as a place price turned before, not a wall.
- Intermediate: add sections 6 to 9. Drawn late, role by position, the fresh touch and its three outcomes.
- Advanced: sections 10 to 12. This chart's count, held beside broke through, and what our offline research found.
- Expert: sections 13 to 15, plus the honest limit in every section. The skill is knowing what a count of the past cannot tell you.
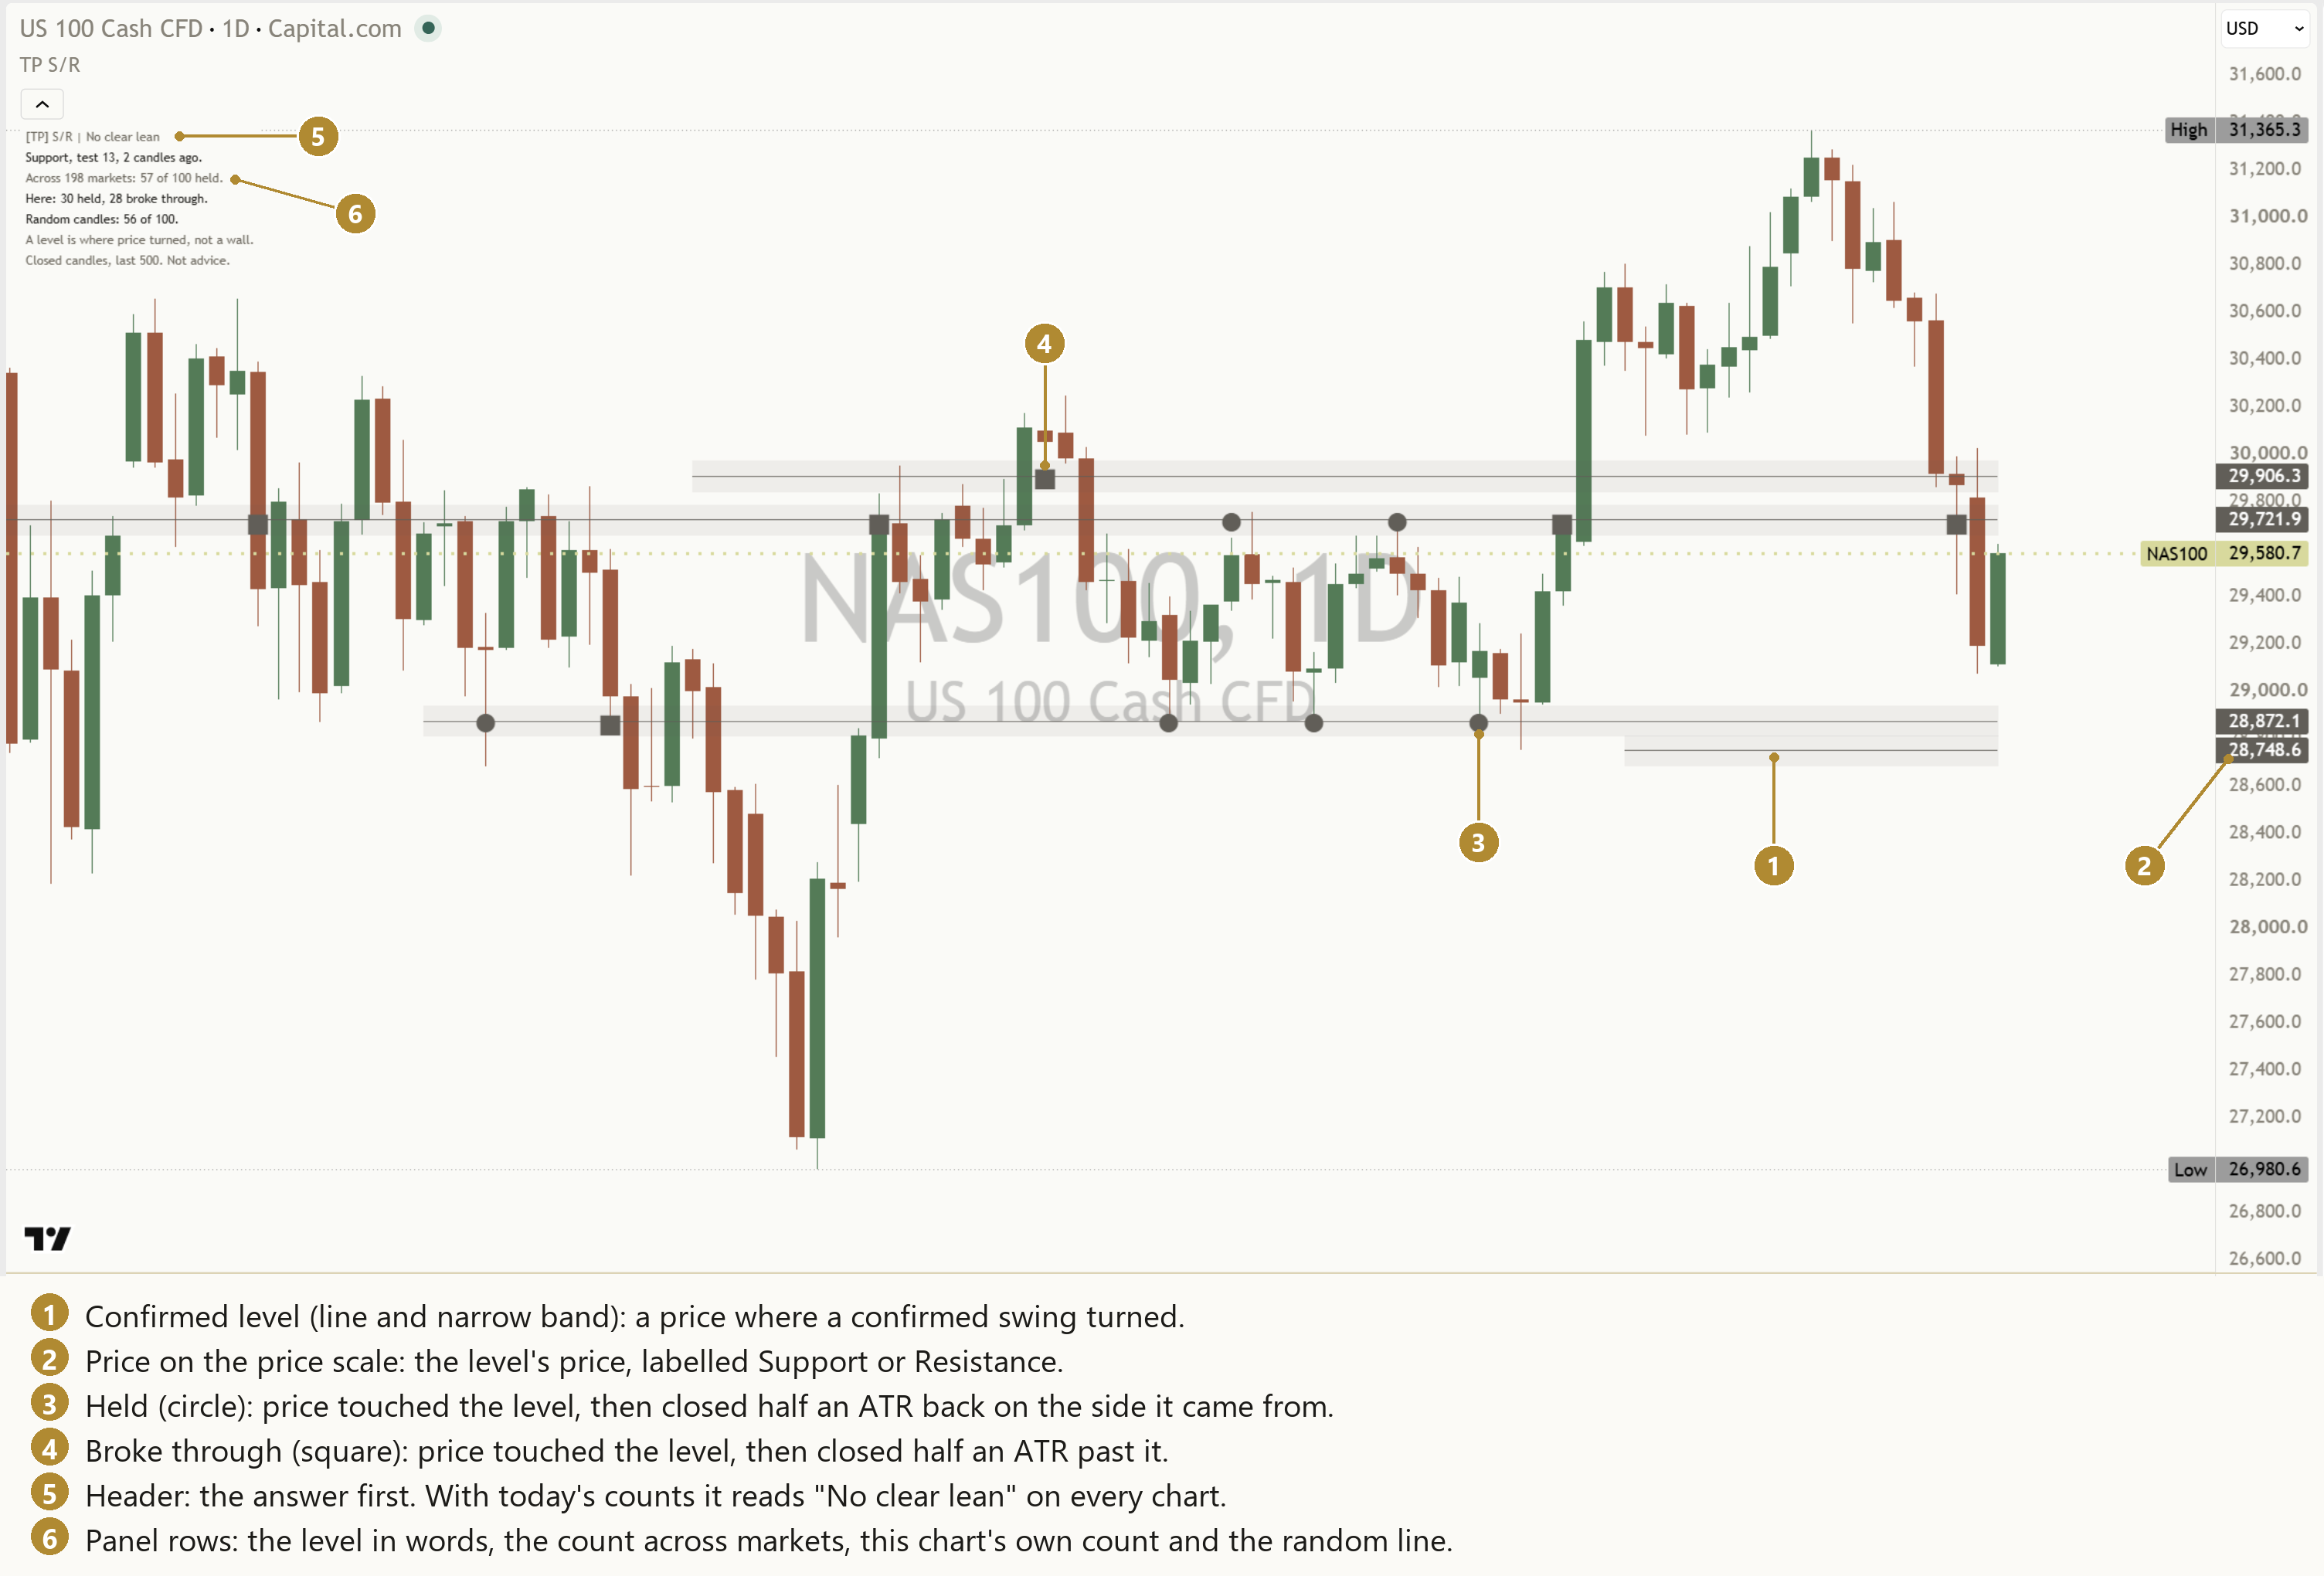
Support is a price below the market where the chart turned up before, and resistance is a price above it where the chart turned down before. Many traders mark those prices and watch what happens when price comes back to them.
That is the whole idea. People often add a story about crowds defending a price, but the chart cannot show that. What it shows is a turn, a later touch, and what came after.
Honest limit: a level describes a past turn. It does not explain why price turned there or say what price does next.
2. Start with a confirmed swing
A swing high is a high with lower highs on both sides of it. A swing low is the mirror. You only know a high was a swing once some candles have closed after it. With five candles on each side, the most common choice, a swing is confirmed five candles after it happened. See Reading market structure for how swings build a trend.
Honest limit: fewer candles on each side find more, smaller swings, sooner. More candles find fewer, larger swings, later. Neither is the true level.
3. A level is a small area, not one price
Price rarely turns at exactly the same tick twice. So a level is better read as a narrow band around a price. A common way to size the band is with the ATR, the average true range: the typical size of one candle over the last 14. See the ATR lesson.
Honest limit: the band width is a choice. A wider band is touched more often, which changes every count.
4. Nearby swings are one level
When two swings turn within a small distance of each other, they are one level, not two. A clean way to do it: if a new swing is within a quarter of an ATR of an existing level, merge it, move the level to the average of its swings, and count one more test.
Honest limit: a level tested many times is a price the chart came back to often. That is all. It does not make the level stronger.
5. Fewer lines, clearer chart
A chart covered in lines makes every price look important. Showing only the nearest two levels above and two below price keeps the question simple: which level is price near now?
Honest limit: hiding far levels makes the chart readable. It does not make the near ones matter more.
6. Drawn late, by design
Put the steps together and every swing level appears late. The swing needs its five candles on the far side before it is confirmed, so the level can only start on that confirmation candle. A tool that draws the level back at the swing itself, before it was confirmed, shows you a line that did not exist at the time.
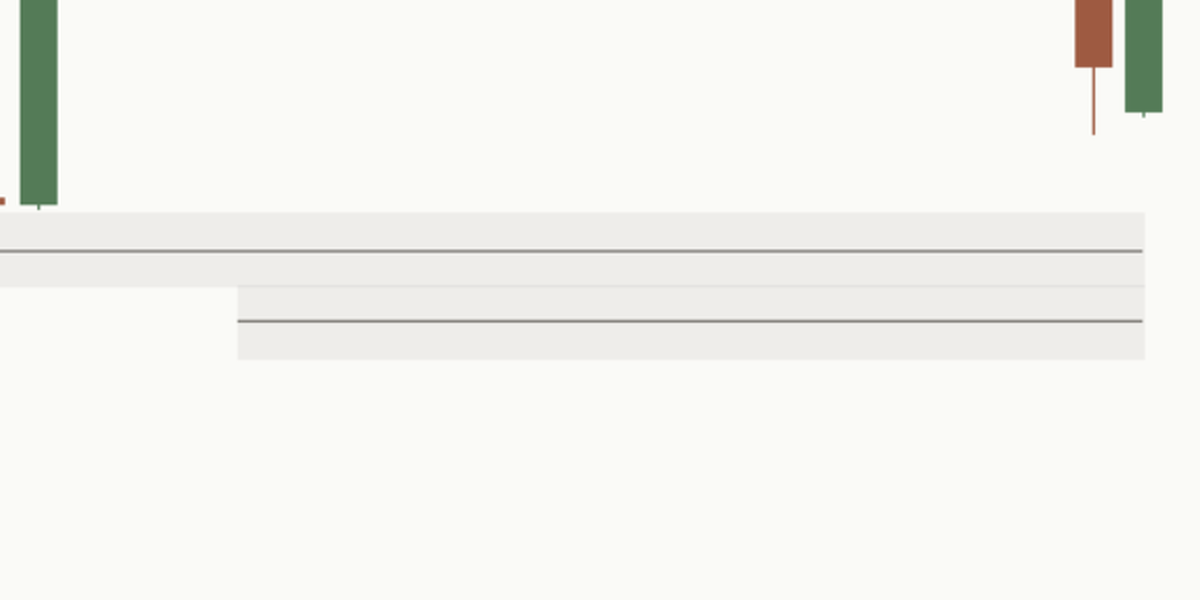
Honest limit: looking at an old chart, every level seems to have been there all along. It was not. Check when it appeared before judging it.
7. Role by position
A level below the last close is support. A level above it is resistance. When price closes on the other side, the same level changes role: old resistance below price is now read as support. That is just position, not a rule that price respects.
Honest limit: a level changing role describes where price is now. It is not evidence that the level will hold.
8. The fresh touch
A touch is a finished candle that reaches within a tenth of an ATR of a level, after the previous close was clearly away from it. Two more rules keep the count honest:
- After a touch, that level waits until a close is at least one ATR away before it can count again, so chop around one line is not many touches.
- Only one touch is watched at a time, and if a candle reaches several levels, only the one nearest the previous close counts. The same candles are never counted twice.
Honest limit: many levels are never touched again. A level price never came back to tells you nothing about how levels behave.
9. Three outcomes over ten candles
From the touch, watch the next ten finished candles and sort the touch into one of three outcomes. For support (mirror everything for resistance):
- Held: a candle closes at least half an ATR above the level. ATR is measured on the touch candle and then fixed.
- Broke through: a candle closes at least half an ATR below the level first.
- No clear move: neither happens within the ten candles.
Only closes decide. A long wick through the level decides nothing, and every unclear case goes to no clear move, never to held.
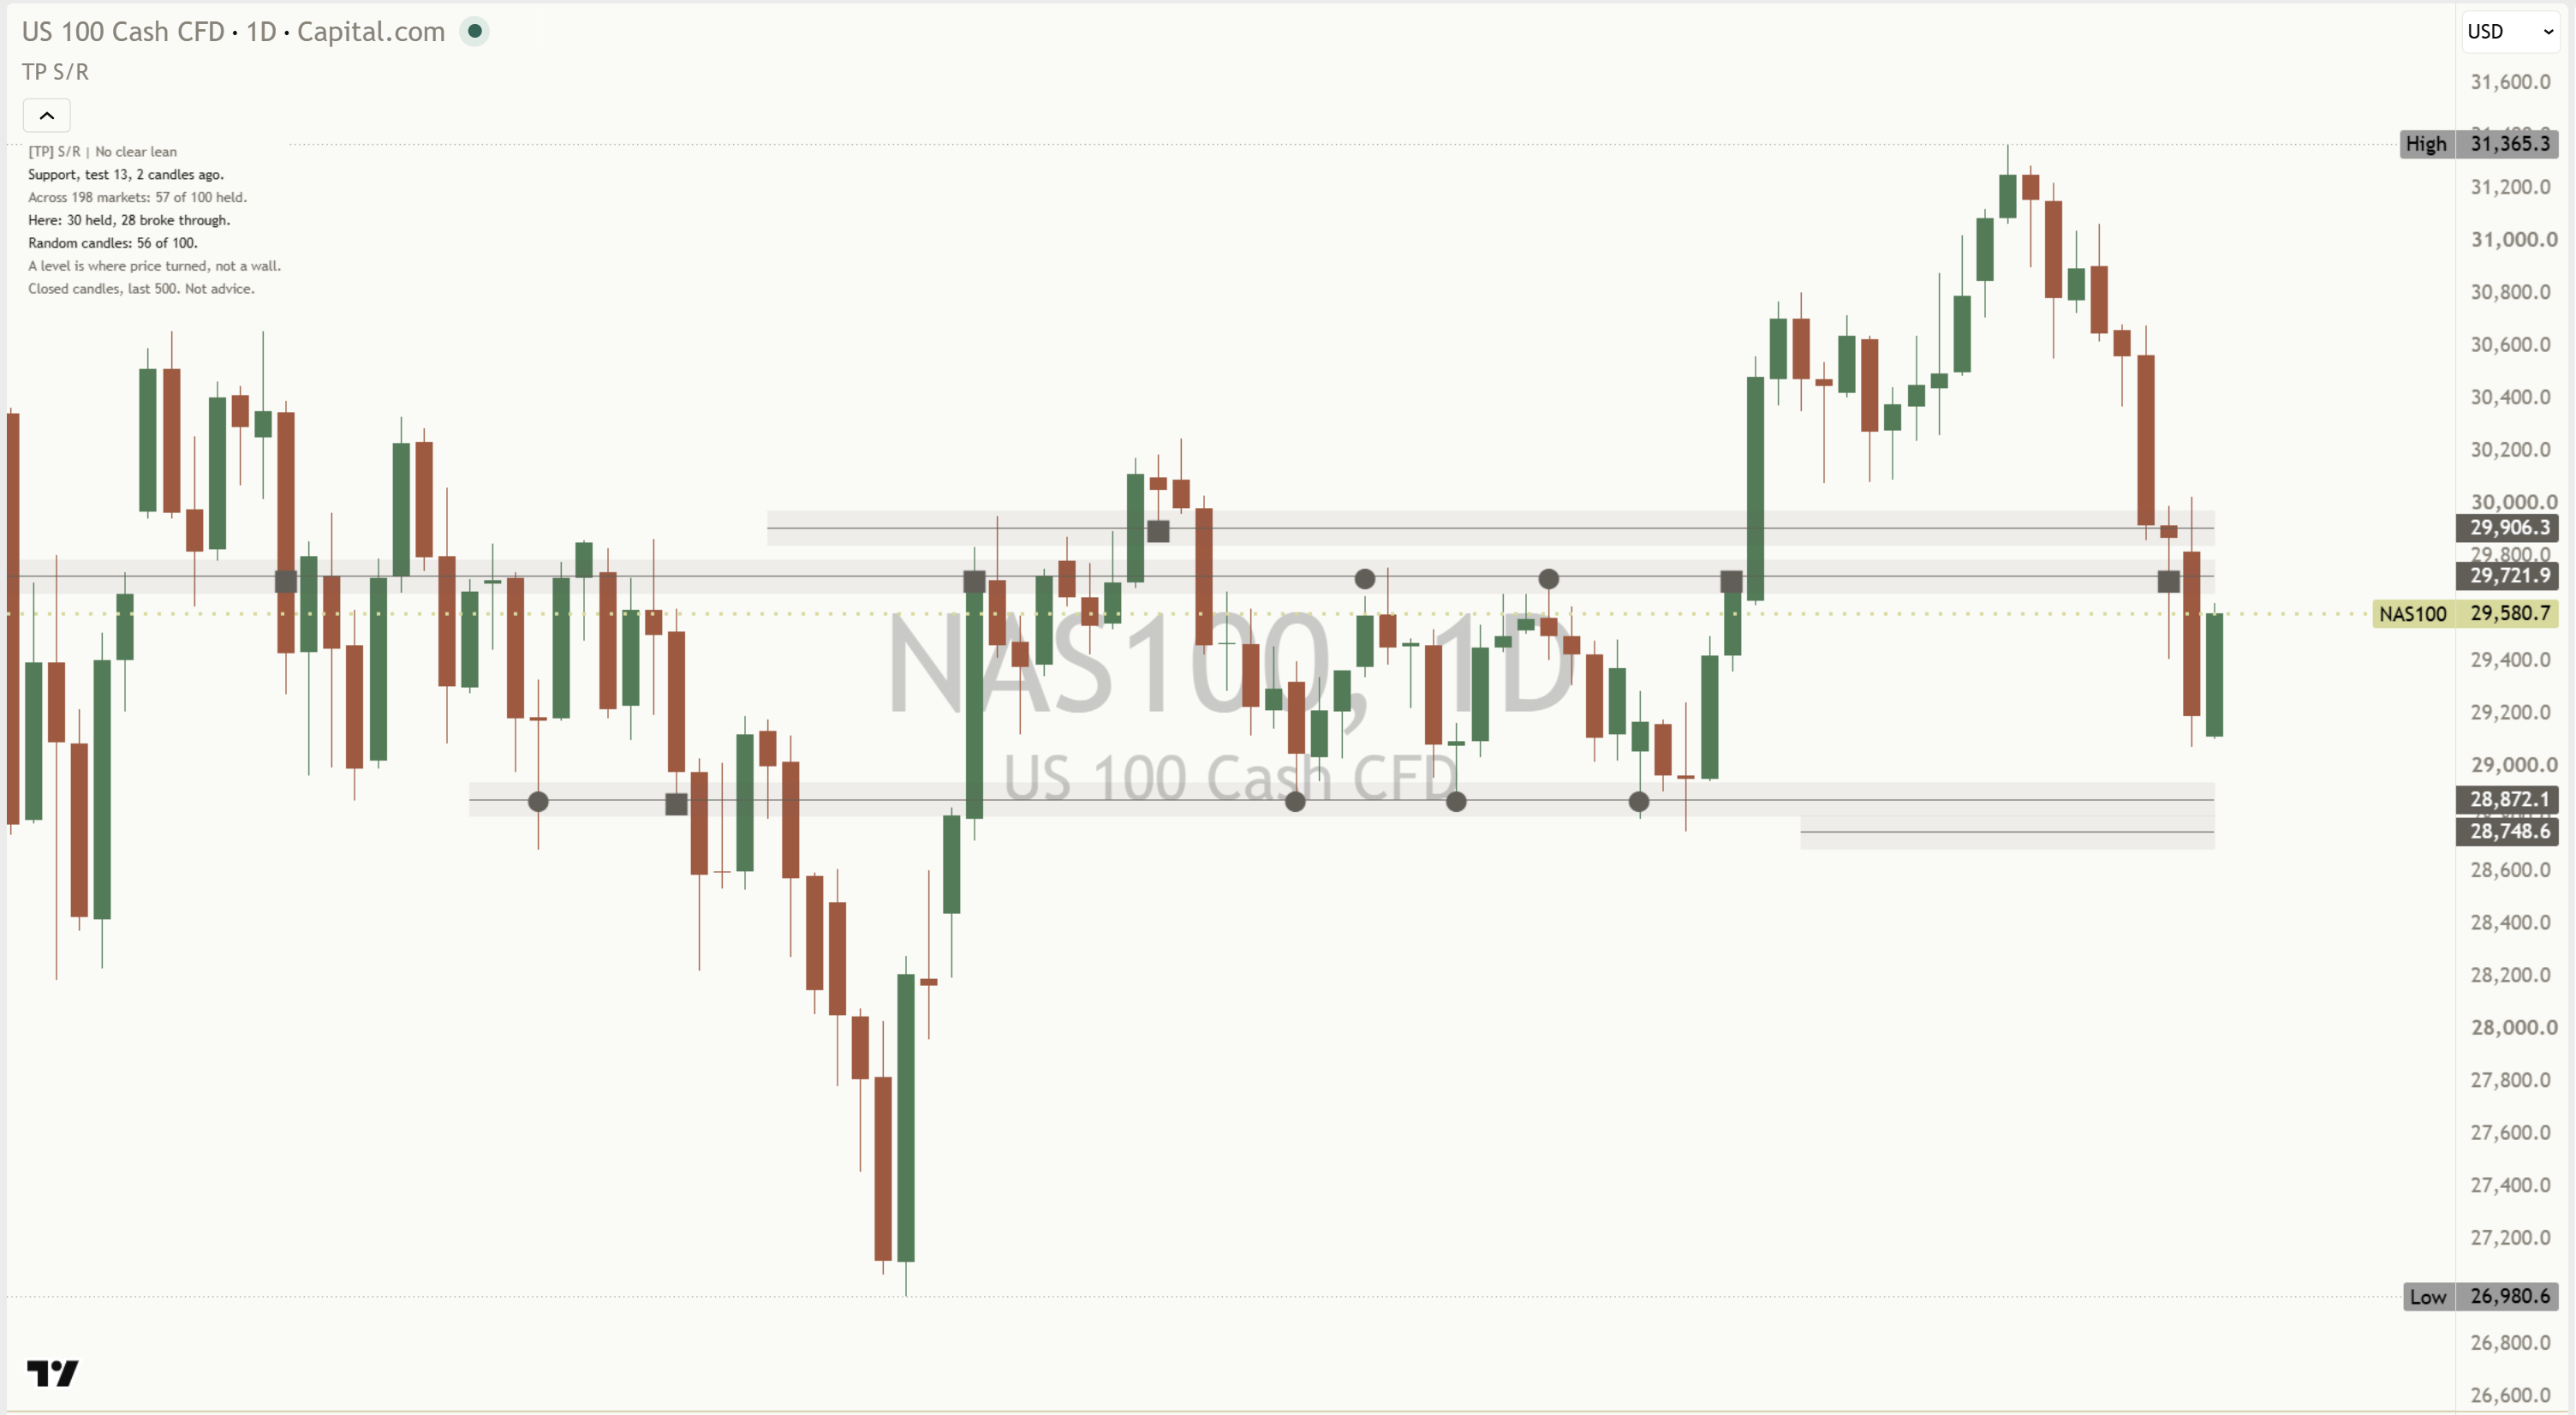
Honest limit: ten candles and half an ATR are choices. A longer window or another distance would sort the same touches differently.
10. This chart's own count
Suppose a chart has 12 settled touches of support in its last 500 candles. Count what happened:
- 7 held, 4 broke through, 1 no clear move. (Worked example.)
The Support and Resistance Mentor writes that as two rows, both outcomes side by side: "Here: 7 held, 4 broke through." and then, because at least one touch did neither, "1 of 12 had no clear move." When none did, that second row is left out. Under 8 touches it writes "Too few here to count yet (5)." with the number so far. No % sign, no adjective.
Honest limit: 12 touches on one chart is a small sample. A few lucky touches can tilt it either way.
11. Read held beside broke through
A count of held means little on its own. Always read it beside broke through. "Here: 30 held, 28 broke through." says the level settled very little on that chart: price came back to it 58 times and went either way about as often. A fair question to ask of any count is: compared with what? On your own chart, you can answer it yourself. Pick any price the chart passed through, with no swing behind it, and log its touches the same way. If it did about as well, the swing level told you nothing extra.
Honest limit: a few dozen touches on one chart is still a small sample, and it tells you about that chart only.
12. Titan research: swing levels against random prices
Titan research. We tested this rule on 200 markets offline. This is our research, not something the indicator reads on your chart.
We took every touch of a confirmed level in 200 liquid stocks on one-hour candles (October 2025 to October 2026) and 198 stocks on daily candles (January 2020 to October 2026), and judged each by the same ten-candle rule. Intraday, 55 in 100 support touches held and 57 in 100 resistance touches held. On daily candles, 57 in 100 support touches held and 54 in 100 resistance touches held. Then we used the close of a random candle 20 to 60 candles back as a level and judged its touches the same way: 56 in 100 held. On every timeframe and side, swing levels held within 2 in 100 of random prices.
That is why the Mentor does not call a side. Its header reads "[TP] S/R | No clear lean" on every chart, and every number on its panel is counted on the chart you are on.
Honest limit: these stocks come from today's list, so markets that no longer trade are missing. And it does not mean levels are useless for describing a chart. It means a touch of a swing level, on its own, told us no more about the next ten candles than a touch of a random price.
13. Why the counts are history, not promises
A count of past outcomes feels like a probability. It is not quite one:
- Small samples. One chart's dozen touches is not many.
- One chart, one setting. Another chart, timeframe or swing length gives other levels and other counts.
- Markets change. The last 500 candles may come from a calmer or a wilder time than now.
- The window rolls. As old touches drop out of the 500, the count can shift with nothing new on the chart.
That is why this chart's count never sets the header, and why held and broke through are always shown together.
Honest limit: counts are the most honest summary of the past a chart can give. They are still only the past.
14. What changing the settings does
- Swing length: fewer candles each side give more, smaller levels, sooner; more candles give fewer, larger ones, later.
- Levels on each side: more lines on the chart; the counts are the same.
- Zone width in ATR: only changes the shaded band. Merging and touches keep their fixed rules.
- The timeframe: each timeframe has its own swings, its own levels and its own count.
Honest limit: changing settings until an old chart looks clean makes it look better on that chart only.
15. Honest limits, all in one place
- A level is a past turn: it shows where price turned, not why.
- Drawn late: every swing level appears some candles after its turn.
- A small area: not one exact price.
- Tested often is not stronger: a test count is a count of visits.
- Closes decide: a wick decides nothing.
- Compared with what: in our offline research, levels held about as often as random prices. The indicator does not show that study; it counts your chart only.
- Counts: history, not a promise.
16. Six common traps
- Treating a line as a wall. It is a past turn.
- Forgetting the level was drawn late. Check when it appeared.
- Covering the chart in lines. Every price then looks important.
- Counting chop as many touches. One fresh touch at a time.
- Letting a wick decide. Wait for the close.
- Reading held without broke through. Read both counts together.
17. Practise it
- Pick one market and one timeframe and keep them for a few weeks.
- When price nears a level, say out loud whether it is support or resistance, and which test it is.
- When price touches it, watch ten candles. Held, broke through, or no clear move?
- Keep a one-line log per touch, including the ones that did not go the way you expected.
- Then pick a random price on the same chart and log its touches too. Compare the two logs.
Key takeaways
What to remember
- Support and resistance are prices where a confirmed swing turned before.
- Every honest swing level is drawn late, once the turn is confirmed, and never moves back in time.
- A level is a small area, and a high test count is not strength.
- A touch is judged on closes over ten candles: held, broke through, or no clear move.
- Always read held beside broke through. The counts are history, not promises.
- In our offline research (Titan research, not a panel figure), swing levels held about as often as random prices.
18. See it explained live: [TP] Support and Resistance - Mentor
Everything in this lesson is built into [TP] Support and Resistance - Mentor, a free indicator on TradingView. It draws the levels on your price chart and talks you through them in plain English, so you can practise on live markets instead of from memory.
Here is where each part of the lesson shows up:
- Confirmed swings and merged levels (sections 2 to 5). "Swing length" sets the swing (Balanced, five candles each side, by default). Only the nearest two levels above and below show ("Levels on each side"). Each one's price shows on the price scale, labelled Support or Resistance (this uses TradingView's "Indicator values" label setting, on by default). "Price tags on chart" (off by default) also prints it beside the newest candle, with a tooltip for its role and tests, for example "Support 21450.5, 2 tests. Swing levels appear only after confirmation." (worked example).
- Drawn late (section 6). Every level starts on its confirmation candle. The teaching line's tooltip says "Swing levels appear only after the candles on both sides have confirmed the turn."
- The touch and its outcome (sections 8 and 9). While a touch is being watched, a gold ring at the Mark size says "Still open, not counted yet". Then "Mark past events" puts a circle for held, a square for broke through and a hollow ring for no clear move on the touch candle, on the level's line and over the candles, in one solid neutral colour. Marks show only for the levels drawn on the chart. The last 12 stay on the chart, and "Mark size" (Normal by default) sets how big they draw.
- The counts (sections 10 and 11). The header reads "[TP] S/R | No clear lean" on every chart. Then the level in words and this chart's own count, for example "Here: 7 held, 4 broke through." and "1 of 12 had no clear move." (worked example; this row shows only when at least one touch had no clear move). Every number comes from the chart you are on.
- What would change the read. With "Panel detail" on Full, one line names the level's own edge: "Changes if: a close half an ATR below it." Then the legend "● held ■ broke through ○ no clear move".
- On the chart at the top of this lesson, NAS100 daily (read 19 Oct 2026), the panel read "Support, test 13, 2 candles ago." then "Here: 30 held, 28 broke through." None of those 58 touches had no clear move, so that row did not show.
- How to read the panel, top to bottom. The header, the level in words, this chart's count, its no-clear-move count, one teaching line such as "Levels are zones, not exact prices.", and the footer: "Closed candles, last 500. Not advice." It never prints a % sign and never instructs.
- Easier to read. "Colours" on Auto matches your chart. "Panel text size" goes from Tiny to Large, and Compact keeps the panel to six rows at most (five when no touch had a no-clear-move result).
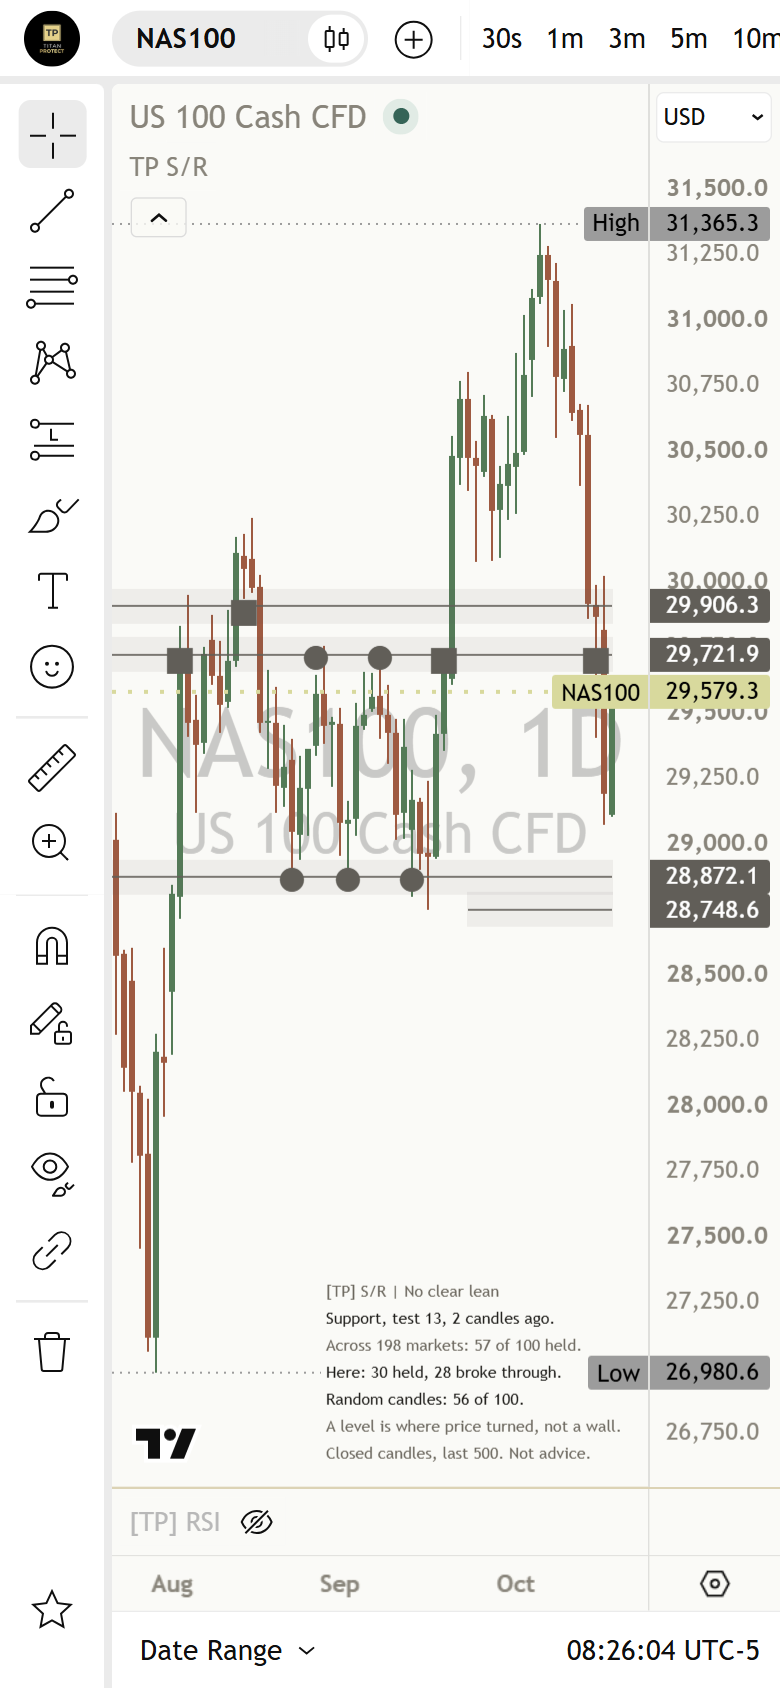
A good way to use it: say what you see first: is price near support or resistance, and which test is it? When price touches it, say what you expect, then watch the ten candles. Then read this chart's count, held beside broke through. Where you disagree is where you learn.
Test yourself
Take the 16-question quiz below to check what stuck.
Question 1 of 16 · Beginner
In plain words, what is a support level?
Question 2 of 16 · Beginner
Why does a swing level appear some candles after the turn it comes from?
Question 3 of 16 · Beginner
Why is a level shown as a narrow band rather than one exact price?
Question 4 of 16 · Beginner
The panel reads "Support, test 3, 5 candles ago." What does "test 3" tell you?
Question 5 of 16 · Beginner
Why does the Mentor show only the nearest two levels above and below price by default?
Question 6 of 16 · Intermediate
Two swings turned within a quarter of an ATR of each other. What does the Mentor do?
Question 7 of 16 · Intermediate
Price closes below a level that was support. How does the Mentor read that level now?
Question 8 of 16 · Intermediate
Price chops back and forth across one level for twenty candles. How many touches does that count as?
Question 9 of 16 · Intermediate
Price touches support. Within ten candles a candle closes half an ATR above the level, and no candle closed half an ATR below it first. What is the outcome?
Question 10 of 16 · Intermediate
A long wick pokes below support, but every close stays near the level for ten candles. What is the outcome?
Question 11 of 16 · Intermediate
A gold ring sits on a recent touch candle. What does it mean?
Question 12 of 16 · Advanced
The panel shows "Here: 7 held, 4 broke through." and "1 of 12 had no clear move." What is that?
Question 13 of 16 · Advanced
On a NAS100 daily chart the panel shows "Here: 30 held, 28 broke through." What is the honest reading?
Question 14 of 16 · Advanced
Where do the numbers on the Support and Resistance Mentor panel come from?
Question 15 of 16 · Expert
The header reads "[TP] S/R | No clear lean". What does that tell you?
Question 16 of 16 · Expert
A level held on its last three touches. What does the Mentor's teaching line remind you?
Educational interpretation only. Not financial advice. Every level describes a turn that already happened, and the counts are history, not promises about what comes next.
Learn the idea here. Apply it with the desk.
Titan Protect turns lessons like this into a daily practice: live market research, the full framework, and the tools that put it to work. This lesson is free; the desk is where it compounds.