Fair value gaps: a fast move, and what came after
Look at any chart and say, in plain words, what a fair value gap is, why it was drawn where it was, and what happened when price first came back to it.
By the end of this lesson you will be able to look at any chart and say, in plain words, what a fair value gap is, why it was drawn where it was, and what happened when price first came back to it. You will also be able to name the play a settled return made (a gap held as support or resistance, or went through and flipped), say which close would end it, and read your own chart's count of past first returns as history, not a promise.
1. The idea in one sentence
Foundry lesson. Free, no gate. Page: /foundry/fair-value-gaps/. Educational interpretation only. Not financial advice.
How to use this lesson at your level
- Beginner: sections 1 to 5 and the traps in section 16. Get the habit of seeing a gap as one fast move, drawn by a rule.
- Intermediate: add sections 6 to 9. Both sides, gaps that stay on the chart, the first return and its three outcomes.
- Advanced: sections 10 to 12. Reading one chart's own count, what it can and cannot tell you, and naming the play a settled return made, with the close that would end it.
- Expert: sections 13 to 15, plus the honest limit in every section. The skill is knowing what a count of the past cannot tell you.
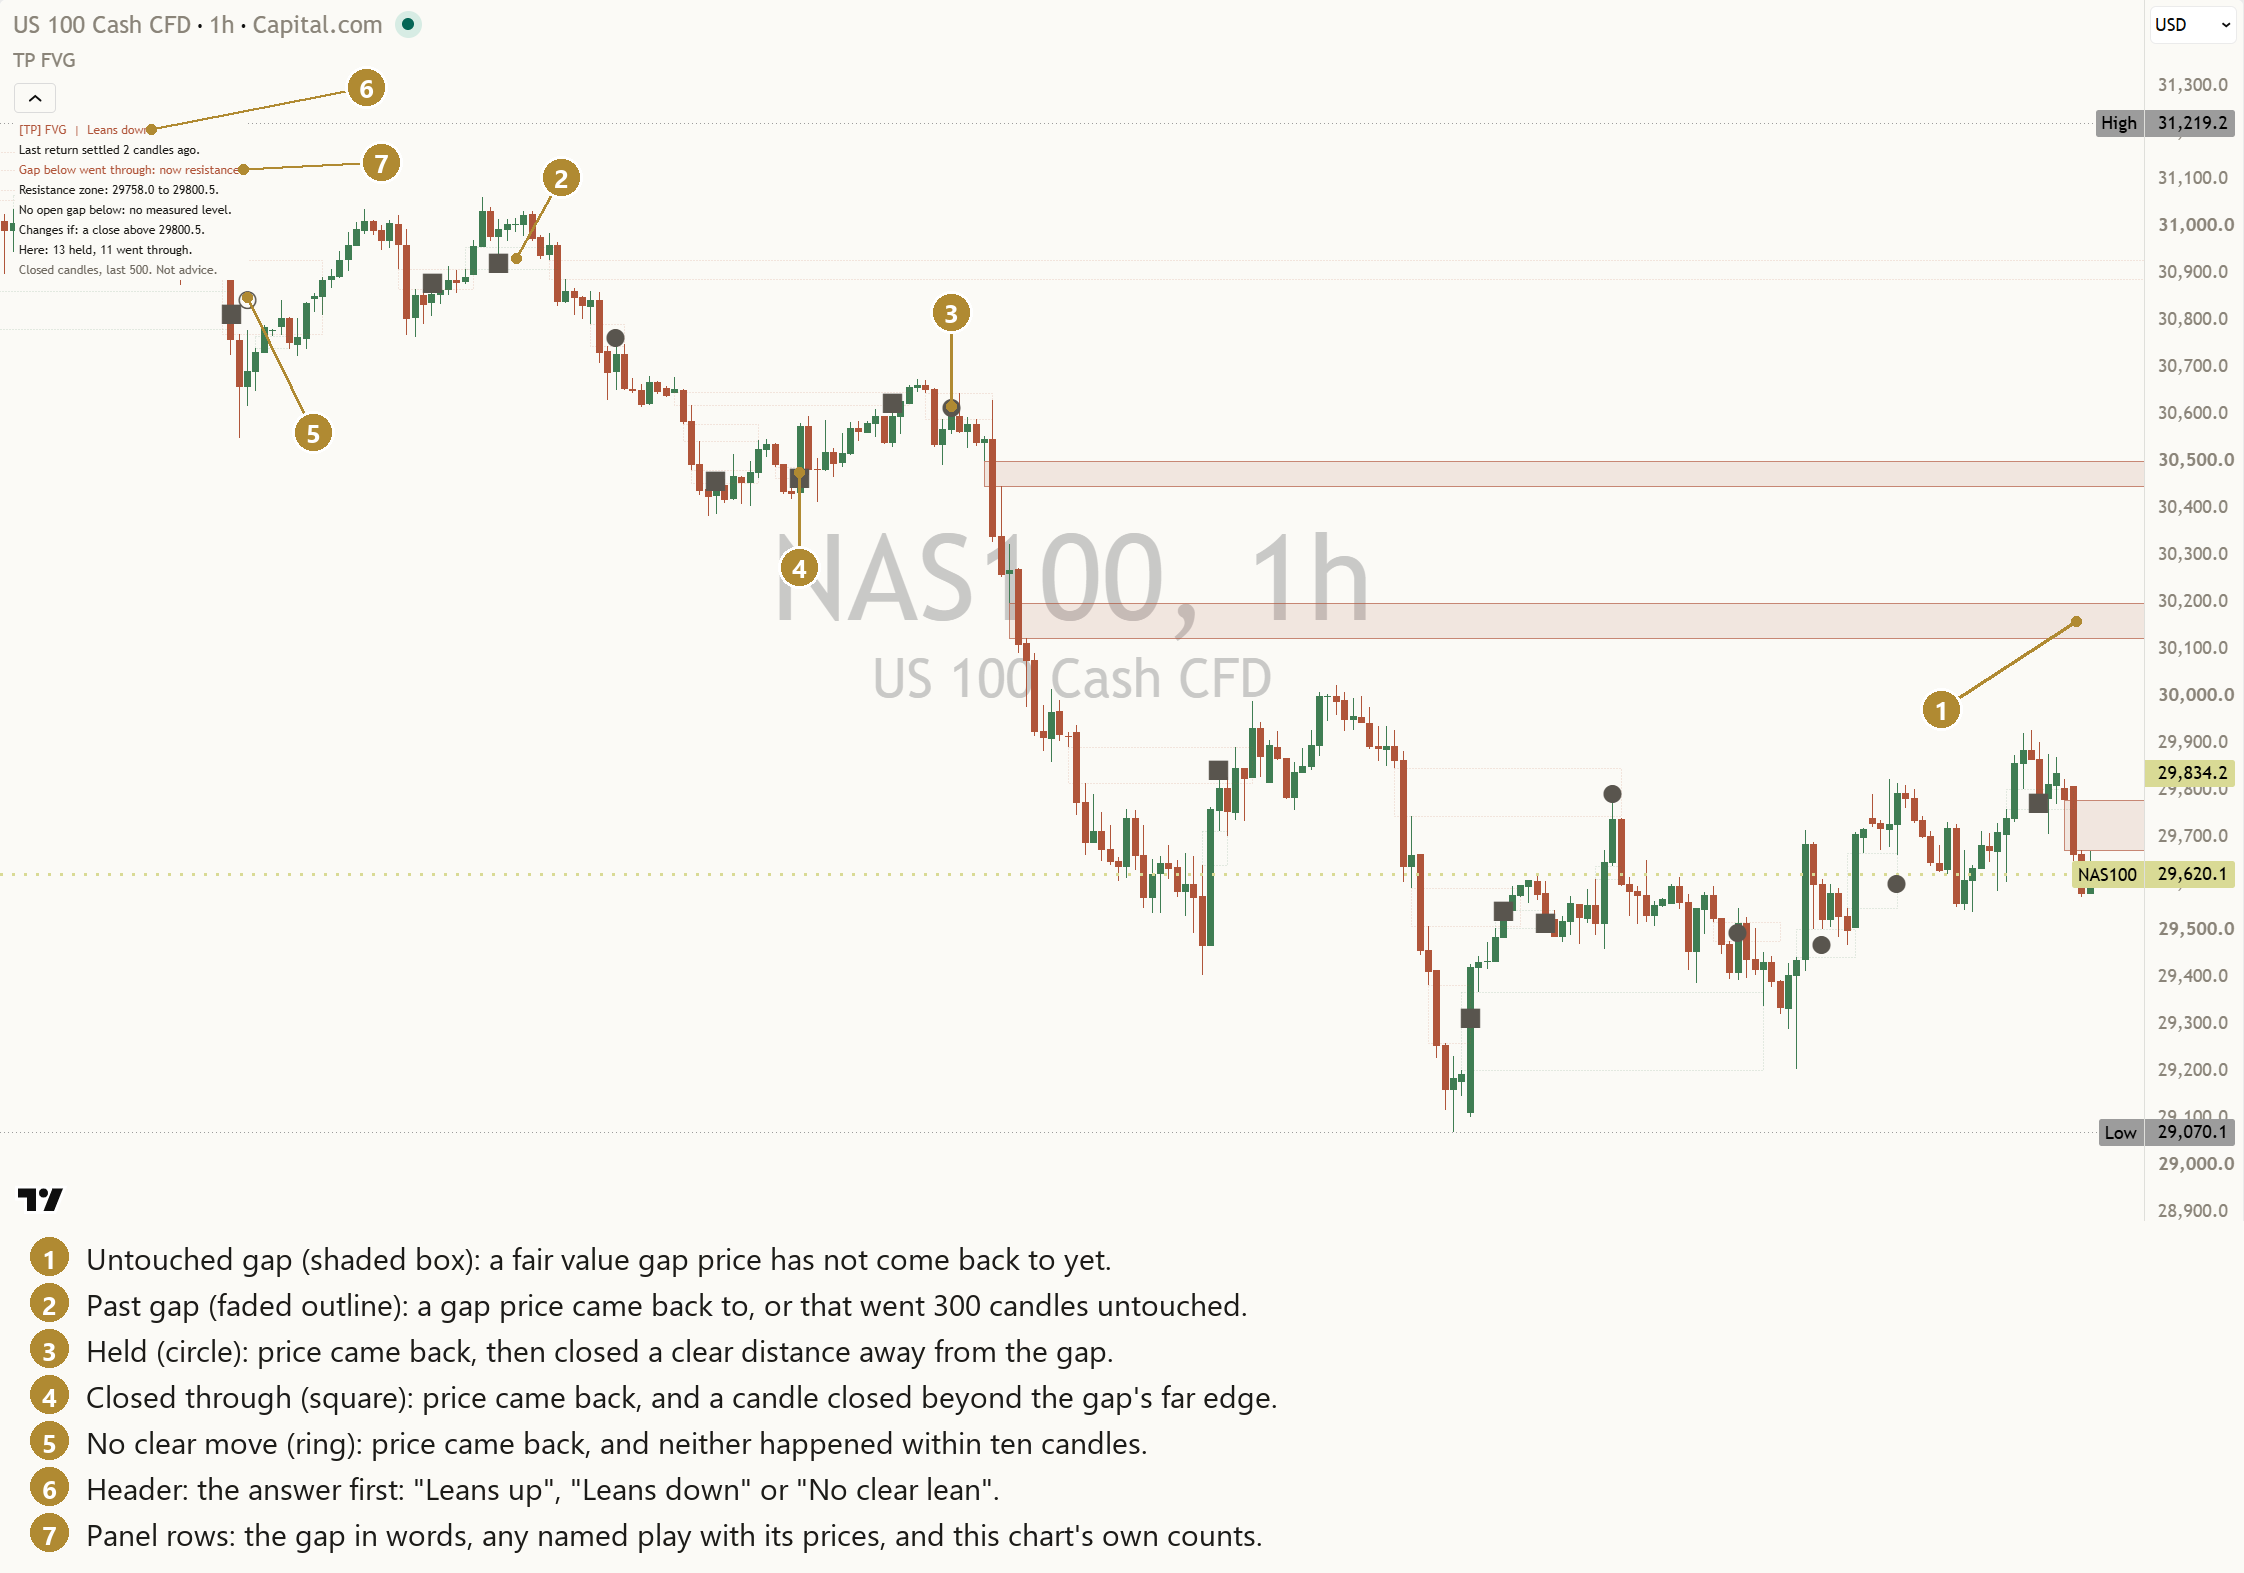
A fair value gap is a three-candle pattern where the middle candle moved so fast that the first and third candles do not overlap. The price range between them was crossed in a single candle. Many traders draw that range as a box and watch what price does when it comes back to it.
That is the whole idea. The name suggests a story about a "fair" price that the market skipped and must return to. The chart cannot show that. What it shows is three candles, a fast move, and what came after.
Honest limit: a gap describes a past move. It does not explain why the move was fast or say what price does next.
2. Three candles, step by step
For a gap below price, after a fast move up:
- Candle 1 is the last candle before the jump. Note its high.
- Candle 2 is the fast candle. It closes above candle 1's high.
- Candle 3 opens and trades, but its low stays above candle 1's high.
The space between candle 1's high and candle 3's low is the gap. For a gap above price, after a fast move down, mirror everything: candle 3's high stays below candle 1's low.
Honest limit: the rule needs all three candles finished. Until candle 3 closes, there is no gap.
3. Big enough to matter
Tiny gaps appear all the time, especially on short timeframes. A common filter is size: keep only gaps at least a quarter of a typical candle. A typical candle here means ATR, the average true range: the usual size of one candle over the last 14. See the ATR lesson.
Honest limit: a size filter is a choice. A smaller filter finds more gaps, a larger one fewer. Neither finds the "real" gaps.
4. Drawn when the third candle closes
Because the rule needs candle 3, a gap is always drawn when that candle closes, starting back at candle 1. On an old chart every gap seems to have been there from the start of the move. It was not: it appeared two candles later.
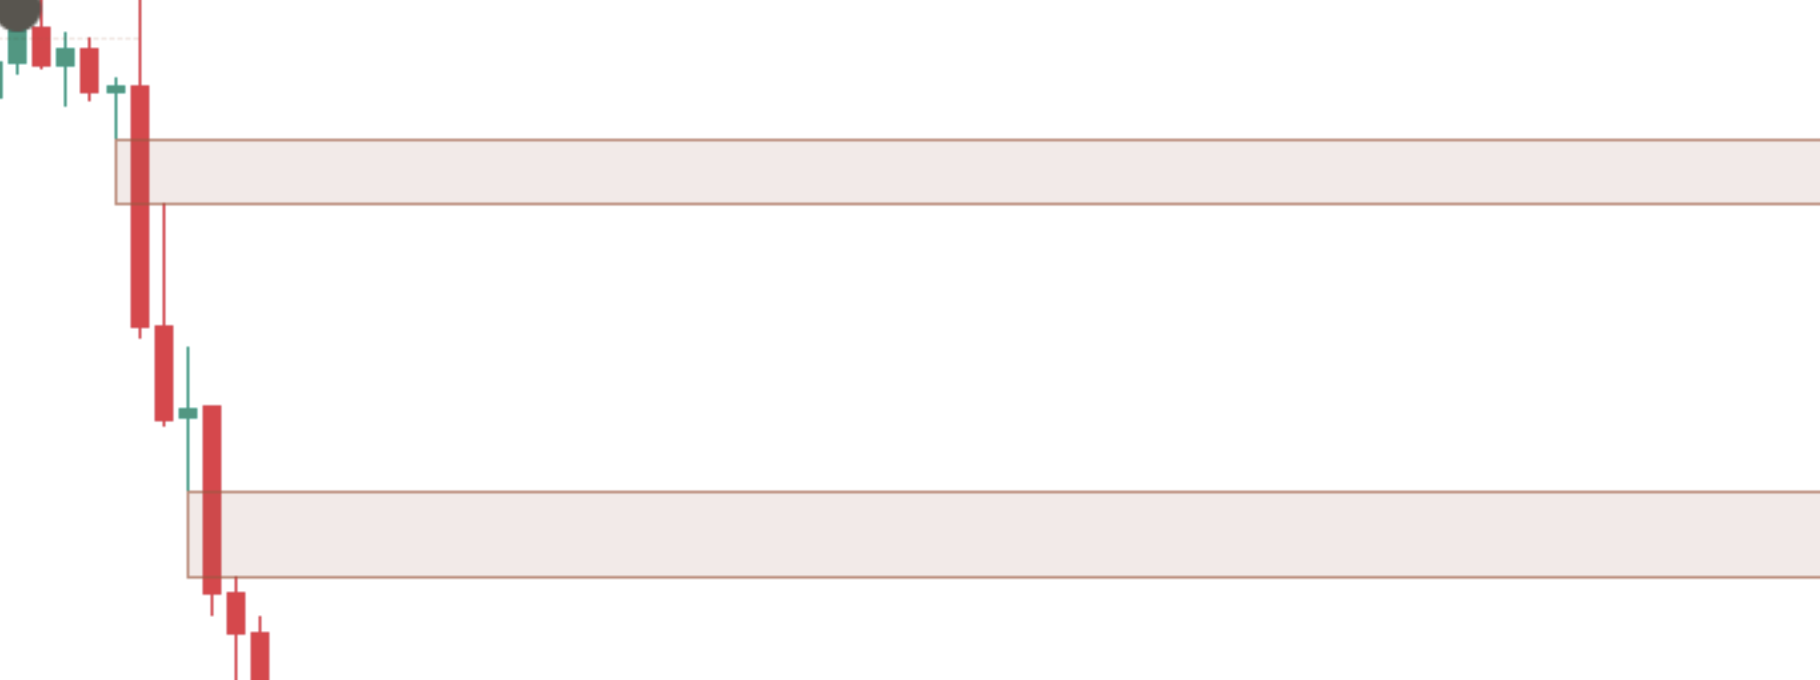
Honest limit: before judging any gap on an old chart, ask when it would have appeared.
5. A fast move, not a magnet
The most common story about gaps is that price has to come back and "fill" them. Some gaps are revisited quickly. Many are revisited much later. Plenty are never revisited at all. A gap tells you price moved fast through a range. It does not pull price back.
Honest limit: "price filled the gap" is easy to say after the fact, and easy to forget when it did not happen.
6. Gaps below, gaps above
A fast move up leaves a gap below price. A fast move down leaves a gap above price. They are the same idea, mirrored, and they are read and counted separately, because price coming down into a gap below and price coming up into a gap above are different situations.
Honest limit: a mirrored rule treats both sides fairly. It does not mean both sides behave alike.
7. Keep every gap on the chart
Many gap tools remove a gap once price fills it. Scroll back on such a chart and every box left standing is one that has not been tested, or one that held. The fair way is to keep every gap: the ones price came back to and the ones it never revisited, as faded outlines once their story is over.
Honest limit: keeping every gap makes the chart busier. It is the price of seeing the whole picture. A chart tool also has a drawing limit, so in practice it keeps the newest gaps and retires the oldest.
8. The first return
The test of a gap is the first time price comes back into it: the first finished candle after the gap was drawn whose high-to-low range reaches into it. Later touches add nothing new, so only the first counts.
One more rule keeps the count honest: watch one return at a time. If price reaches a second gap while the first is still being watched, the second is noted but not counted, so the same candles are never counted twice.
Honest limit: touched is not held. A candle reaching into a gap says nothing yet about what happens next.
9. Three outcomes over ten candles
From the return candle, watch it and the nine candles after it, ten in all, and sort the return into one of three outcomes. For a gap below price (mirror everything for a gap above):
- Held: a candle closes at least one ATR above the gap's top before any close below its bottom. ATR is measured on the return candle and then fixed.
- Closed through: a candle closes below the gap's bottom first. If the return candle itself closes below it, that settles it on the spot.
- No clear move: neither happens within the ten candles.
Only closes decide. A long wick through either line decides nothing, and every unclear case goes to no clear move, never to held.
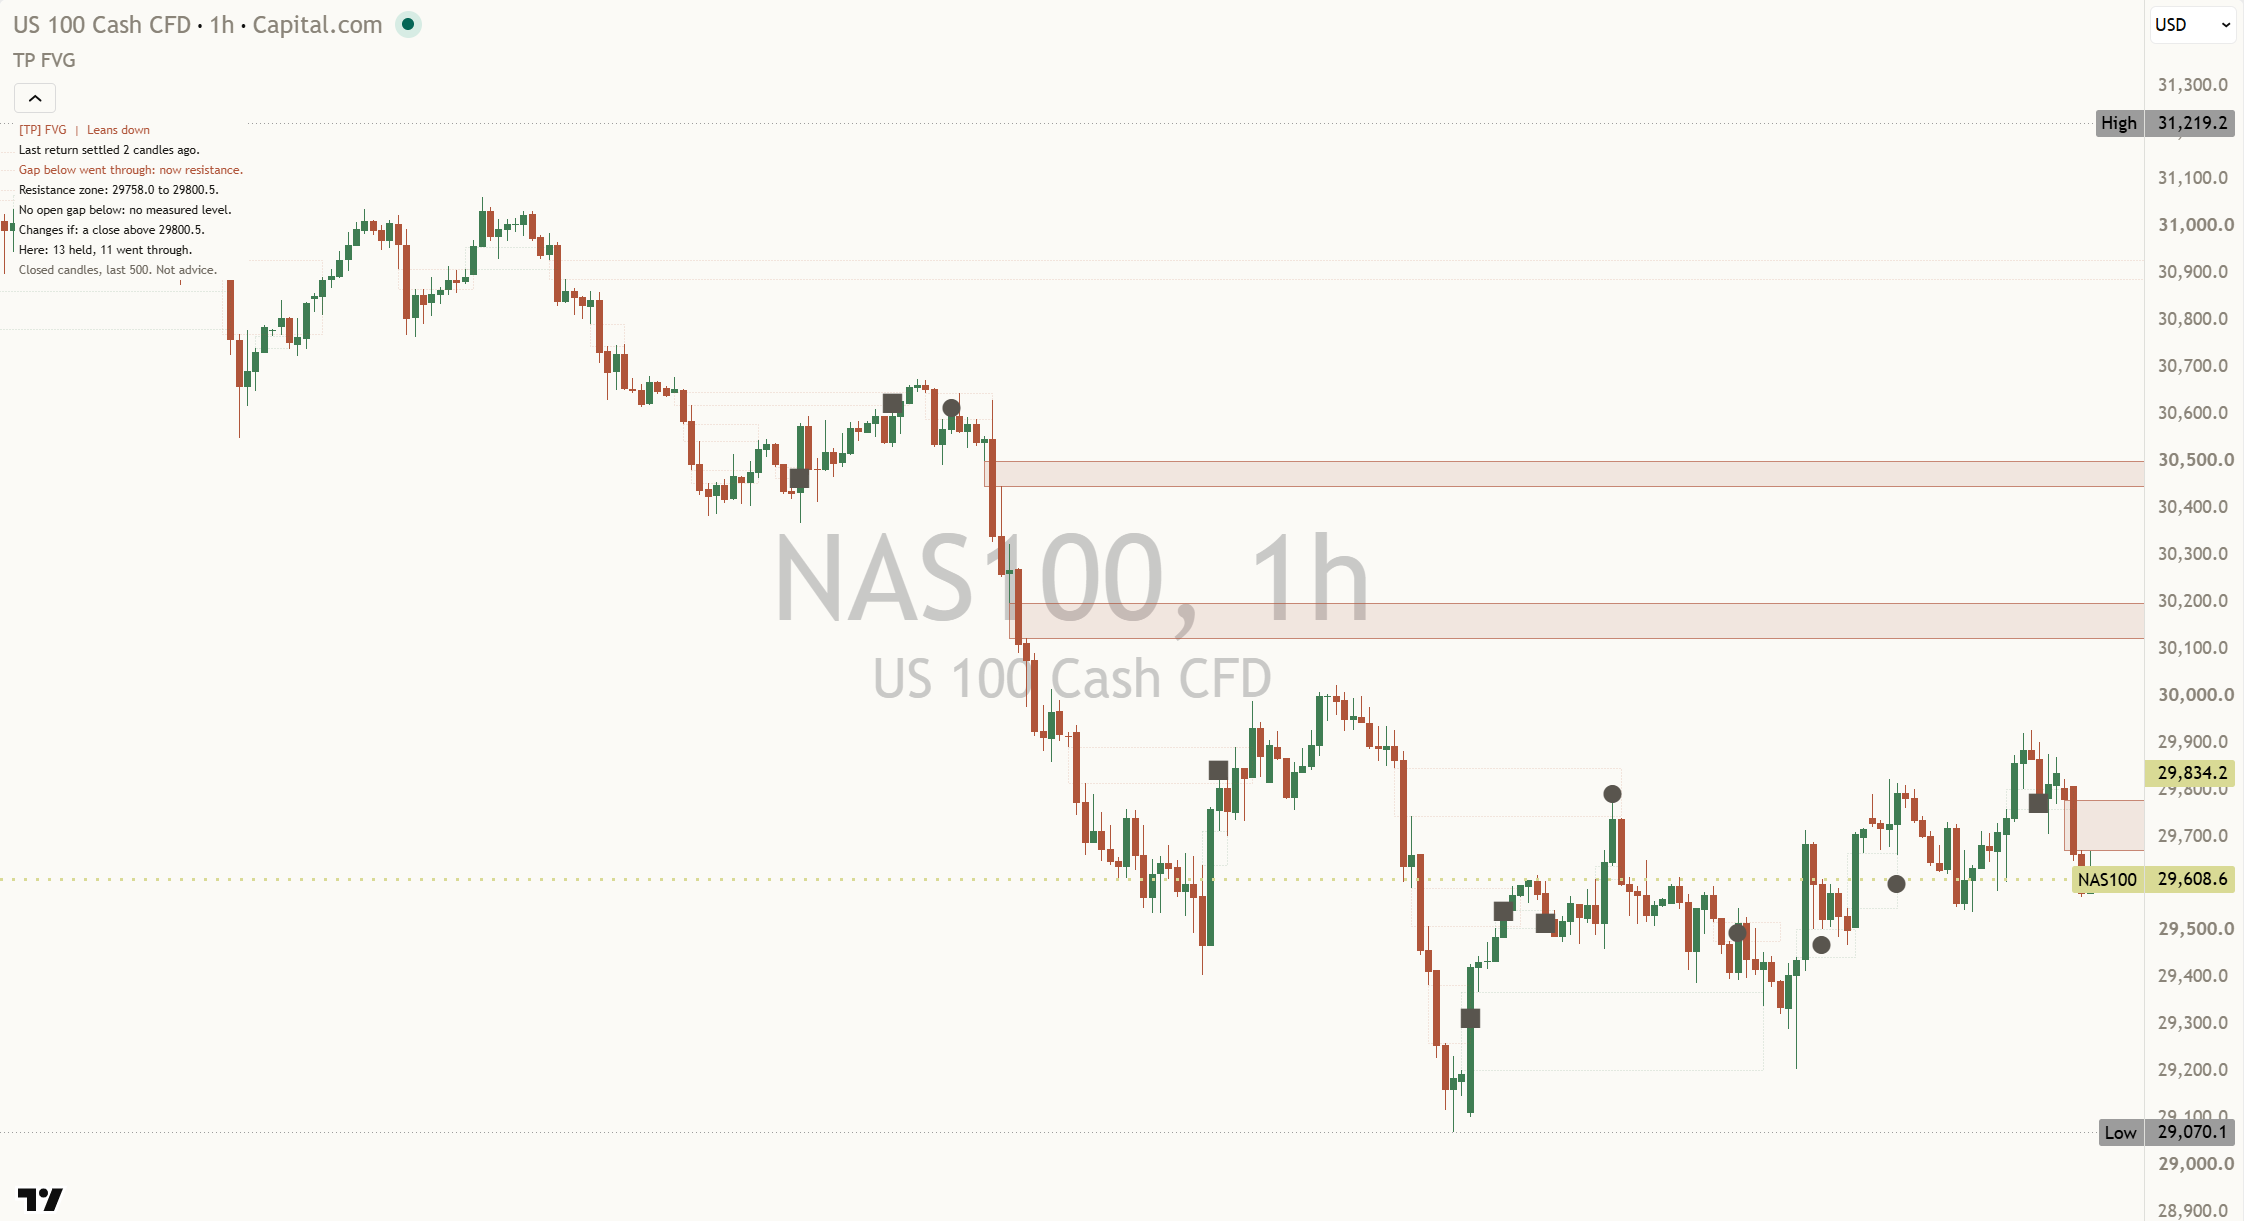
Honest limit: ten candles and one ATR are choices. A longer window or a smaller distance would sort the same returns differently.
10. One chart is not enough
Suppose a chart has 13 settled first returns to gaps below price in its last 500 candles, and 7 of them went through. (Worked example.) Is that a habit of this chart, or chance? With 13 returns you cannot tell. A coin tossed 13 times often lands 7 to 6 or 9 to 4.
So the honest move is to read the count for what it is: the history of this chart, small, and open to chance.
Honest limit: a chart's own count is still worth looking at. It just cannot carry a conclusion on its own.
11. Reading your chart's own count
The count is built from the gaps on your screen. Every settled first return in the last 500 candles, on the side being read, is sorted into held, went through or no clear move by the same ten-candle rule, and each one is marked on the chart where it happened. So you can check every number by eye.
Read the three together. "9 held, 13 went through, 1 no clear move" (worked example) says more than "13 went through" alone, because it shows what the other returns did too.
What a count of a dozen or two returns does not show is a direction. A split like 9 to 13 is well within what chance alone produces, so the count never sets a lean.
Honest limit: the count covers one market, one timeframe and one window of candles. Another market, or the same one on another timeframe, has its own count. Even a lopsided count on one chart can be chance.
12. Naming the play: support, resistance, and the close that ends it
Once a first return settles, the chart has shown something you can name. These are the textbook gap plays, read in plain words:
- Gap below held: it acts as support. Price came back down into the gap and then closed a clear distance above it. The gap is now a zone price has bounced from.
- Gap above held: it acts as resistance. The mirror: price came up into the gap above and closed a clear distance below it.
- Gap below went through: now resistance. Price closed below the gap's bottom. The gap now sits overhead, so the same zone is read the other way.
- Gap above went through: now support. Price closed above the gap's top. The gap now sits underneath.
A return with no clear move names no play. Every named play comes with three prices from the chart: the zone, the next open gap on the side the play points to (a measured level, the next place price meets a gap), and the close that would end it. For example (worked example prices): "Support zone: 21480.25 to 21512.50.", "Next gap above: 21610.00, the next test." and "Changes if: a close below 21480.25."
While the zone holds on closes, the play leans: support plays lean up, resistance plays lean down. A close back through the zone ends the play, and so does a newer first return. Inside a gap's own ten-candle test there is no lean yet: the two closes that would settle it are what to read, for example "Held if a close reaches 21552.75." and "Went through if a close passes 21480.25."
Honest limit: a named play is a pattern, not a promise. A support zone can fail on the next candle, and the next open gap is a level, not a destination. Naming the play says what the chart did, not what to do.
13. Why the counts are history, not promises
A count of past outcomes feels like a probability. It is not quite one:
- Markets change. The 500 candles counted may be calmer or wilder than what comes next.
- Rules matter. Another size filter or another window gives different gaps and different counts.
- Your chart is one chart. Another market can behave differently.
- The window rolls. On a chart, as old returns drop out of the last 500 candles, its own count shifts with nothing new happening.
Honest limit: counts are the most honest summary of the past we can give. They are still only the past.
14. What changing the settings does
- Minimum size: smaller finds more, smaller gaps; larger finds fewer.
- Only gaps after a swing break: keeps fewer gaps, the ones whose fast move also broke a confirmed swing.
- Untouched expiry: how long an untouched gap is kept before it fades without being counted.
- The timeframe: each timeframe has its own gaps and its own count.
- Higher timeframe gaps (off by default): draws the next timeframe's gaps as dashed outlines for context. They are never counted, so they change no count.
Honest limit: changing settings until an old chart looks clean makes it look better on that chart only.
15. Honest limits, all in one place
- A gap is a fast move: it shows speed, not intent.
- Drawn late: every gap appears when its third candle closes.
- Not a magnet: many gaps are never revisited.
- First returns only: gaps never revisited are not counted.
- Closes decide: a wick decides nothing.
- One chart is a small sample: its count never sets the header.
- The lean is the play, not the count: it holds only while the play's zone holds on closes, and one chart's count is too small to name a direction.
16. Six common traps
- Believing every gap must be filled. Many never are.
- Treating a gap as a floor or a ceiling before it has held. It is a past fast move until a settled return shows otherwise.
- Calling a touch "held". Wait for the closes.
- Counting every touch. Only the first return is a fresh test.
- Reading half the count. Read held, went through and no clear move together.
- Trusting a handful of returns. One chart is too small to tell a habit from chance.
17. Practise it
- Pick one market and one timeframe and keep them for a few weeks.
- When a new gap appears, point at its three candles and say which way the fast move went.
- When price first comes back into it, note it, then watch ten candles. Held, closed through, or no clear move?
- Keep a one-line log per gap, including the ones that never came back.
- After a dozen returns, count them yourself, then set your count next to the panel's "Here" count.
Key takeaways
What to remember
- A fair value gap is three candles where the first and third do not overlap: a range crossed in one fast candle.
- A gap is drawn when its third candle closes and never moves after that.
- A gap is a fast move, not a magnet. Many are never revisited.
- Only the first return is a test, judged on closes over ten candles. Touched is not held.
- A settled return names the play: held means support or resistance, went through means the zone flips. Each play has a zone, a next open gap and a close that ends it.
- One chart's count is small: read it whole, and do not lean on it for a direction.
- The counts are history, not promises.
18. See it explained live: [TP] Fair Value Gaps - Mentor
Everything in this lesson is built into [TP] Fair Value Gaps - Mentor, a free indicator on TradingView. It draws the gaps on your price chart and talks you through them in plain English, so you can practise on live markets instead of from memory.
Here is where each part of the lesson shows up:
- The rule (sections 1 to 4). Each gap carries a tooltip. Hover it and it says "Fair value gap: price crossed this range in one candle on the way up. Drawn when the third candle closed." "Minimum gap size" sets the size filter (0.25 of ATR by default), and "Only gaps after a swing break" is off by default.
- Both sides (section 6). Gaps below price are shaded in the up colour, gaps above in the down colour, and the panel counts each side separately.
- Touched gaps stay (section 7). A gap is never removed because price touched it. Returned and expired gaps stay as faded dotted outlines. "Show past gaps (faded)" hides them without changing any count. A gap untouched for 300 candles fades, its outline running to that 300th candle, and is never counted. The chart holds the newest 40 gaps by default ("Zones drawn", up to 100); past that, the oldest is retired.
- The first return and its outcome (sections 8 and 9). While a return is being watched, its gap has a gold border and a gold ring at the Mark size that says "Still open, not counted yet". Then "Mark past events" puts a filled circle for held, a square for closed through and a hollow ring for no clear move on the return candle, at the gap's middle price. The last 12 stay on the chart.
- The counts (sections 10 and 11). Under the play rows comes this chart's own count, "Here: 5 held, 7 went through." and "1 of 13 had no clear move." (worked example), or "Too few here to count yet (5)." under 8 returns. Every number on the panel comes from the chart it sits on, and the count never sets the header.
- The plays (section 12). When a return settles, the panel names it: "Gap below held: it acts as support.", "Gap above held: it acts as resistance.", "Gap below went through: now resistance." or "Gap above went through: now support.", then the zone, the next open gap and the change row, all priced from your chart. The header reads "[TP] FVG | Leans up" or "Leans down" while the zone holds, and "No clear lean" otherwise. While a return is still being watched, it shows "Test zone", "Held if a close reaches ..." and "Went through if a close passes ...". A play stays named for up to 50 candles ("Name a play for").
- On the chart at the top of this lesson, NAS100 one hour, read on 22 Oct 2026, the panel was naming a play on the gap below: "[TP] FVG | Leans down", "Last return settled 2 candles ago.", "Gap below went through: now resistance.", "Resistance zone: 29758.0 to 29800.5." and "Changes if: a close above 29800.5.", then this chart's count, "Here: 13 held, 11 went through." None of those 24 returns had no clear move, so that row was left out.
- How to read the panel, top to bottom. The header, the gap in words, any named play with its zone, level and change rows, this chart's count, how many had no clear move, the definition "Fair value gap: range crossed in one candle." (when no play or test is on the panel), and the footer: "Closed candles, last 500. Not advice." It never prints a percentage and never tells you what to do.
- Full detail. "Panel detail" on Full adds "Changes if: a close below the gap." when no priced change row shows, one teaching line such as "A gap is a fast move, not a magnet." (or "A named play is a pattern, not a promise." while a play is named), and the legend.
- Alerts. One alert per play ("Play: gap below held" and the rest) and "Play ended", next to "A gap formed", "Price returned to a zone" and "A zone's outcome settled". With "Play alerts with prices" on, an "Any alert() function call" alert carries the zone, next gap and change prices from your chart.
- The bigger picture, kept apart. "Higher timeframe gaps" (off by default; One step up or Custom) draws gaps from finished higher timeframe candles as dashed outlines with no fill. Hover one and it says, for example, "Higher timeframe gap (4H)". They are never counted. On Full, one row adds context: "Neutral: no higher timeframe gap yet.", "Agrees: higher timeframe gap same side." or "Disagrees: higher timeframe gap other side."
- Easier to read. "Colours" on Auto matches your chart. "Panel text size" goes from Tiny to Large, and Compact keeps the panel short.
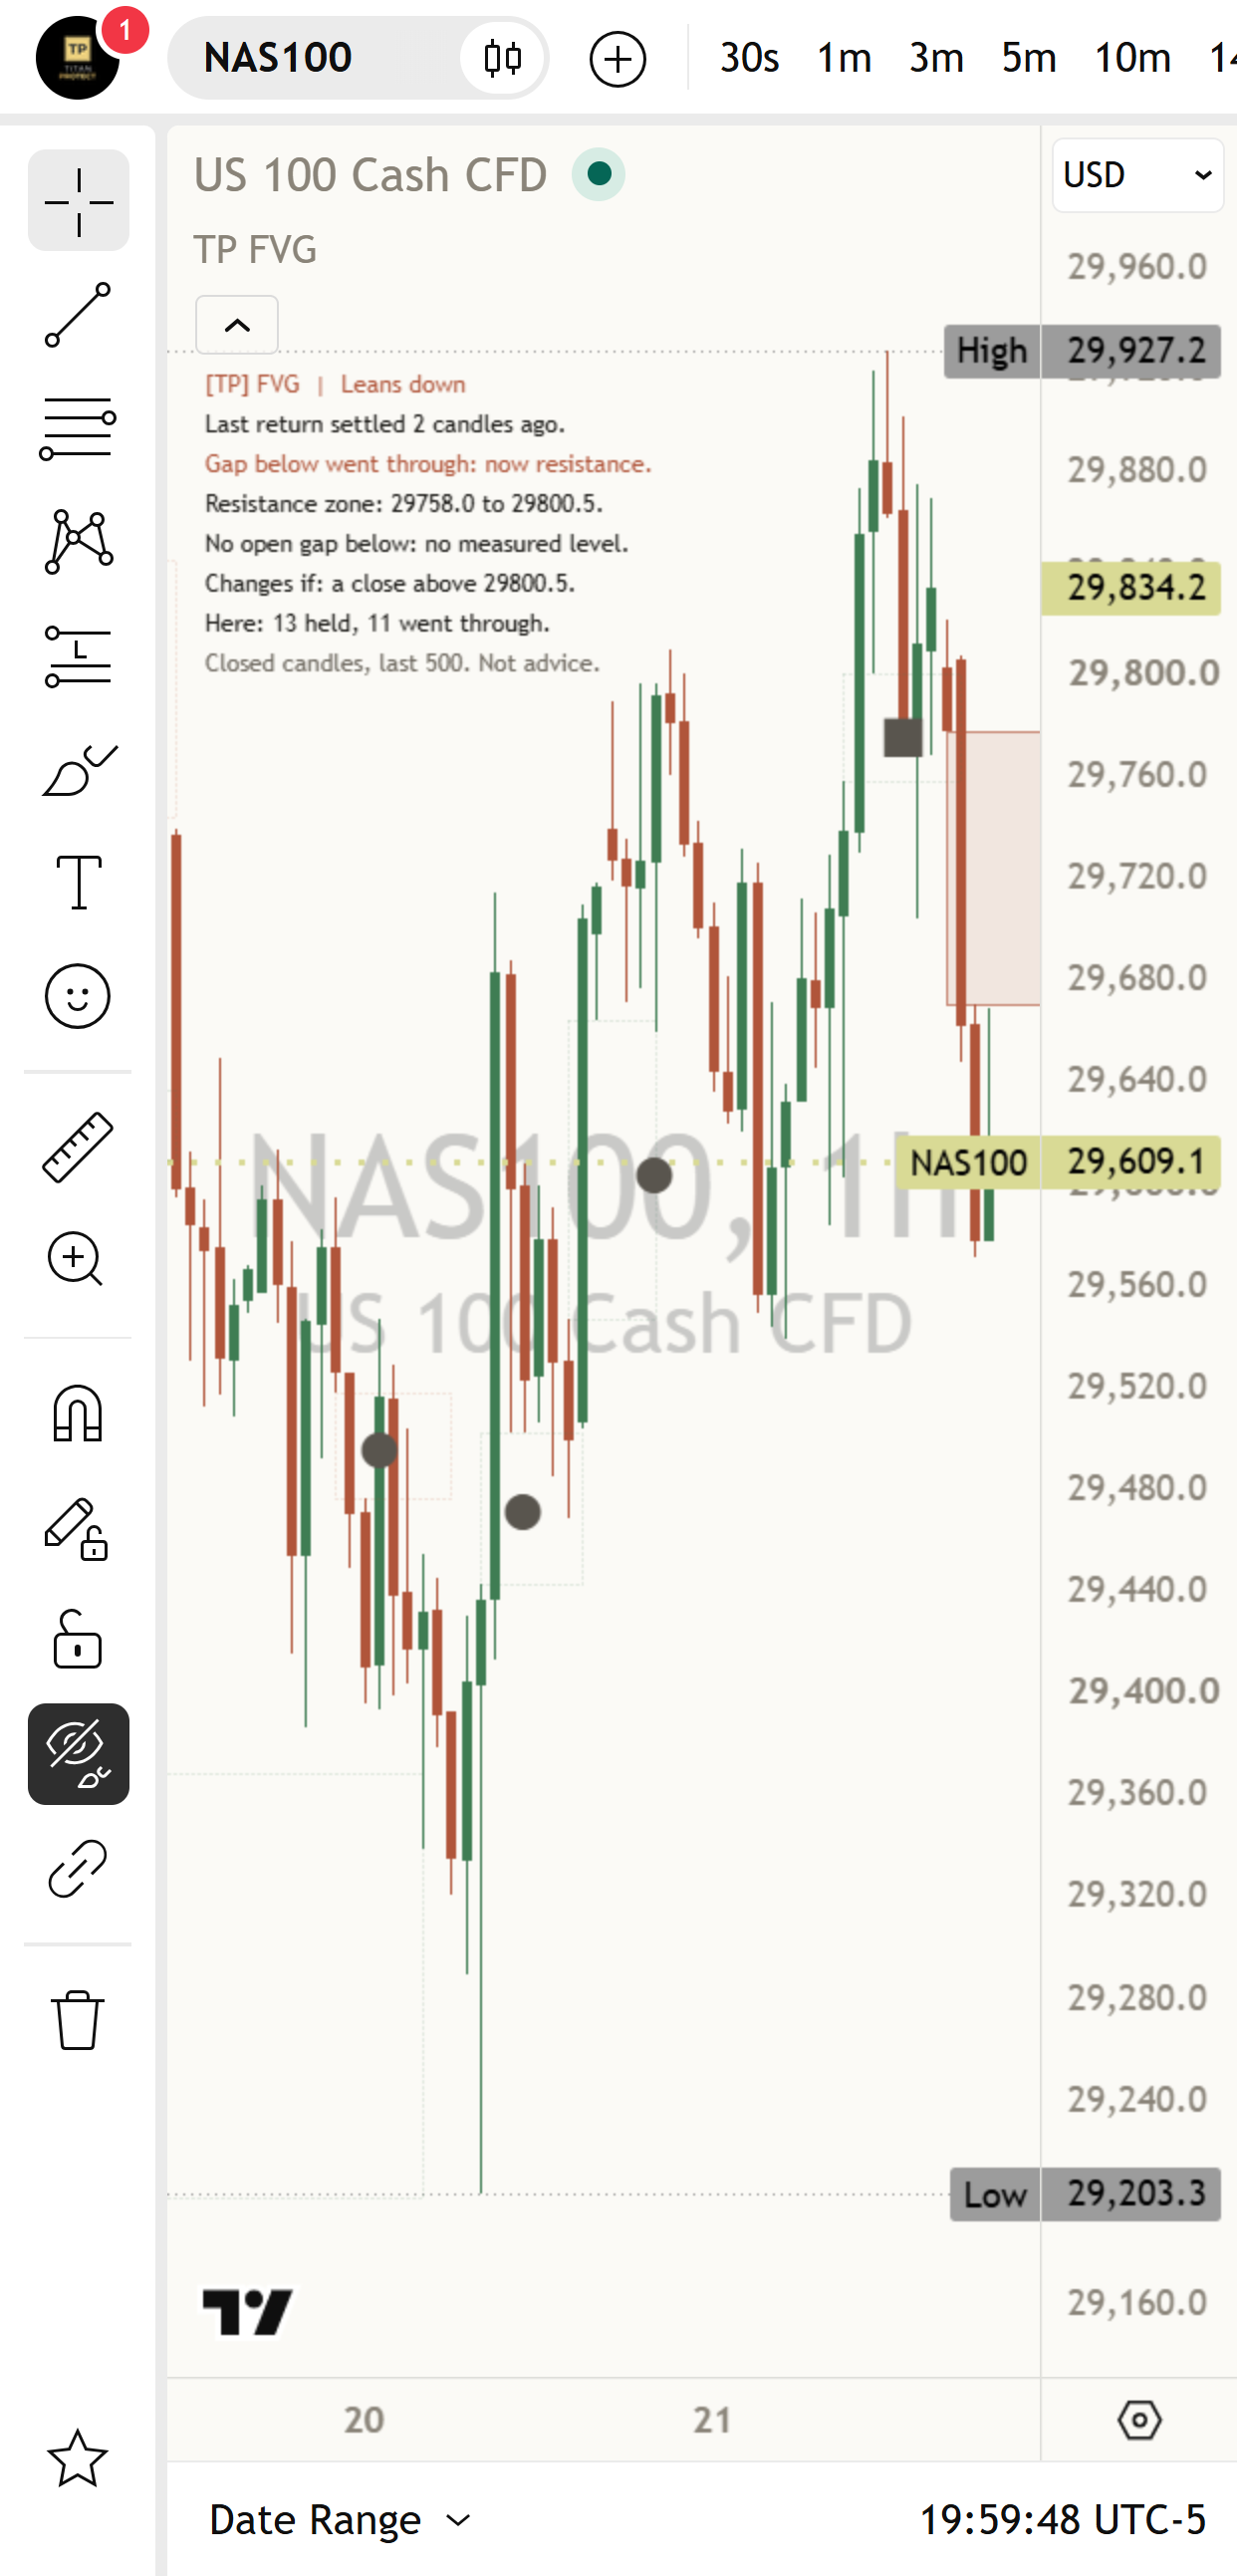
A good way to use it: say what you see first: which three candles made the gap? When price comes back, say what you expect, then watch the ten candles. When the panel names the play, say which close would end it before you read the change row. Then read this chart's own count of held and went through. Where you disagree is where you learn.
Test yourself
Take the 16-question quiz below to check what stuck.
Question 1 of 16 · Beginner
In plain words, what is a fair value gap?
Question 2 of 16 · Beginner
For a gap below price, which two prices are its edges?
Question 3 of 16 · Beginner
When is a gap drawn on the chart?
Question 4 of 16 · Beginner
Which sentence matches the panel's teaching line?
Question 5 of 16 · Beginner
Why does the indicator ignore very small gaps?
Question 6 of 16 · Intermediate
What counts as the first return to a gap?
Question 7 of 16 · Intermediate
Price comes back into a gap below. Within ten candles a candle closes one ATR above the gap's top, before any close below its bottom. What is the outcome?
Question 8 of 16 · Intermediate
Price comes up into a gap above, and the very same candle closes above the gap's top. What is the outcome?
Question 9 of 16 · Intermediate
A long wick pokes through the far edge of a gap, but the candle closes back inside. What does that decide?
Question 10 of 16 · Intermediate
Why do faded past gaps stay on the chart?
Question 11 of 16 · Advanced
The panel reads "Here: 9 held, 13 went through." and then "1 of 23 had no clear move." Where do these numbers come from?
Question 12 of 16 · Advanced
A first return to a gap below settles as held, and the panel reads "Gap below held: it acts as support." What would end that play?
Question 13 of 16 · Advanced
Why does this chart's own count never set the header?
Question 14 of 16 · Advanced
The panel shows "Too few here to count yet (5)." What does it mean?
Question 15 of 16 · Expert
The header reads "[TP] FVG | Leans down". Which panel state fits?
Question 16 of 16 · Expert
Which teaching line fits the idea that a candle touching a gap says nothing yet about what happens next?
Educational interpretation only. Not financial advice. Every gap describes candles that already closed, and the counts are history from past returns, not promises about what comes next.
Learn the idea here. Apply it with the desk.
Titan Protect turns lessons like this into a daily practice: live market research, the full framework, and the tools that put it to work. This lesson is free; the desk is where it compounds.