Reading market structure: highs, lows and what a break really means
Read a chart's swings in plain words: rising, falling or mixed, what the last break was, and how much the read depends on the settings you chose.
By the end of this lesson you will be able to look at any chart and say, in plain words, whether it is making higher highs and higher lows, lower highs and lower lows, or neither. You will also know what the last break was, and how much the read depends on the settings you chose.
1. What market structure is
Foundry lesson. Free, no gate. Page: /foundry/market-structure/. Educational interpretation only. Not financial advice.
How to use this lesson at your level
- Beginner: sections 1 to 4 and the traps in section 12. Get the habit of asking "what were the last confirmed swing high and low, and is the sequence rising, falling or mixed?"
- Intermediate: add sections 5 to 7. Breaks judged on closes, the first break against the trend, and how mature a leg is.
- Advanced: sections 8 to 10. Swing length, timeframes, ranges and the popular vocabulary, with their lag and limits.
- Expert: section 11, plus the honest limit in every section. The skill is knowing exactly what a structure read can't see.
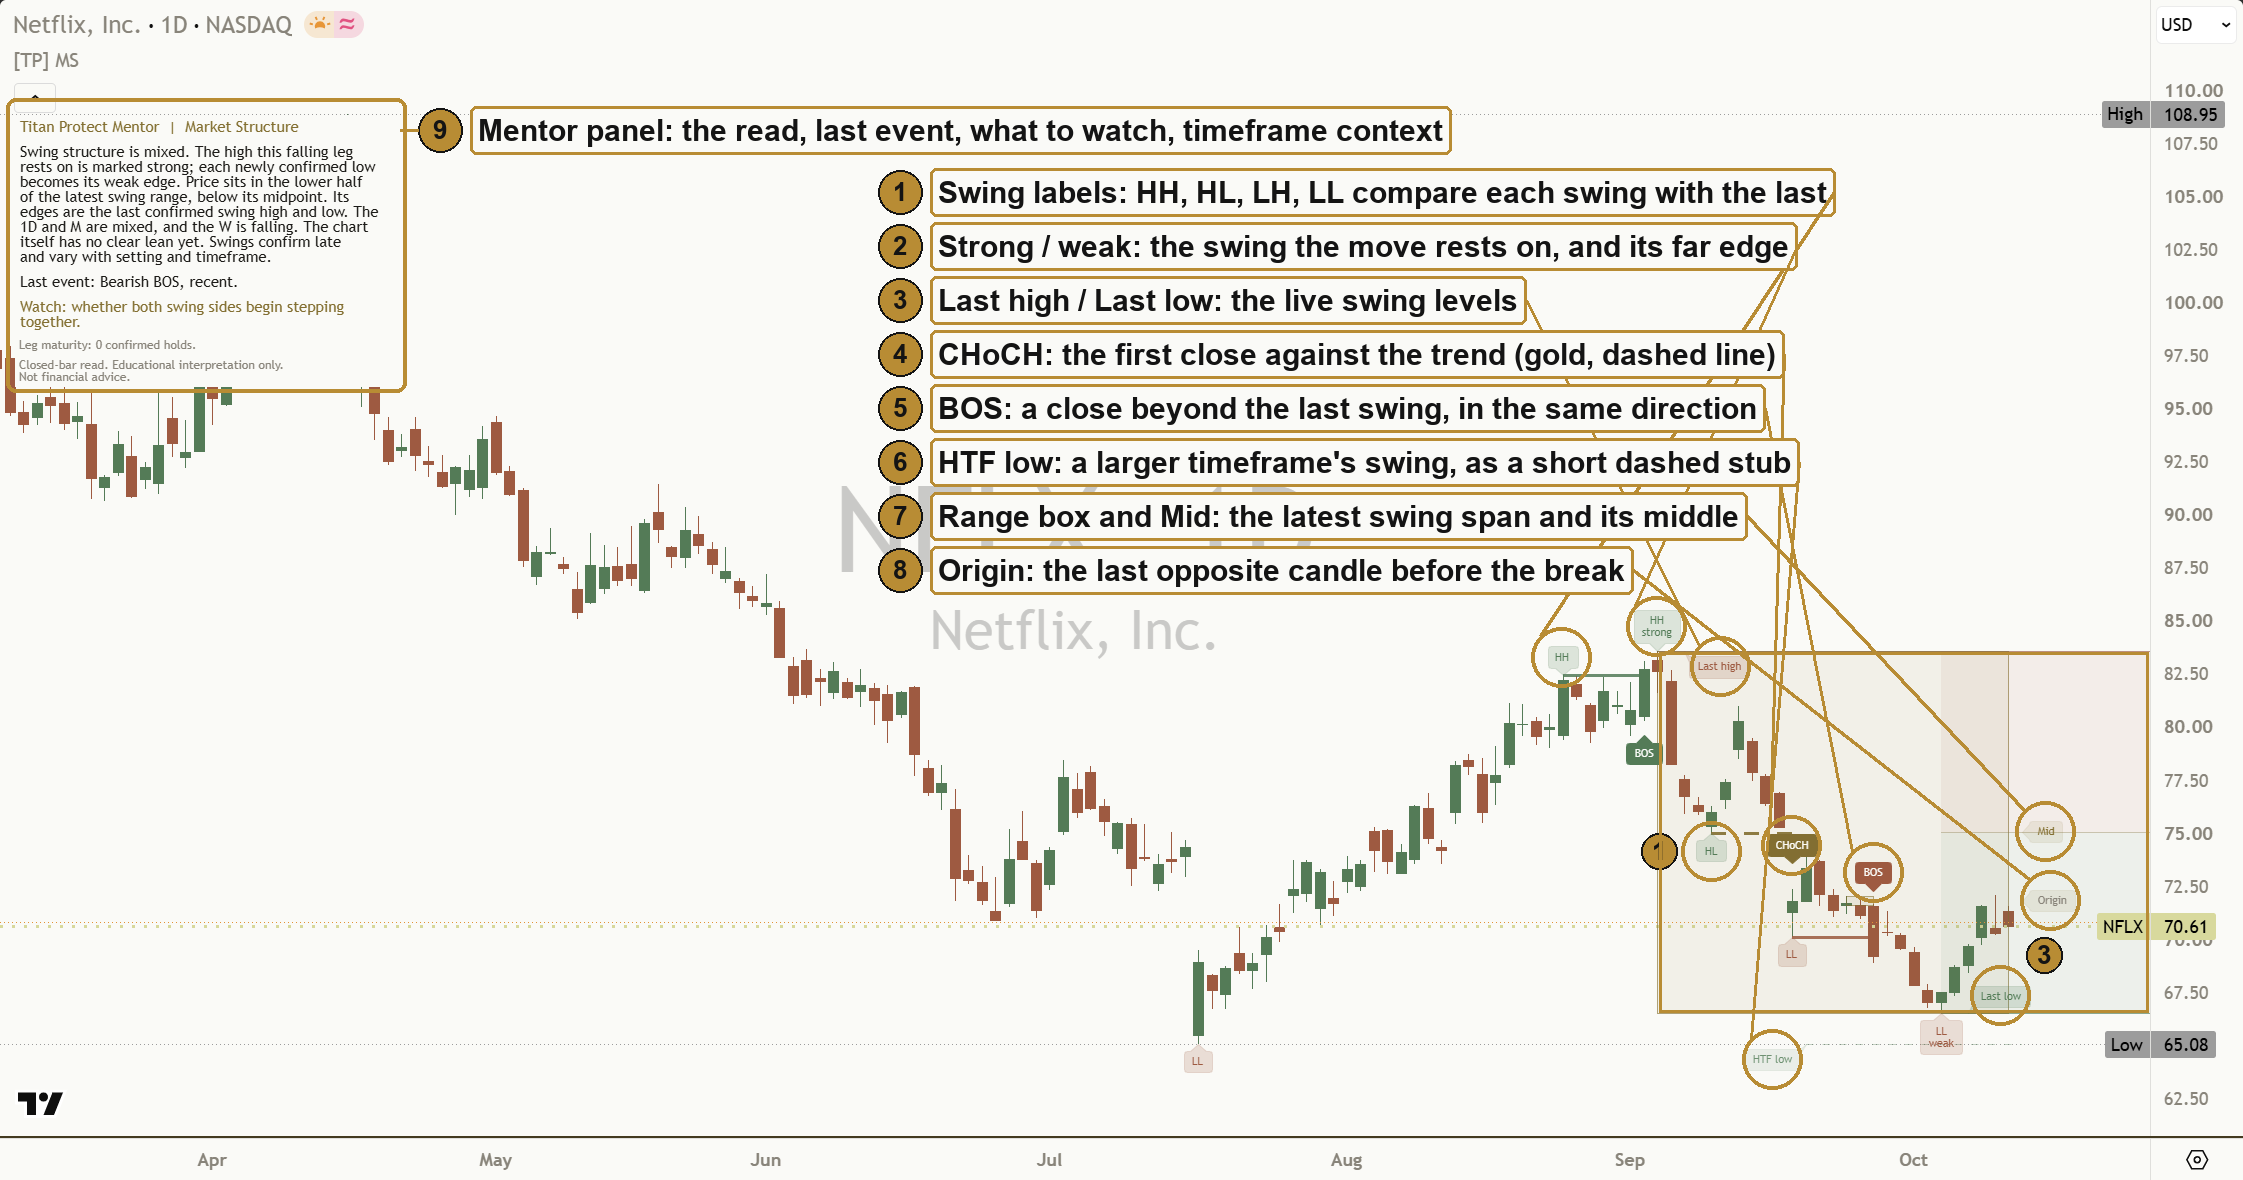
Price doesn't move in straight lines. It moves in swings: a push, a pullback, another push. Look at almost any chart from a distance and you can see them, like a staircase or a zigzag.
Market structure is simply the sequence those swings form. It is the oldest trend definition there is, going back to Dow Theory: a rising market makes higher highs and higher lows, and a falling market makes lower highs and lower lows.
Structure describes what price has done. It is a way of organising the past clearly, so you can talk about it in plain words. It is not a forecast.
Honest limit: two people can draw different swings on the same chart. A rule makes the read consistent, not "correct".
2. Swing highs and swing lows: how a swing is confirmed
A swing high is a bar whose high is higher than the highs of a set number of bars on each side. A swing low is the mirror image: a bar whose low is lower than the lows around it. Some platforms call these pivots or fractals.
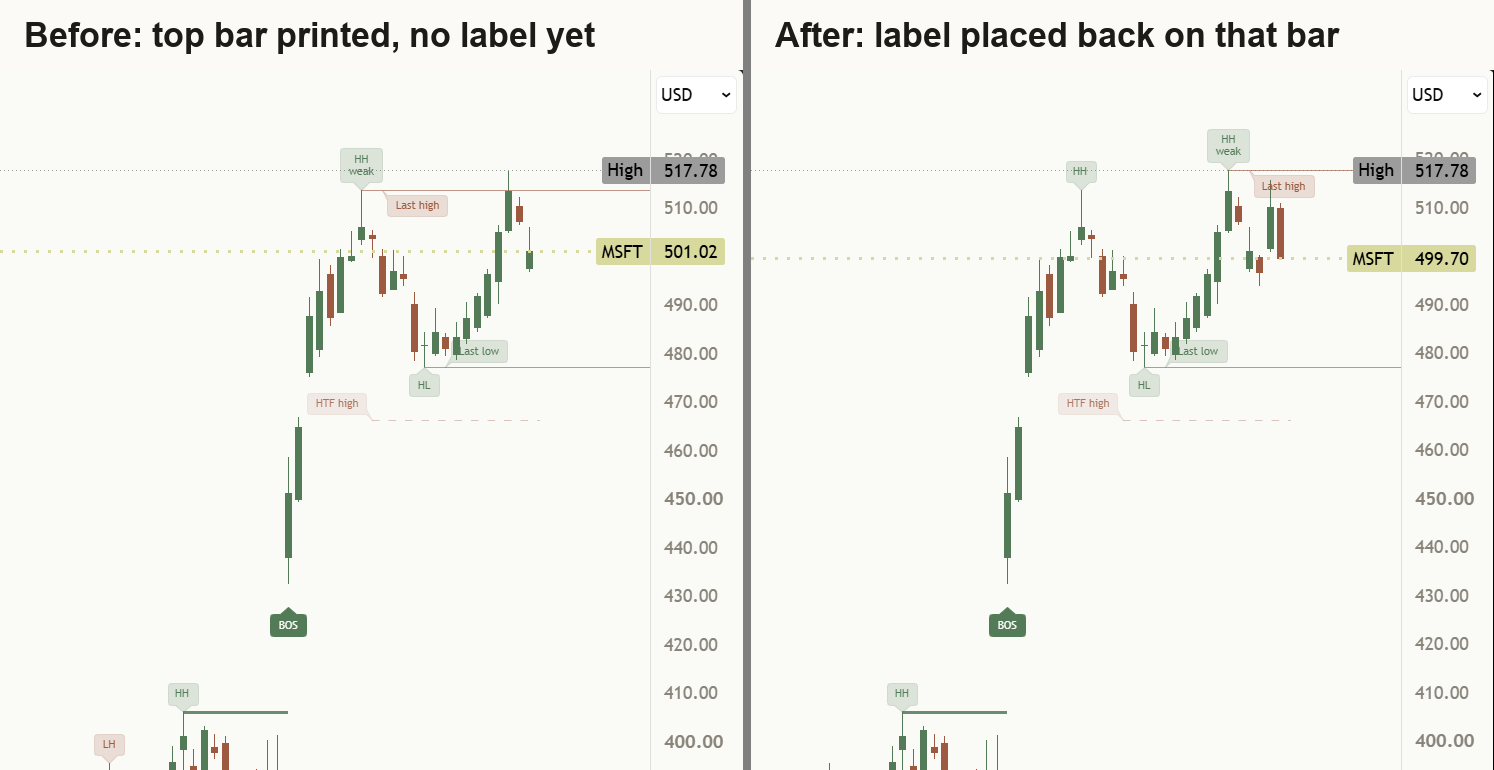
Here is the key point. You can only know a bar was a swing high once enough later bars have printed without going above it. If the rule is 5 bars on each side, the top can only be confirmed 5 bars after it happened. So every confirmed swing arrives late. That is the price of it never moving afterwards.
Every swing tool makes one of two choices:
- confirm swings late and never move them (honest, but late);
- draw them early and redraw them when price moves on (looks quick, but repaints).
What this means for your chart: labels you see on history were each drawn several bars after the swing. On an old chart they look perfectly timed. In real time they never are.
3. The four labels: HH, HL, LH, LL
Each new swing is compared with the previous swing of the same kind:
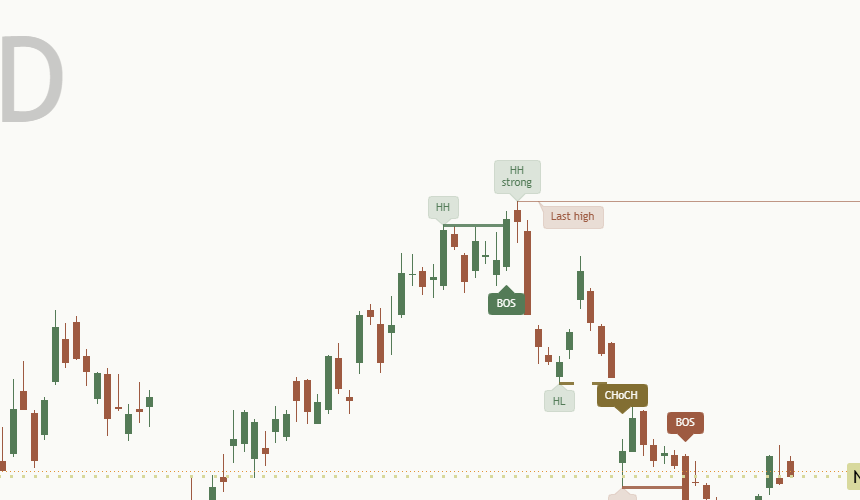
- Higher high (HH) and higher low (HL): each swing high is above the last one, and each swing low is above the last one. A rising sequence.
- Lower high (LH) and lower low (LL): the mirror. A falling sequence.
Mixed sequences are common: a higher high followed by a lower low, or a lower high followed by a higher low. They usually mean there is no clear trend.
Every label compares position only. It says nothing about how big or fast the swing was.
Honest limit: a single higher high doesn't make an uptrend, and a single lower low doesn't make a downtrend. It is the sequence that counts.
4. Three states: uptrend, downtrend, range (and "too early to say")
Put the labels together and you get one of three states:
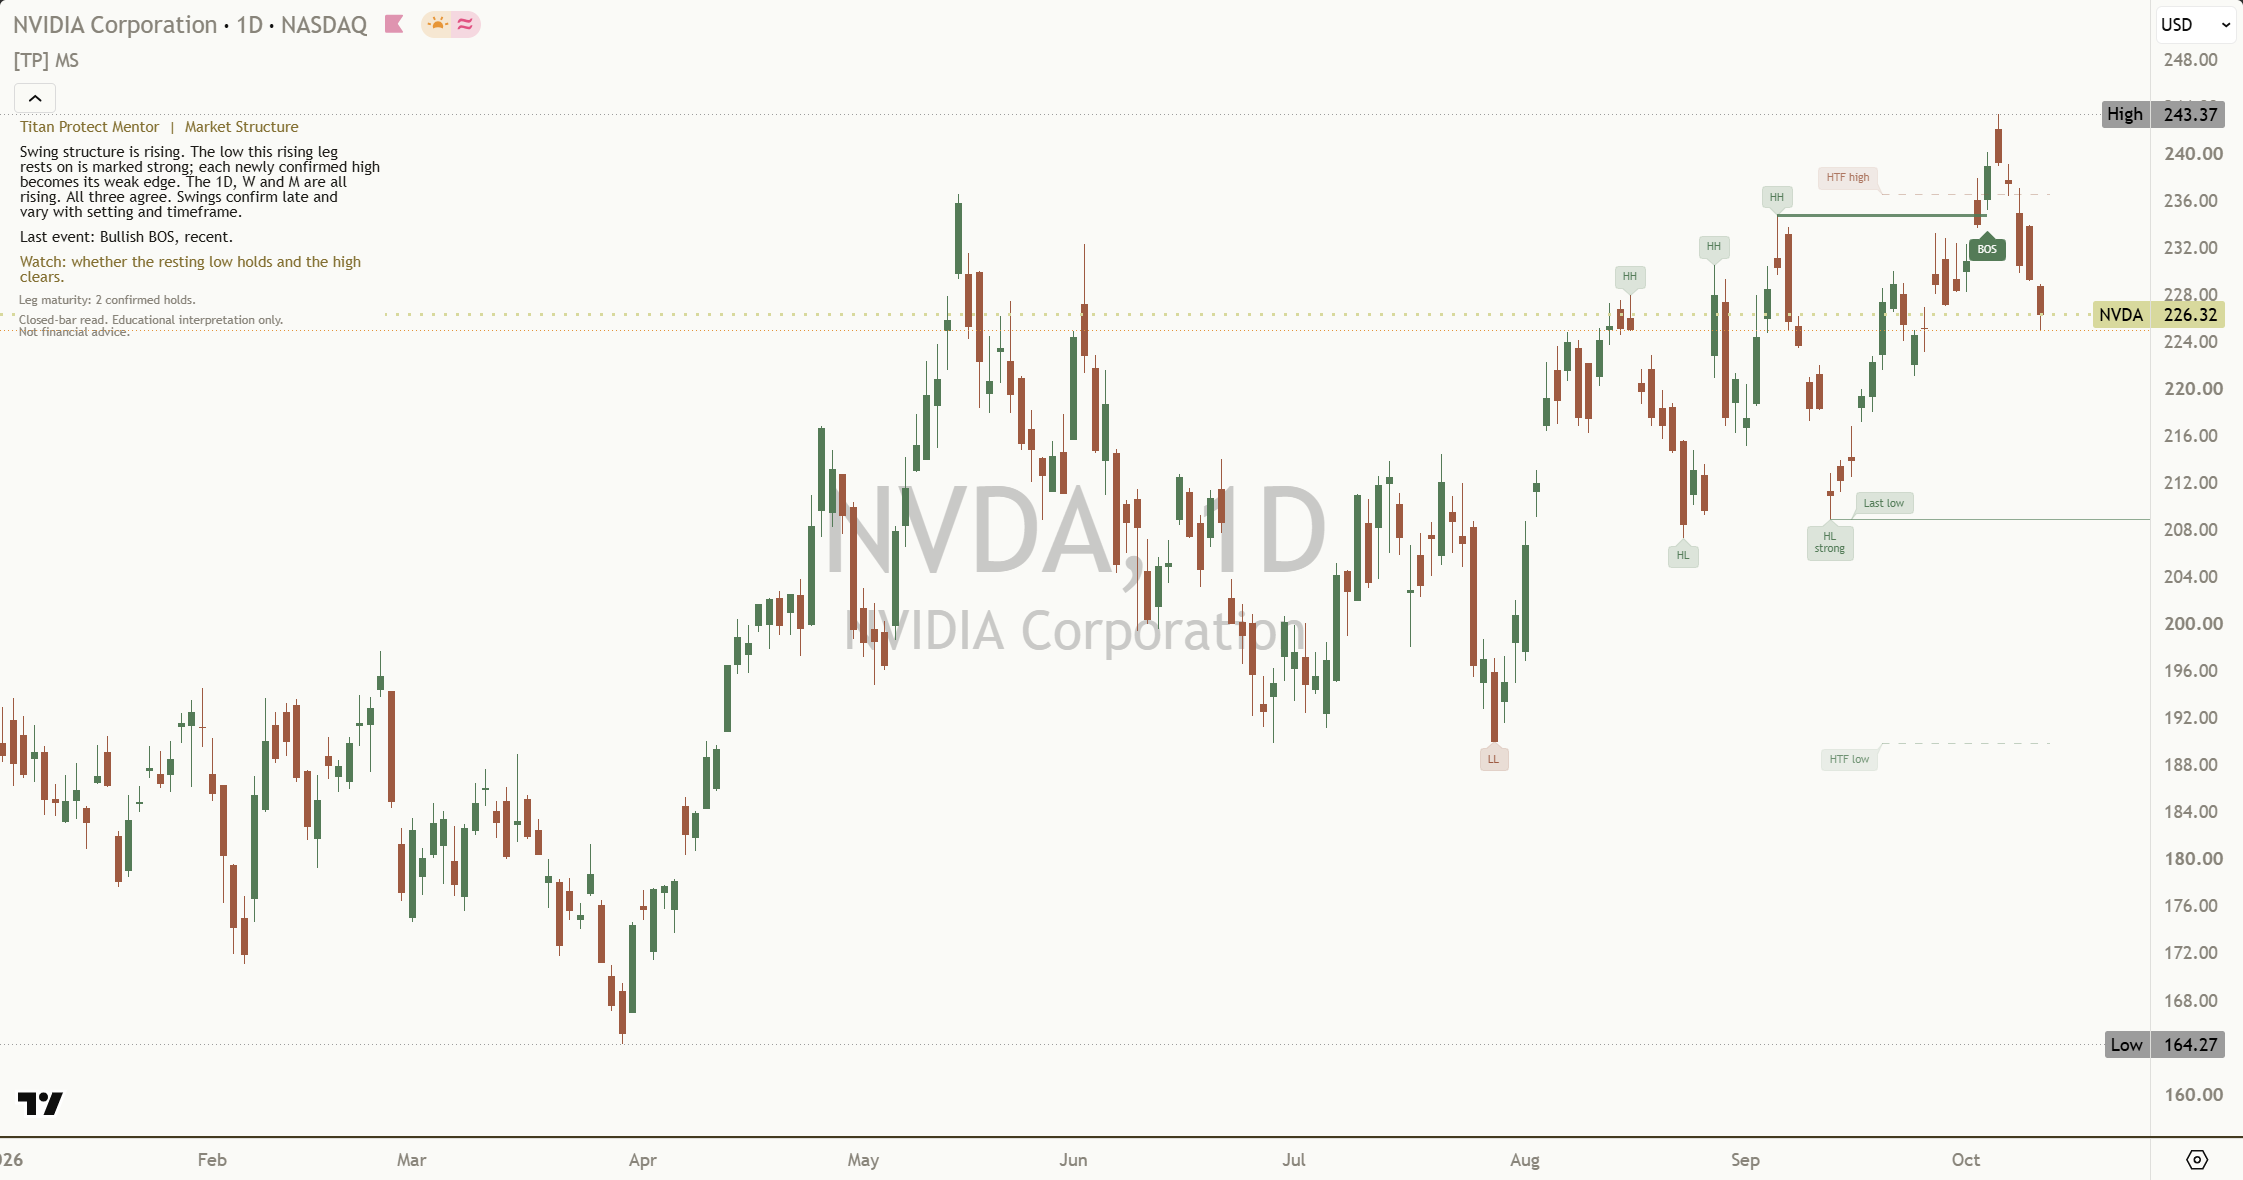
- Uptrend: higher highs and higher lows, with the last break upward.
- Downtrend: lower highs and lower lows, with the last break downward.
- Range: mixed swings, price going back and forth between a recent high and low. This is a real answer, not a failure to find a trend. Markets spend a lot of time here. (See Support and resistance.)
There is a fourth, honest answer too: too little history. With only a handful of confirmed swings there isn't enough to call structure, and a good tool says so instead of guessing.
Honest limit: the state lags. By the time a new trend is confirmed, part of the move has already happened.
5. Break of structure: a close beyond the last swing, in the trend's direction
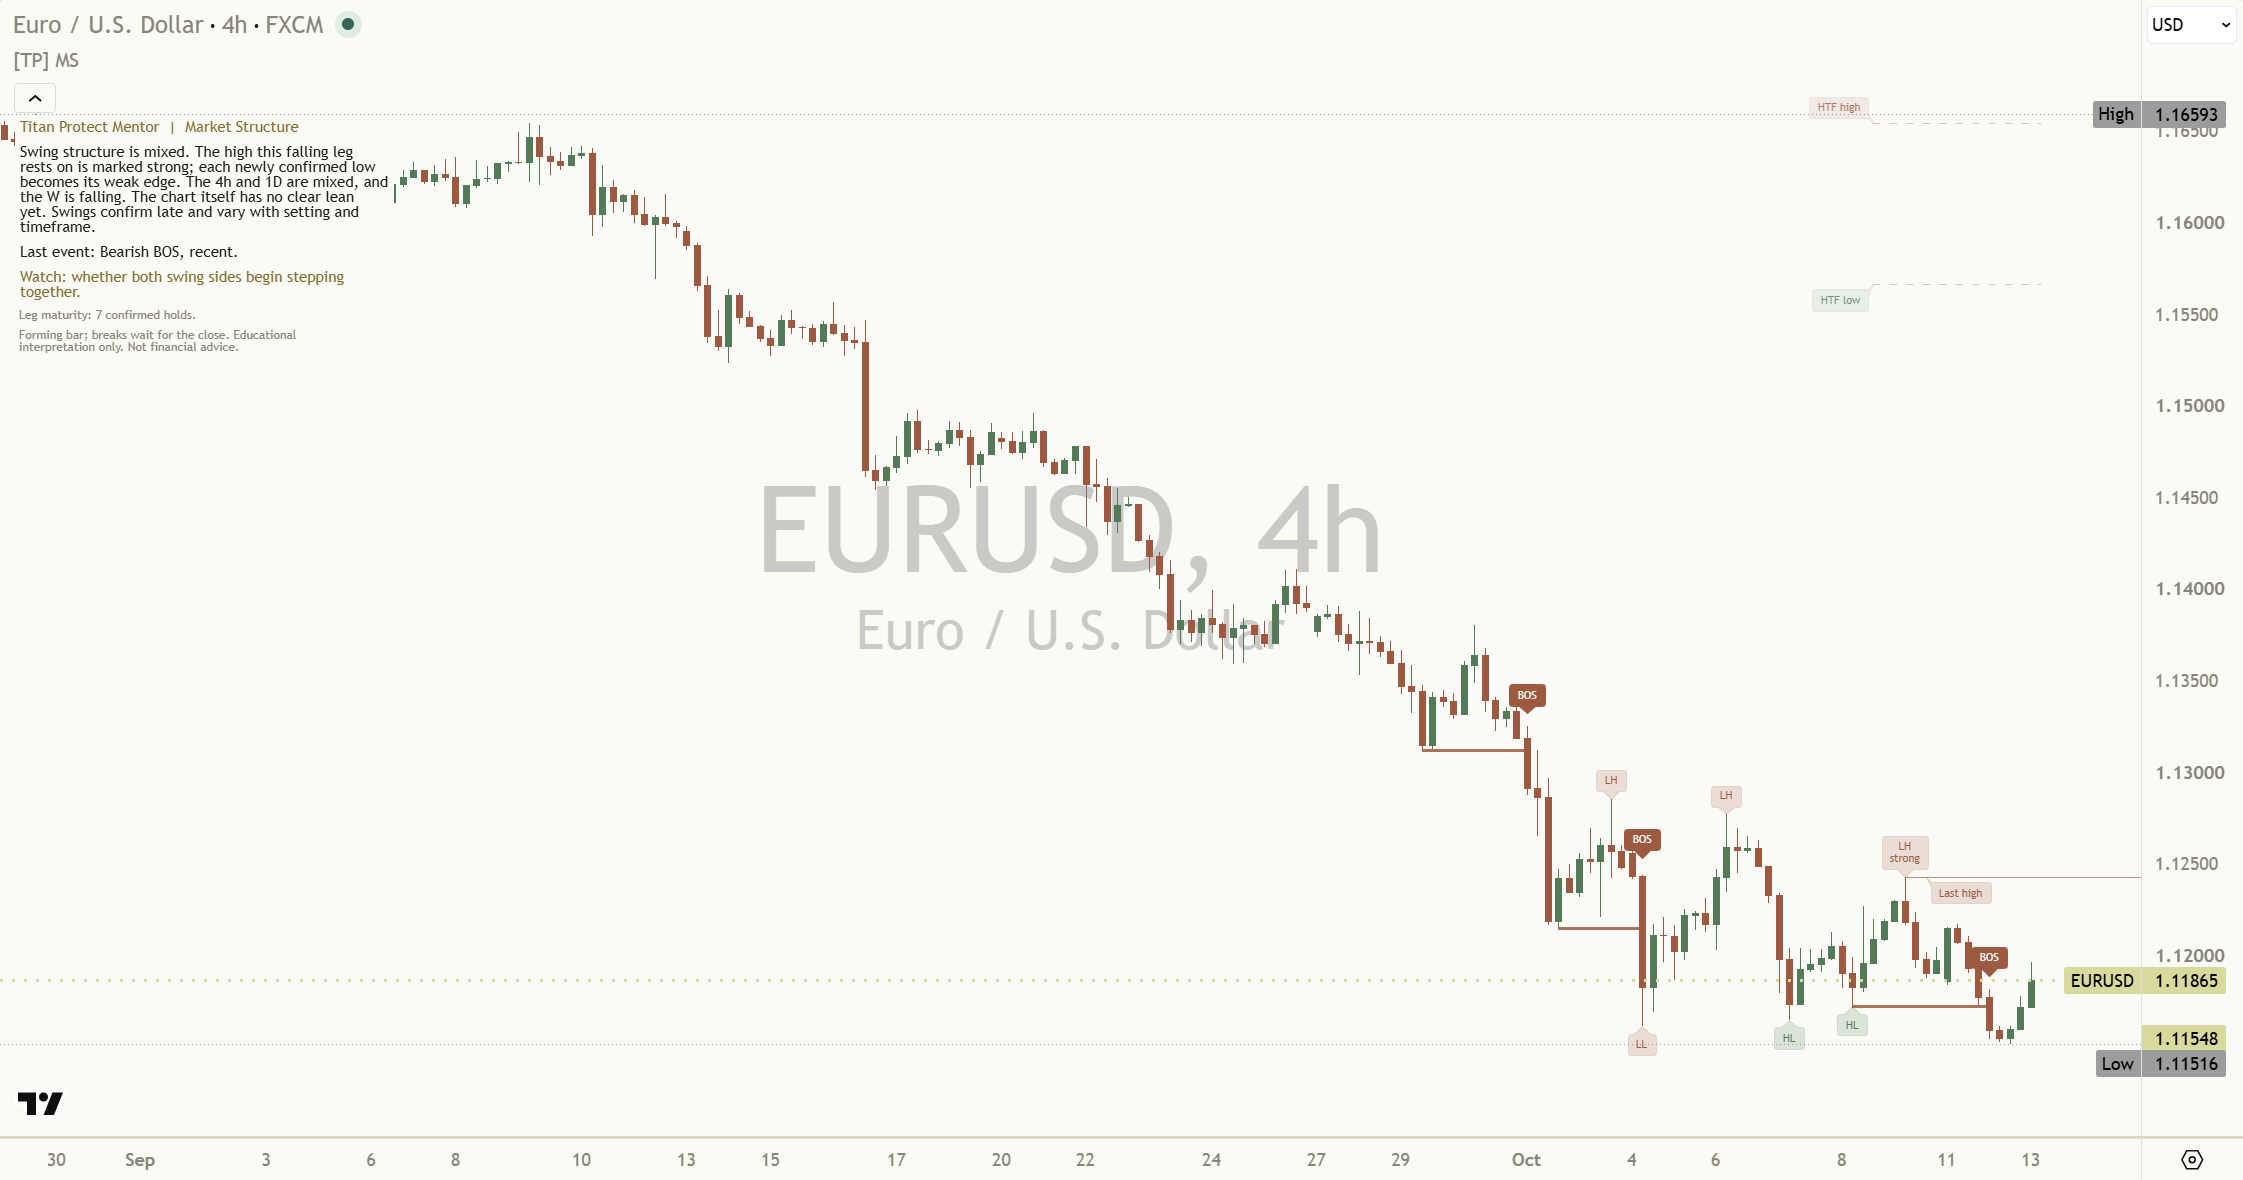
In an uptrend, a break of structure is a close above the last confirmed swing high. In a downtrend, it is a close below the last confirmed swing low. It says the trend extended. (See Breakout trades and Trend continuation trades.)
Close versus wick. A wick through a level that closes back inside is not a break by this definition. It is a test. Judging on closed bars avoids reacting to every spike, at the cost of being a little later.
Honest limit: breaks can fail. A break is a fact about the bar that closed, not a promise about the next one.
6. Change of character: the first close against the trend
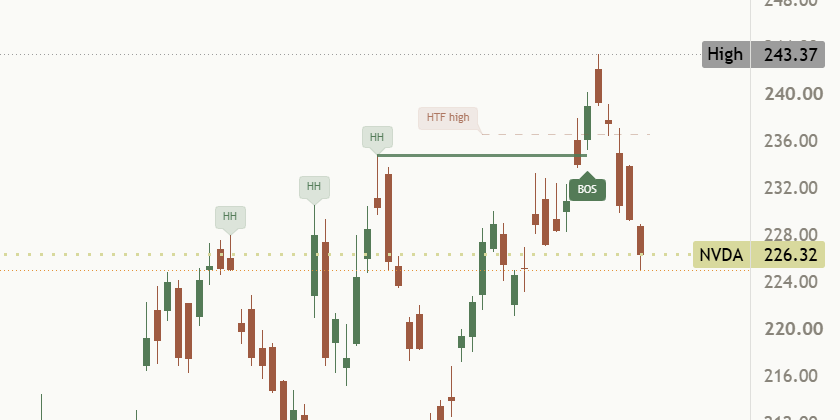
In an uptrend, the change of character is the first close below the last confirmed higher low. In a downtrend, it is the first close above the last confirmed lower high.
It means the old sequence has been interrupted. It does not mean the opposite trend has started. Often a range follows. Sometimes the old trend simply resumes.
What would show it didn't stick: price closing back beyond the swing that started the move.
Honest limit: in choppy markets, changes of character come thick and fast, and many reverse. That is whipsaw, and it is the main weakness of any structure read.
7. Leg maturity: how many swings have held
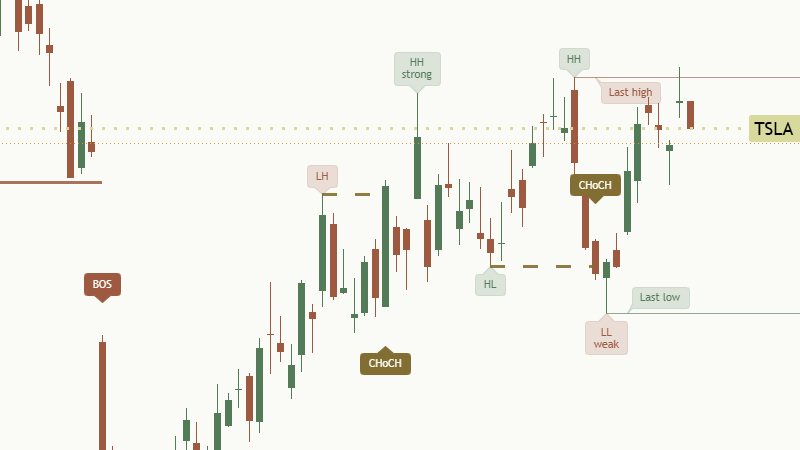
Count the pullbacks that held above the previous swing low in an uptrend, or the bounces that held below the previous swing high in a downtrend. One or two means a young leg. Five or six means a mature one.
Time since the last break matters too. A trend whose last break was long ago, and which is now making smaller swings, is losing its rhythm.
Honest limit: mature doesn't mean finished. Some trends run far longer than looks reasonable. Maturity is context, not a countdown. (See Pullback trades and Trend following.)
Make this count yourself first. The Mentor then lets you check it: it marks the swing the active leg rests on as "strong" and the newest opposite swing as "weak", and its panel keeps a running count, for example "Leg maturity: 3 confirmed holds." (higher lows that held in a rising leg, lower highs in a falling one, since the leg began). Before any directional leg it says "Leg maturity: waiting for a directional leg."
8. Swing length and timeframe: why two charts disagree
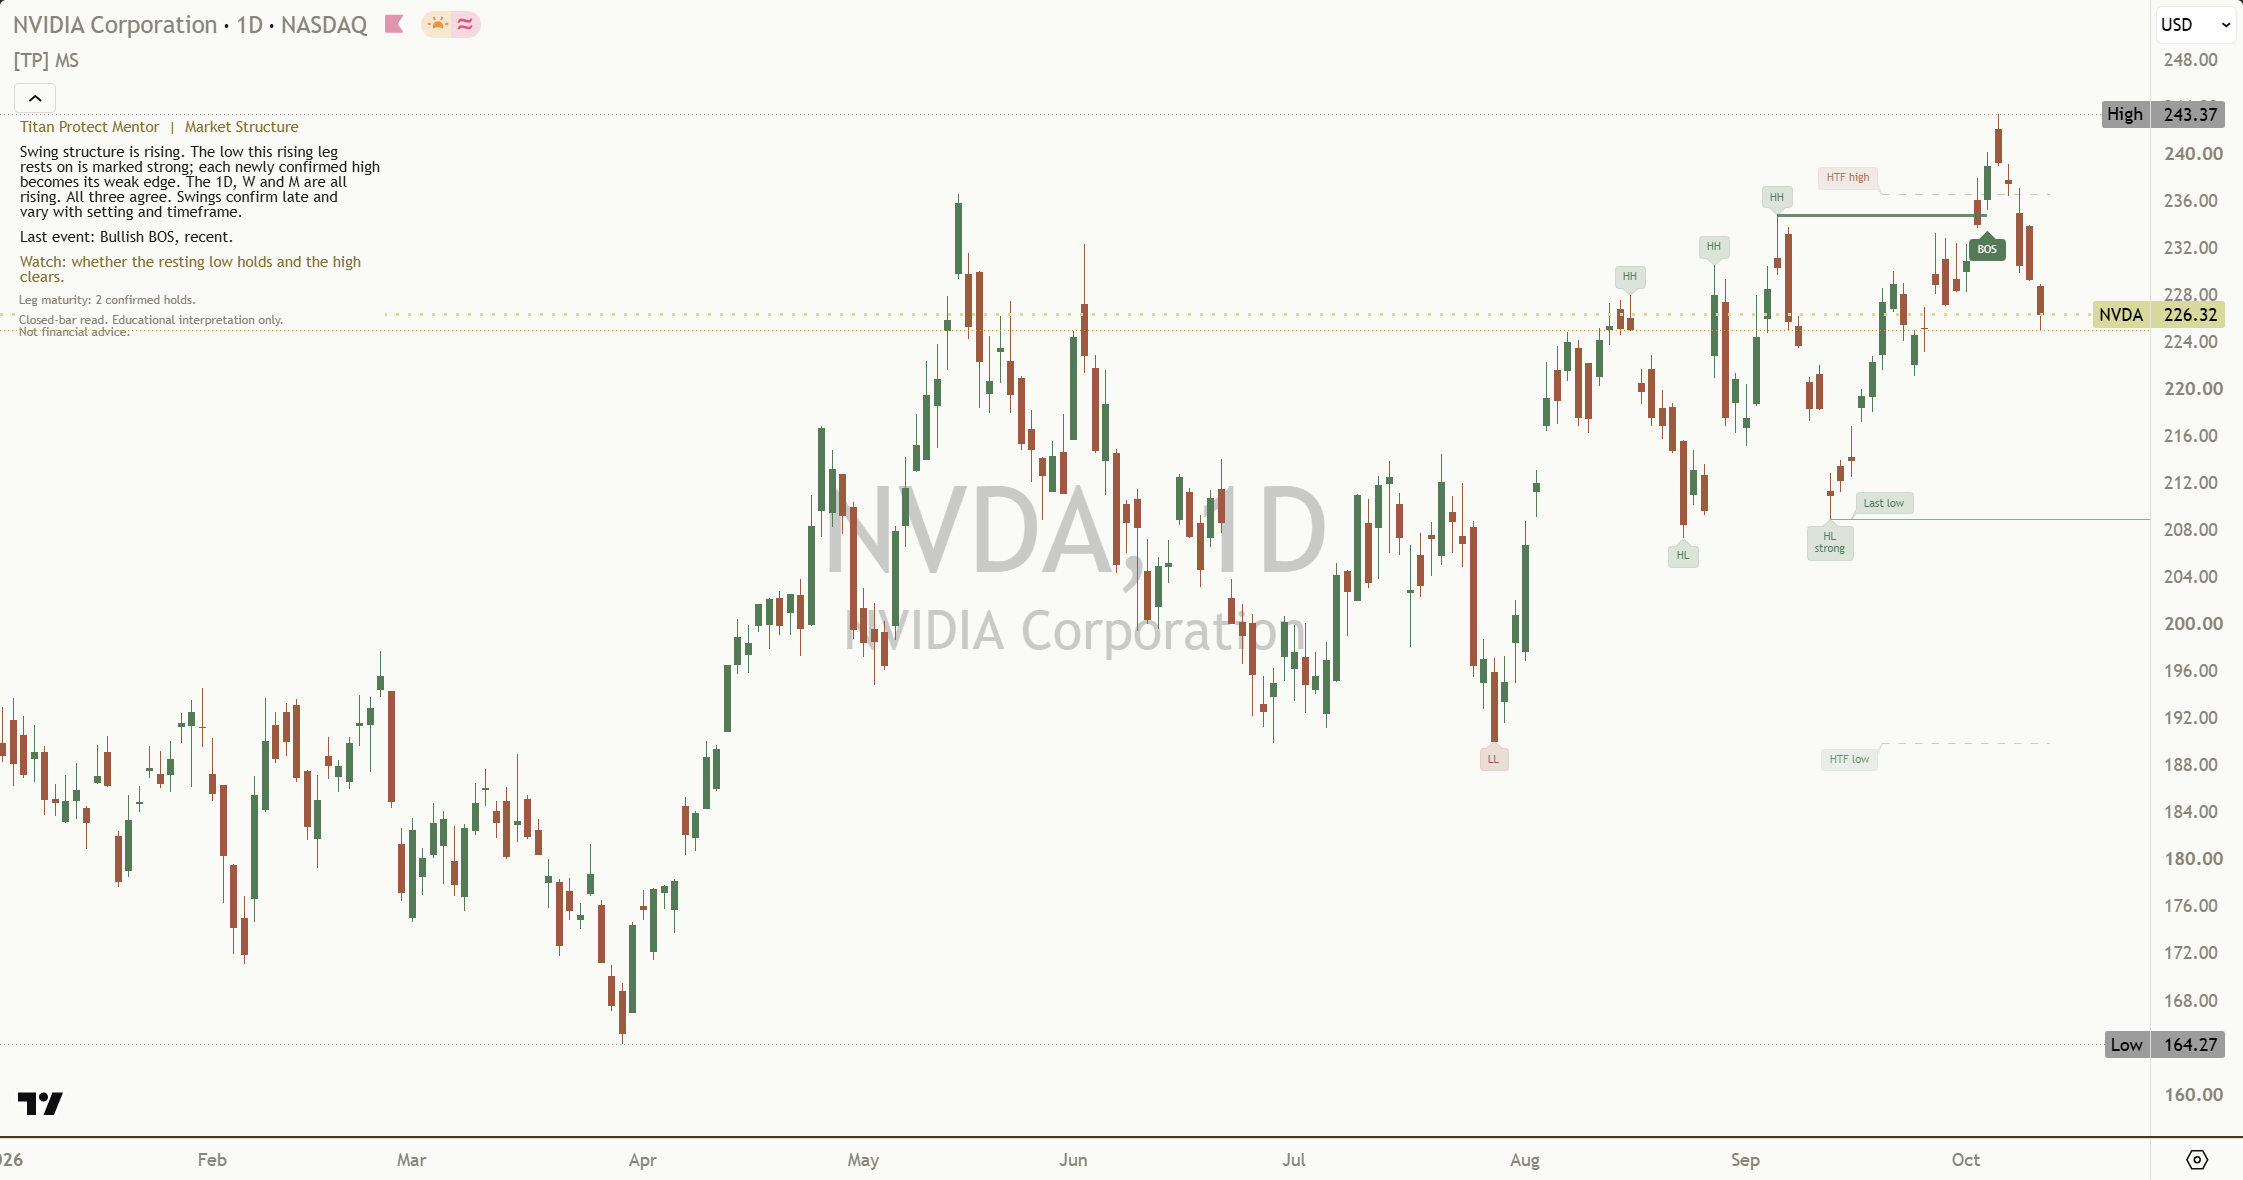
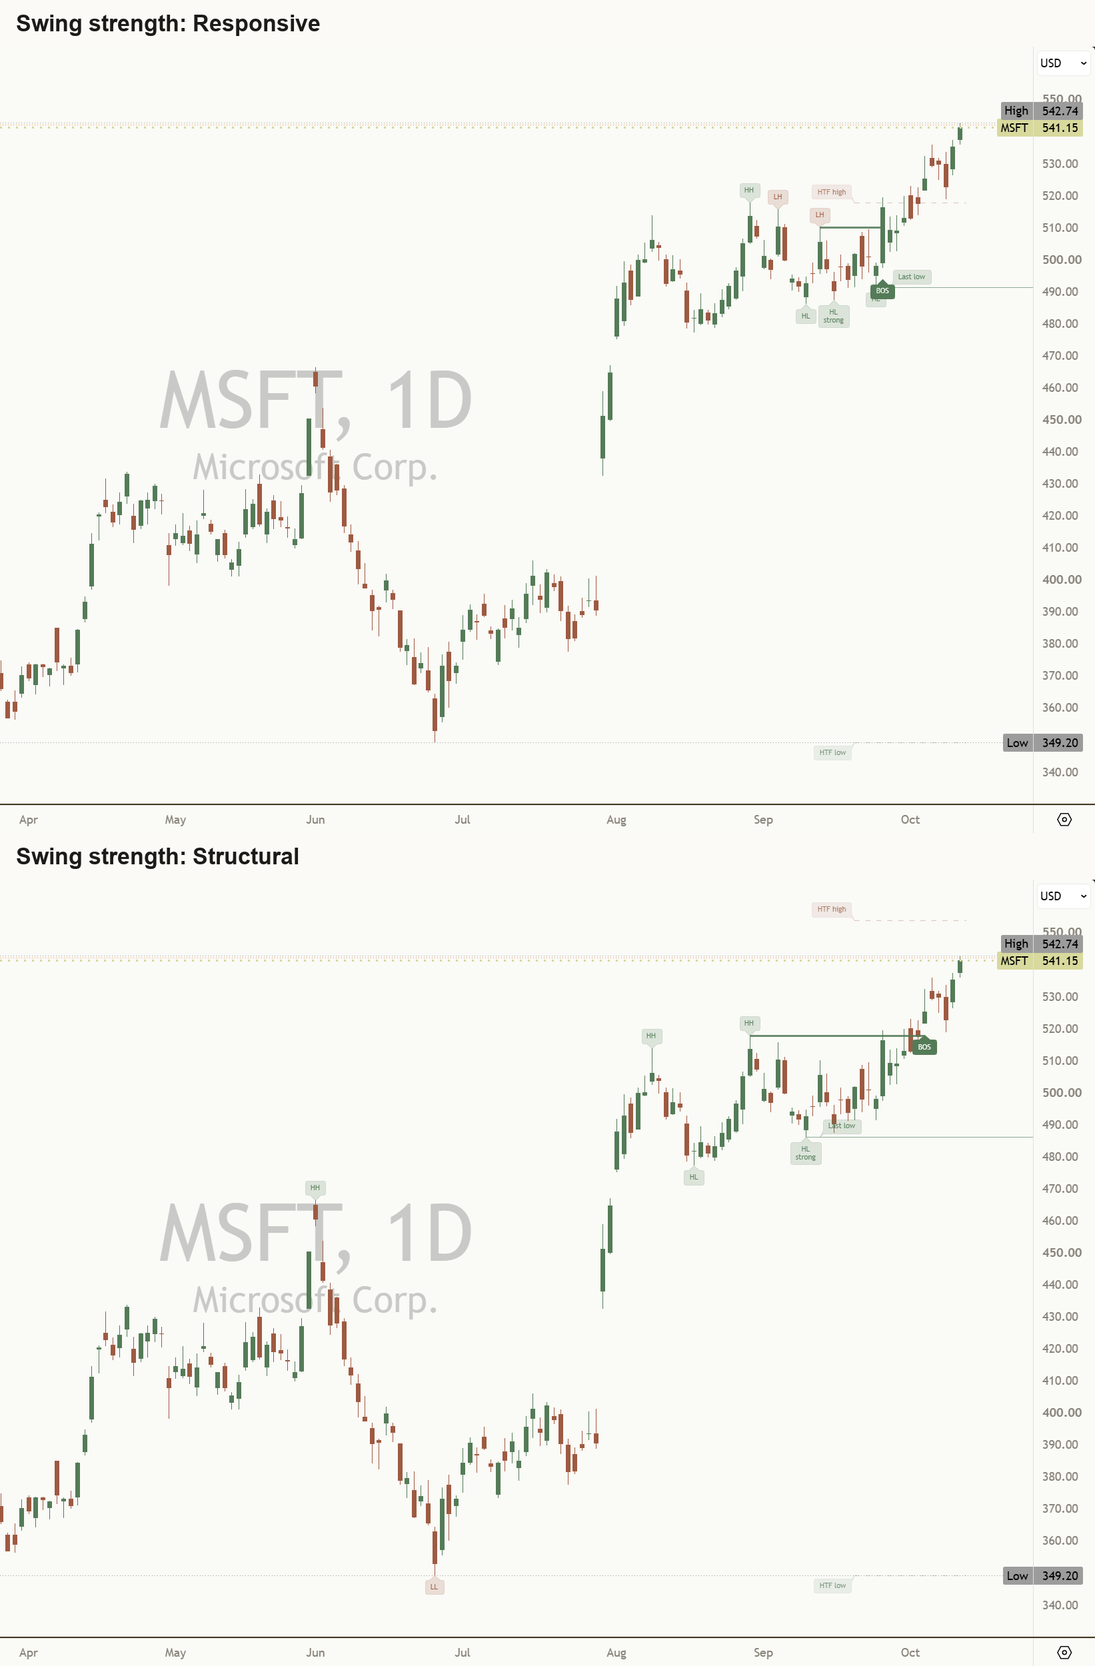
A short swing length (2 or 3 bars on each side) finds many small swings. A long length (10 or more) finds only the big ones. The same chart can read uptrend at one setting and range at another. Neither is wrong. They answer different questions.
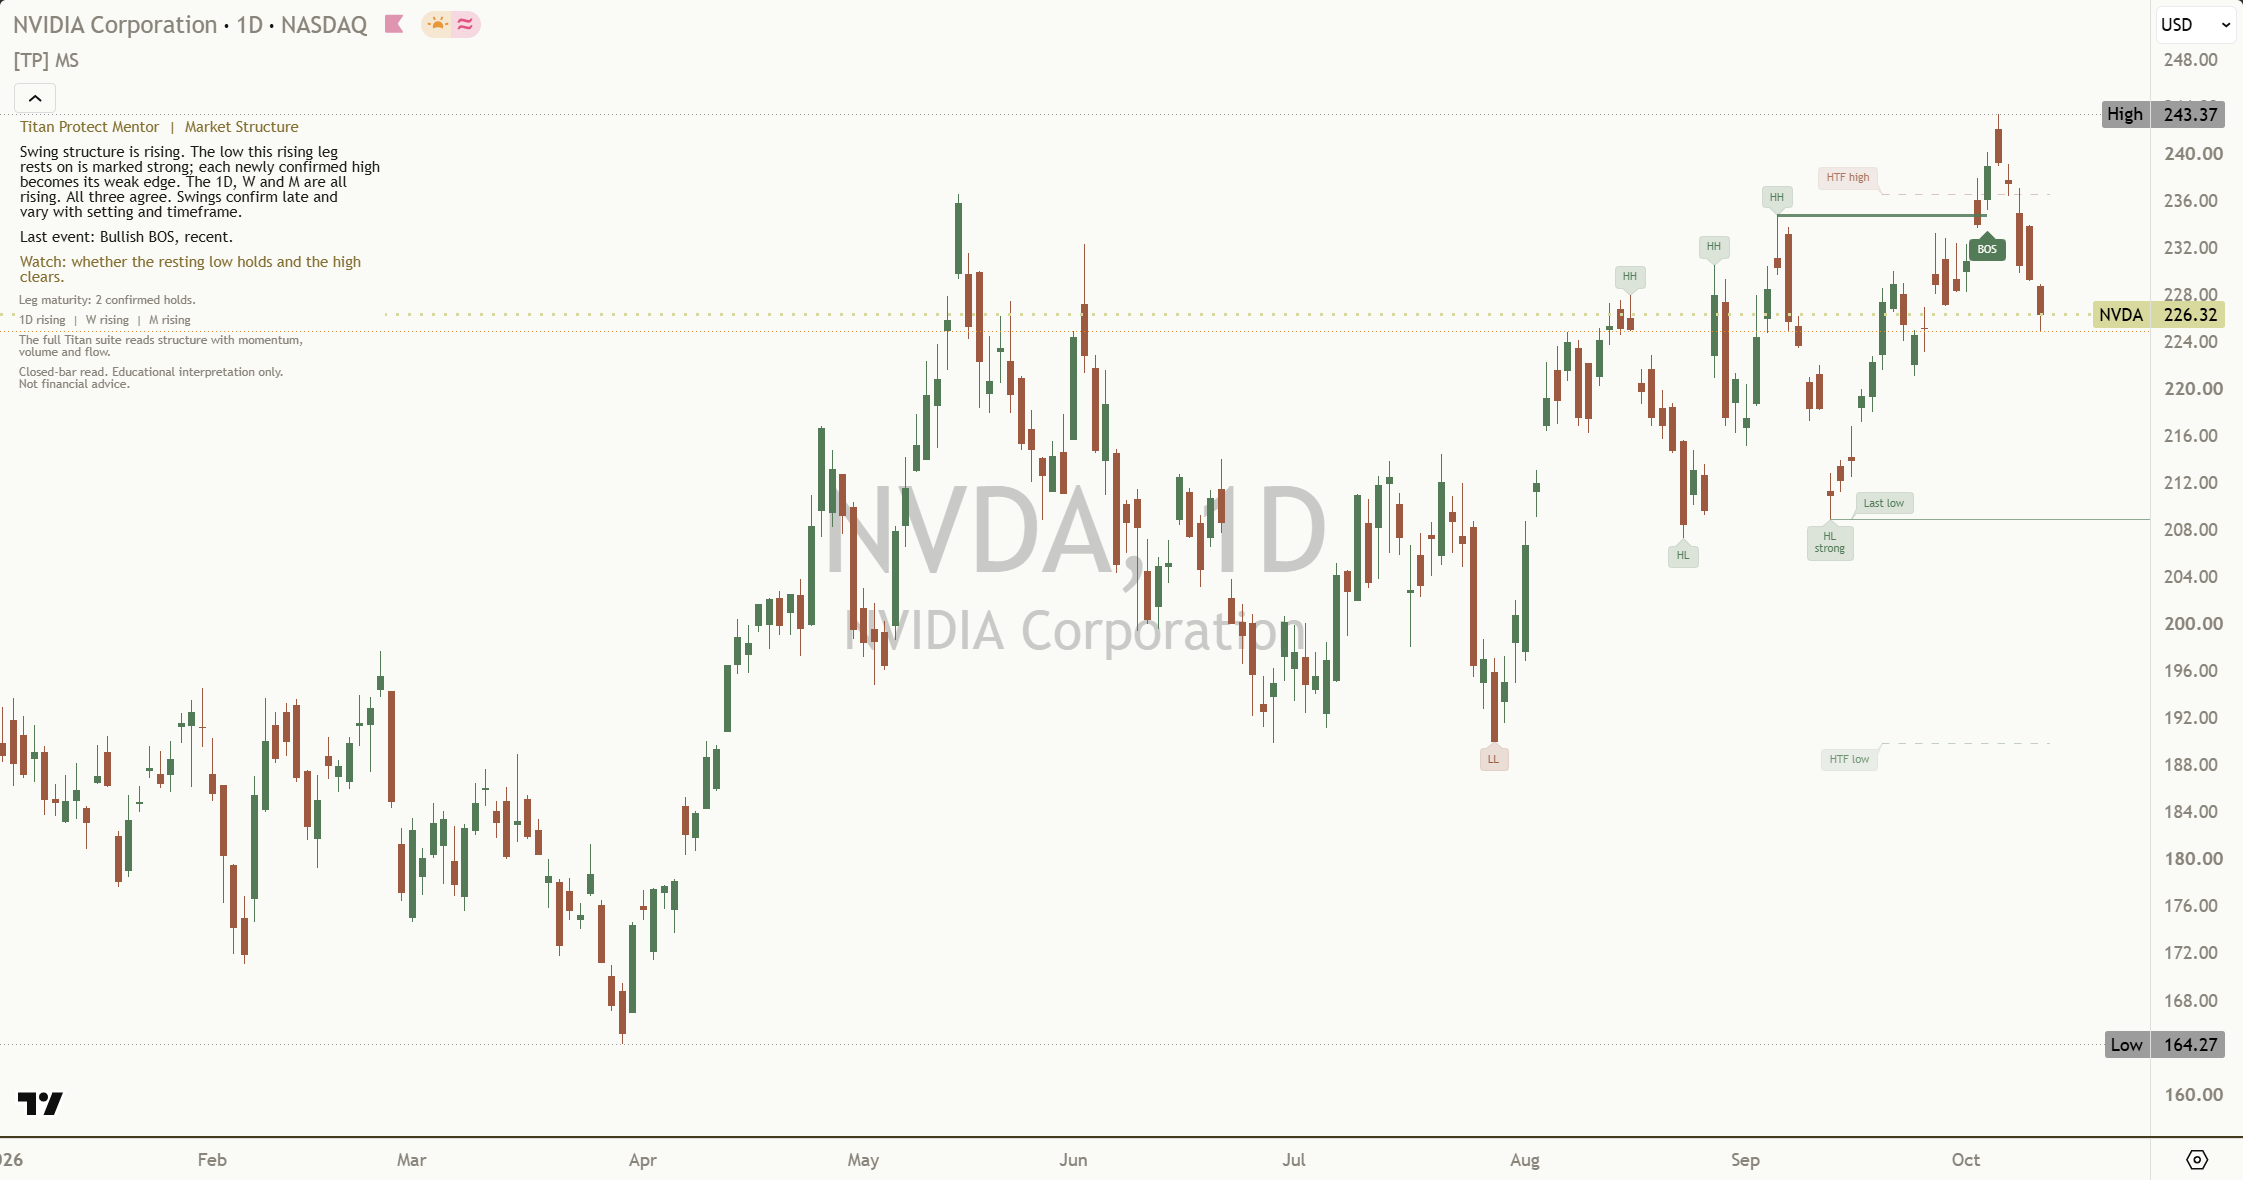
Structure is nested. A downtrend on the 15 minute chart can sit inside an uptrend on the daily. Some traders read the higher timeframe first for context, then the lower one for detail. (See Swing trading.)
When the timeframes disagree. When the chart runs against a larger timeframe, it is either a pullback within that larger picture or an early turn; the chart's own structure, a CHoCH followed by a BOS in the new direction, is what shows which. The Mentor's panel only says the move is "running against" the larger picture; it does not say which of the two it is.
Honest limit: there is no "right" length. Pick one that fits the swings you care about, and keep it, so your reads stay comparable.
9. Ranges: the box, its halves, and equal highs and lows
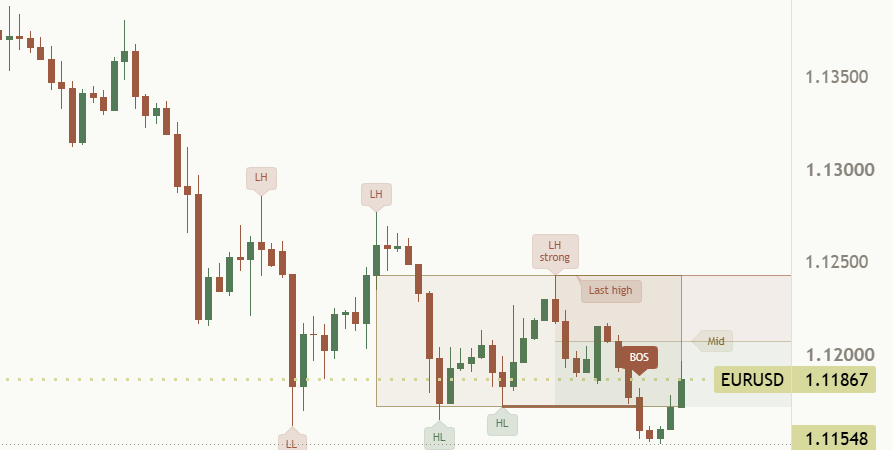
When no trend is in force, the recent swing high and low form a range box.
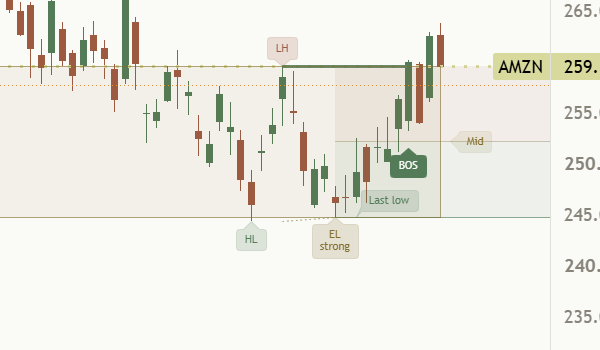
The upper and lower half of the range. Some traders call these "premium" and "discount". It is only a way to say where price sits within the recent range, nearer the high or nearer the low. It is not a judgement of value.
Equal highs and equal lows are two or more swings at almost the same price. Some traders watch them because many people can see the same level. Whether price respects them or closes through them is not known in advance. (See Trend lines.)
Honest limit: ranges end, and the box only tells you where the edges have been.
10. Popular labels you will meet, translated neutrally
Many free scripts use a dense shorthand. Here it is in plain words:
- BOS = break of structure. MSB (market structure break) is often the same idea.
- CHoCH = change of character. MSS (market structure shift) is often the same idea.
- Internal or minor versus swing, external or major structure = the same reads at a shorter and a longer swing length.
- EQH and EQL = equal highs and equal lows.
- Premium and discount = the upper and lower half of the current range.
- BU and BE = bullish and bearish, the direction tags other scripts put on their marks, and strong and weak only describe which swing the current leg rests on; this indicator writes the words out in the panel instead of using abbreviations.
Zone-based ideas about who moved price are popular, and some traders layer them on top of structure. They come with strong stories about who is behind a move, and those stories are not something a chart can confirm. This lesson sticks to what the price sequence itself shows.
11. Honest limits, all in one place
- Lag: confirmed swings arrive late, and states lag further.
- Sensitivity: the read changes with swing length and timeframe.
- Whipsaw: in ranges, breaks and changes of character flip often.
- Wick versus close: different definitions give different breaks on the same chart. Know which one your tool uses.
- Gaps and thin data: on markets with gaps or very little history, swings are less reliable.
- Neither direction is favoured: every rule works the same for rising and falling markets.
12. Six common traps
- Reading a single higher high or lower low as a new trend. It is the sequence that counts.
- Forgetting labels arrive late, then judging a tool by how perfect old labels look.
- Treating a wick through a level as a break. Check the close.
- Treating a change of character as a guaranteed reversal. It often leads to a range.
- Forcing a trend on a ranging chart. "Range" is a valid answer.
- Comparing reads made at different swing lengths or timeframes as if they should agree.
13. Practise it
- Pick one market and one timeframe, and keep them for a few weeks.
- Use bar replay. Before each step, say out loud: what were the last confirmed swing high and low? Is the sequence rising, falling or mixed? Then step forward.
- Mark every change of character over a few months, and note which led to a new trend, which to a range, and which reversed.
- Try two swing lengths on the same chart, and write down where the reads disagree, and why.
- Keep a one-line log per observation.
Key takeaways
What to remember
- Structure is the sequence of swing highs and lows. Rising, falling or mixed.
- A confirmed swing arrives late by design. That's why it never moves.
- Breaks are judged on closes. A break of structure extends the trend. A change of character interrupts it.
- "Range" and "too little history" are honest answers.
- The read depends on swing length and timeframe. Pick one and be consistent.
- Popular labels are shorthand for the same few ideas. Read them neutrally.
14. See it explained live: [TP] Market Structure - Mentor
Everything in this lesson is built into [TP] Market Structure - Mentor, a free indicator on TradingView. It draws each idea on your chart and talks you through it in plain English, so you can practise reading structure on live markets instead of from memory.
Here is where each part of the lesson shows up:
- Swings and labels (sections 2 and 3). HH, HL, LH and LL on confirmed swings, placed on the swing bar but drawn only once 5 bars on each side have printed (the default Balanced setting). They never move afterwards. The first swing high and low are marked SH and SL. The latest confirmed high and low are drawn as two quiet lines, labelled two bars to the right of the swing: "Last high" just below its line and "Last low" just above its line.
- State (section 4). The panel says "Swing structure is rising.", "Swing structure is falling." or "Swing structure is mixed.", and "Waiting for enough confirmed swings." when there aren't enough yet. The panel sits on the price chart itself, with no separate pane, at the top left by default, just below TradingView's own legend; it can be moved to any of nine positions, and its text size can be changed with the Panel text size setting.
- Breaks (sections 5 and 6). A BOS tag and a solid line for a break of structure, a gold CHoCH tag and a dashed gold line for a change of character, both on closed bars only. The panel names the last event and how recent it is, for example "Last event: Bearish CHoCH, recent." While a bar is open it says "Forming bar; breaks wait for the close."
- The leg (section 7). After a break, the swing the active leg rests on is marked "strong" on its label, and each newly confirmed swing at the opposite edge is marked "weak". The panel explains it in one sentence, for example "The low this rising leg rests on is marked strong; each newly confirmed high becomes its weak edge.", and a leg maturity row counts the swings that have held, for example "Leg maturity: 2 confirmed holds."
- Swing length and timeframe (section 8). Swing strength presets (Responsive 3, Balanced 5, Structural 10, or Custom), and higher-timeframe context, on by default: short dashed stubs on the latest bars, from a completed higher-timeframe bar one step above the chart (15m and 30m read 1h, 1h reads 4h, 4h reads 1D, 1D reads W), named at the stub's left end: "HTF high" above its line and "HTF low" below it. A stub that sits within 0.25 ATR of the chart's own Last high or Last low is left out. A second context state, on by default, adds a Daily anchor: the 1D on charts below 1D (or the W when the first higher timeframe is already the 1D), M on a 1D chart and 3M on a W chart. The read then groups the timeframes into one sentence and a short summary, for example "The 4h is falling, the 1D is mixed, and the W is rising. The short-term move is running against the W picture." or "The 1D and M are mixed, and the W is falling. The chart itself has no clear lean yet." (section 8 explains what "running against" can mean). In the Full view the panel adds a compact state row, for example "15m mixed | 1h rising | 1D rising", "4h falling | 1D mixed | W rising" or "1D mixed | W falling | M mixed". An optional internal structure scale adds a faster read underneath.
- Ranges (section 9). Optional range box while swing structure is mixed, "Show premium / discount" shading of the upper and lower halves with a "Mid" line named in the right margin (with "Origin" for the optional break-origin zone; when the two names sit within 0.60 ATR only "Mid" keeps its name, and a name within 0.35 ATR of the current price is hidden), and equal highs and lows labelled EH and EL and marked by a gold dotted line. All free, all off by default.
- The plain-English panel, on the chart at the top left. The read, the last event and how recent it is, where price sits in the range only when the range box or premium / discount halves are drawn (for example "Price sits in the upper half of the latest swing range, above its midpoint."), whether the chart timeframe agrees with the higher timeframes, one thing worth watching next, such as "Watch: whether the resting low holds and the high clears.", and the leg maturity row. A single footer line reads "Closed-bar read. Educational interpretation only. Not financial advice." In the Full panel style it also says "Swings confirm late and vary with setting and timeframe." It describes; it never instructs.
- Views. Simple is the default. Standard adds small dots at confirmed swings when swing labels are off. Full adds the timeframe state row and a short note on the full suite. The modules work in every view. Simple is the clean default the chart opens in, and every optional module stays off until you switch it on.
- Easier to read. Line width (1 to 4, default 1) thickens the structure lines, stubs and history lines to make them easier to see; the BOS and CHoCH lines are already width 2 at the default. Label size (Tiny by default, Small or Normal) makes the swing labels, the BOS and CHoCH tags, the internal labels and the Last high and Last low labels larger and easier to read, while the HTF high, HTF low, Mid and Origin names always stay Tiny, and the panel has its own Panel text size.
- Alerts. Six descriptive alerts: Upward BOS, Downward BOS, Upward CHoCH, Downward CHoCH, Any structure event, and Structure state persisted (which waits for the state to hold for a set number of bars). They say what happened, for example "Market Structure Mentor: close-confirmed downward CHoCH." They never tell you what to do. Set one from TradingView's alert dialog: choose the indicator, then choose the condition, and the alert names what happened.
- Settings. The defaults are a sensible starting point, so it is fine to leave them and change only the look.
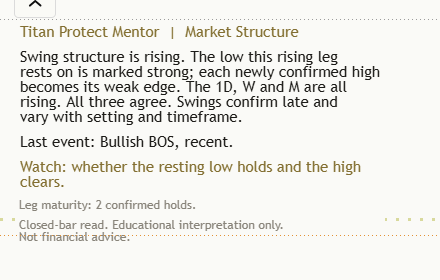
A good way to use it: turn on bar replay, add the Mentor, and read each swing yourself first. Then check your read against the panel. Where you disagree is where you learn.
Test yourself
Take the 16-question quiz below to check what stuck.
Question 1 of 16 · Beginner
What does market structure describe?
Question 2 of 16 · Beginner
A chart shows swing highs at 100, 104 and 109, and swing lows at 95, 99 and 103. What is the plainest description?
Question 3 of 16 · Beginner
Swing highs come in at 50, 47 and 44, and swing lows at 45, 42 and 39. Which labels fit the latest swings?
Question 4 of 16 · Beginner
Why does a swing label appear a few bars after the top or bottom it marks, and does it move afterwards?
Question 5 of 16 · Beginner
On scripts that tag their marks with BU and BE, what do those two letters mean?
Question 6 of 16 · Beginner
When the Mentor marks a swing "strong", what is it describing?
Question 7 of 16 · Beginner
If the lines and labels on your chart are too thin to read comfortably, what can you change?
Question 8 of 16 · Beginner
How do you get notified when the Mentor confirms a break of structure or a change of character?
Question 9 of 16 · Intermediate
In an uptrend, a bar's wick pokes above the last swing high, but the bar closes back below it. Under a close-based rule, what happened?
Question 10 of 16 · Intermediate
In a downtrend, price closes below the last confirmed swing low. What is that called?
Question 11 of 16 · Intermediate
An uptrend has made higher lows for some time. Then a bar closes below the last confirmed higher low. What is the most accurate reading?
Question 12 of 16 · Advanced
One trader uses a swing length of 3, another uses 10, on the same chart. One reads "uptrend", the other "range". Who is right?
Question 13 of 16 · Advanced
A downtrend has printed five lower highs in a row, and its last break was a long time ago. Swings are getting smaller. What does that describe?
Question 14 of 16 · Advanced
Price sits in the upper half of a clear range. Some traders call this area "premium". What does that term describe?
Question 15 of 16 · Expert
On an old chart, every swing label sits exactly on the top or bottom, and every change of character looks perfectly timed. What is the honest way to judge this?
Question 16 of 16 · Expert
In a choppy market, three changes of character flip the read from down to up and back within a few days. What is the best description?
Educational interpretation only. Not financial advice. Market structure describes what price has done; it does not predict what price will do next.
Learn the idea here. Apply it with the desk.
Titan Protect turns lessons like this into a daily practice: live market research, the full framework, and the tools that put it to work. This lesson is free; the desk is where it compounds.