Trend lines and channels: drawn where price touched, judged when they were known
Look at any chart and say, in plain words, where its trend line runs, whether that line has earned three touches, and whether price has broken it, come back to it, or failed to get away from it.
By the end of this lesson you will be able to look at any chart and say, in plain words, where its trend line runs, whether that line has earned three touches, and whether price has broken it, come back to it, or failed to get away from it. You will also be able to read a channel and its measured move as distances, not promises, and say why a line drawn on the past can only be judged from the moment it was known.
1. What a trend line is
Foundry lesson. Free, no gate. Page: /foundry/trend-lines/. Educational interpretation only. Not financial advice.
How to use this lesson at your level
- Beginner: sections 1 to 4 and the traps in section 15. Get the habit of drawing lines through real touches and judging them on closes.
- Intermediate: add sections 5 to 8. Retests, failed breaks, channels and the measured move.
- Advanced: sections 9 to 13. Regression channels, log charts, when lines retire, and reading a working view with the price where it is wrong.
- Expert: section 14, plus the honest limit in every section. The skill is knowing what a line drawn on the past can and cannot tell you.
A trend line is a straight line through the turns of a move. In a rise, it joins the higher lows under price. In a fall, it joins the lower highs over price. It does not forecast anything by itself. It shows the path the move has taken so far, and the price where that path sits today.
The classic books on charts (Edwards and Magee in 1948, John Murphy in 1999) treat it the same way: a line is useful because it gives you one clear question to ask of each new candle. Is price still on its side of the line, or not?
Honest limit: a line is a guide drawn on the past. Price does not know it is there.
2. Two touches make a guess, three make a line
Any two turns can be joined by a straight line, which is why charts drawn by machines often fill up with lines that mean little. Murphy calls a two-touch line "tentative". The third touch is the first time price came back to a line that was already there, so it is the first real test.
A touch here means a candle came within a small distance of the line and then closed on the line's side. A line that price closed through between its touches is not a line at all.
Honest limit: three touches make a line, not a promise. A line with many touches can still break on the next candle.
3. A turn is only known some candles after it
You cannot know that a candle was a turning point while it is happening. You only know it once price has moved away from it for a few candles. So a line through two turns can only exist some candles after its second turn.
Many line tools hide this. They draw the line back at the turn, so on a past chart it looks as if it was known all along. On a live chart it never was. When you check a line tool, ask one question: from which candle could this line actually have been drawn?
Honest limit: every line comes late. Drawing it early on a past chart makes a tool look better than it could have been live.
4. Breaks are judged on closes
A wick through a line happens all the time. A break is a finished candle that closes clearly beyond the line, by a small margin based on the average candle size (ATR, the average range of the last 14 candles). Some traders ask for two closes beyond the line, not one.
A clean break of a rising line says the rise has lost its path. It does not say the price must now fall. Victor Sperandeo's well-known "1-2-3" reads a break as the first of three steps, not the whole change.
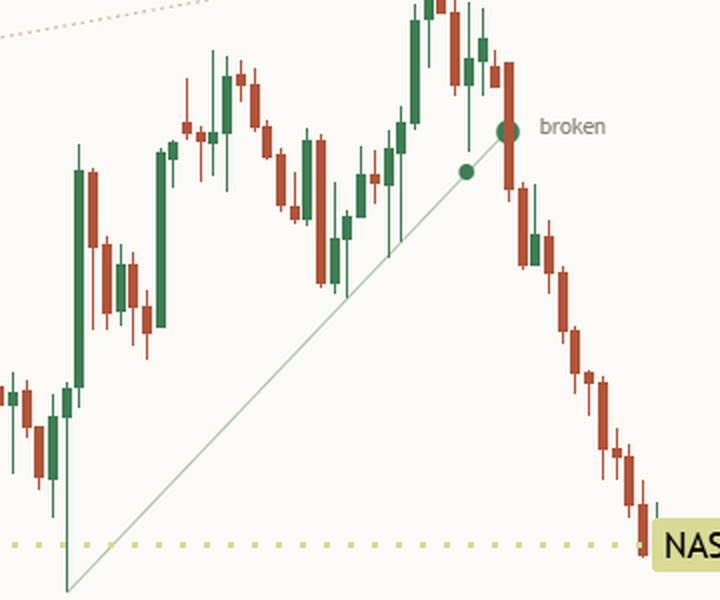
Honest limit: a close beyond the line is a fact about one candle. What comes next is still open.
5. Break and retest
After a break, price often comes back to the line it just broke. Edwards and Magee called it a throwback (after a break up) or a pullback (after a break down). Murphy's rule of thumb: a broken line under price often turns into a line over price, and the other way round.
A retest has two parts: a candle reaches back to the broken line, and it closes on the break side. If it closes back across instead, the retest gave way.
Honest limit: a retest that holds is a pattern, not a promise. Plenty of retests give way.
6. The failed break, and why it must stay on the chart
Some breaks reverse almost at once: price closes back across the line within a few candles. Linda Raschke and Larry Connors wrote a whole chapter on these failed breaks, because they happen so often.
Failed breaks are also the most important thing for a tool to keep. A tool that quietly deletes old lines and failed breaks whenever a new line forms leaves only the breaks that worked on the chart. The history then looks far cleaner than it was. A failed break is a fact, not a forecast, and it belongs on the chart.
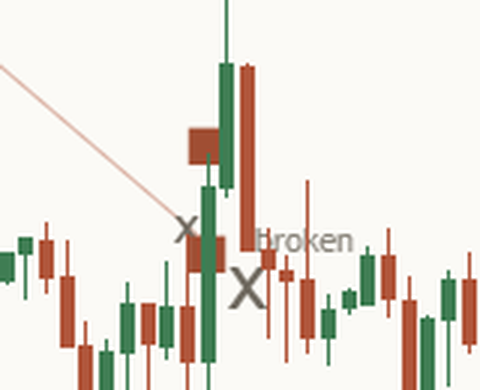
Honest limit: a failed break in one direction does not mean the other direction now wins.
7. Channels: the return line and the mid-line
Murphy's channel line, often called the return line, is drawn parallel to the trend line through the furthest price on the other side of the move. The space between the two lines is the channel, and a dashed mid-line sits halfway.
Where price sits in the channel is a simple, useful fact: near the top line, in the upper half, in the lower half, or near the bottom line. In a rising channel, a move that fails to reach the return line is an early sign the rise is tiring.
Honest limit: a channel can widen, bend or break. It is the past move framed, not a fence.
8. The channel break and the measured move
When price closes out of a channel, many traders measure one channel width beyond the line it broke: the distance between the two lines at the break, added on the far side. Murphy and Edwards and Magee both describe this measured move.
It is a distance, fixed once the break is final. It is not a goal price will reach. Sometimes price travels that far, sometimes it closes back inside first.
Honest limit: a measured move is a distance, not a goal.
9. Regression channels, and why they move
A regression channel is the straight line that fits the past closes best, with lines on each side: two standard deviations away, or (Gilbert Raff's way) through the furthest high or low. It is a neat summary of a move.
Its weakness is that it is refitted on every new candle. Today's channel sits in a different place from yesterday's, so a past "touch" of today's channel may never have touched the channel that existed at the time. An honest tool reads each break against the channel as it stood on the previous close, and leaves a frozen copy of that channel on the chart where price closed outside it.
How well a straight line fits the past closes can be scored from 0 to 1 (R). A high score says the past move was straight. It says nothing about the next candle.
Honest limit: the mid-line is an average, not a magnet.
10. Log charts
On a long chart of something that has risen many times over, a log scale shows equal percentage moves as equal distances. A line that is straight on a normal scale is curved on a log scale, and the other way round. So a line tool has to be told which one you use. A chart tool cannot see your scale setting.
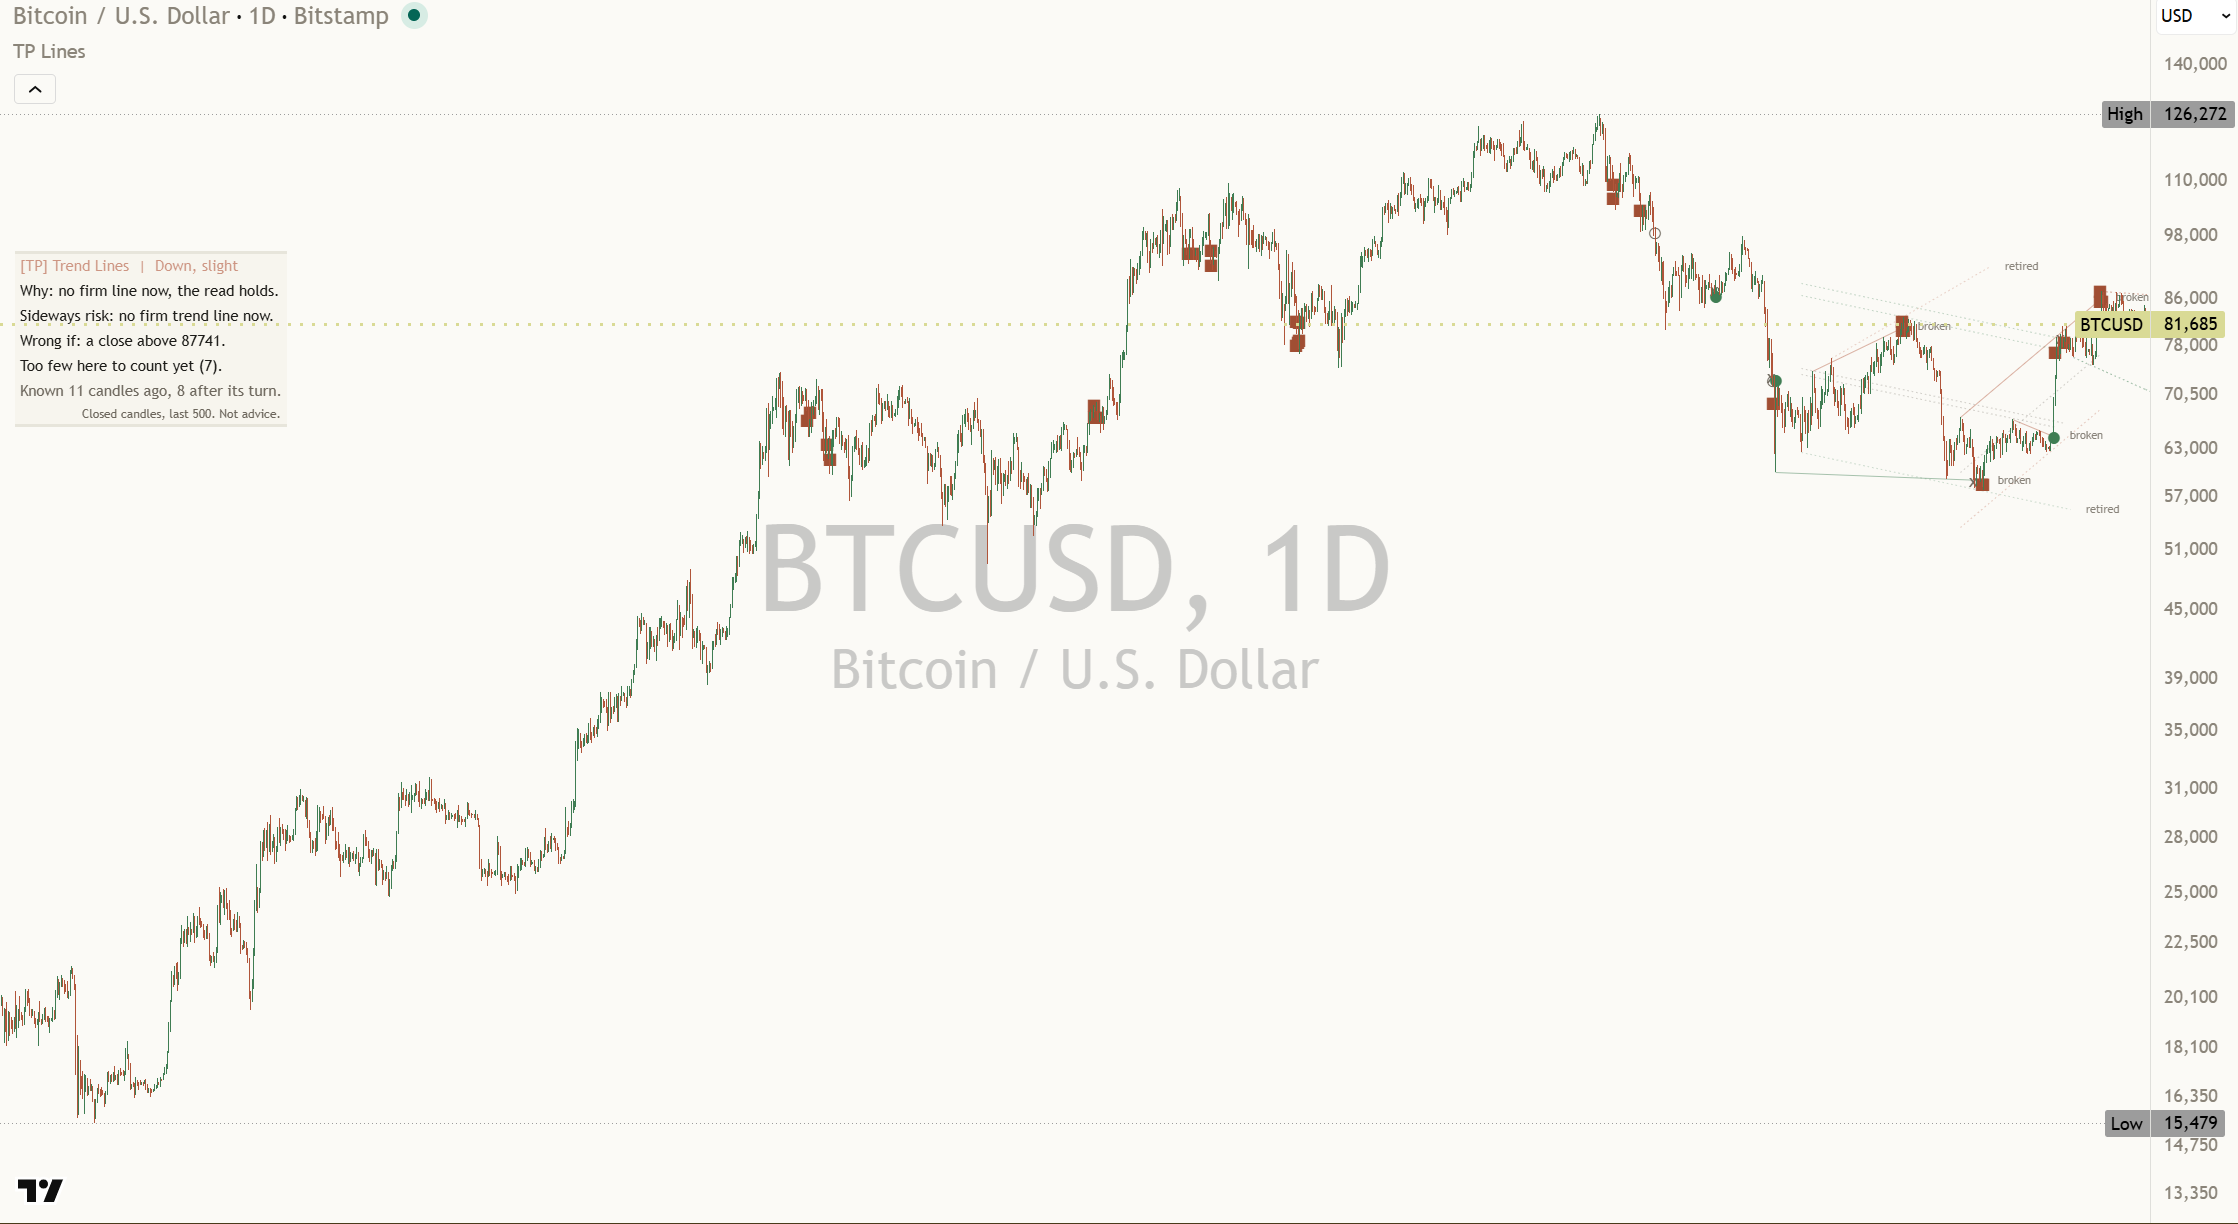
Honest limit: a line drawn in the wrong scale crosses the wrong prices, and nothing on the chart warns you.
11. When lines retire
Old lines that price has left far behind are not wrong, they are just no longer useful. A sensible rule retires a line once it has gone untouched for a long time, or untouched for a while and far from price. A retired line is not deleted: it stays, faded and named, so you can see it was there.
One more rule keeps charts readable. Once a line from a given turn has broken or retired, that turn is not used again for another line. Without it, tools draw a fan of lines from the same low, each one a little flatter, and each break "confirms" the next.
Honest limit: retire rules are choices. Change them and you change which lines are drawn.
12. A working view: up, down or sideways, and where it is wrong
Experienced traders always hold a working view, even when it is weak. Lines give you one: price broke a rising line, so the read is down; price is holding above a rising lower line, so the read is up; price is between two lines that point different ways, so the read is sideways, with those two lines as the range.
A good working view always comes with three more things:
- Why: the one fact it rests on.
- The main risk: what would most likely spoil it.
- Wrong if: the price where the view is plainly wrong, for example a close back above the line that broke.
How strong a view is should mean how much of the evidence agrees: the lines pointing the same way, and what similar moments did on this chart. It is not odds. And a view should not flip on every candle: wait for two closes before calling a change.
Honest limit: a read says where price is against its lines, not where it goes next.
13. This chart's own count
It is fair to ask what breaks, retests and line tests have done on the chart in front of you. Count each finished event in the last 500 candles and sort it: went on, failed, or neither. For a break, "went on" can mean the close moved one average candle range further within ten candles before any close back across the line.
Read the count as history from this chart, with its size in view: 6 out of 12 (worked example) is a small sample, and a couple of new events can swing it a long way. Under 8 events, it is fairer to say there are too few to count yet.
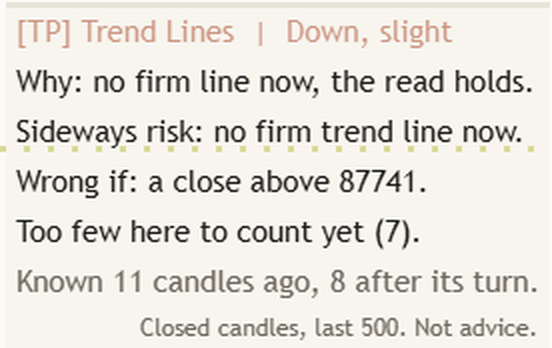
Honest limit: a dozen events is very few. The count describes the past on this chart, nothing more.
14. Honest limits, all in one place
- Lines come late: a turn is only known some candles after it.
- Closes decide: a wick through a line decides nothing.
- Three touches: a line, not a promise.
- Failed breaks count: a chart with only the breaks that worked is a cleaned-up chart.
- Channels move: they widen, bend and break.
- Measured moves: a distance, not a goal.
- Regression: refitted every candle; judge breaks against the channel as it stood.
- Scale: log and normal charts need different lines.
- Counts: history from this chart, not a promise.
15. Six common traps
- Joining any two turns. Wait for the third touch before calling it a line.
- Calling a wick a break. Only a finished candle's close decides.
- Trusting a line tool's past chart. Ask when each line could have been drawn, and whether failed breaks were wiped.
- Treating the measured move as a promise. It is a distance.
- Reading today's regression channel back into the past. It sat somewhere else then.
- Holding a view with no price where it is wrong. Write the Wrong if level down with the view.
16. Practise it
- Pick one market and one timeframe and keep them for a few weeks.
- Draw only lines with three touches. Note the candle from which each one could first have been drawn.
- When a finished candle closes beyond a line, write down: break, then watch for a retest or a close back across.
- Keep a one-line log per event, including the failed breaks.
- Each day, write your working view as up, down or sideways, why, the main risk, and the price where it is wrong.
- After a dozen events, count them yourself and compare with the panel's count.
Key takeaways
What to remember
- A trend line joins real turns; two touches make a guess, three make a line.
- A turn is only known some candles after it, so every line comes late. Judge it from the moment it was known.
- Breaks, retests and failed breaks are judged on finished candles' closes.
- Failed breaks belong on the chart. A chart that hides them flatters the tool.
- A channel frames the past move; the measured move is a distance, not a goal.
- Regression channels move with each candle; read breaks against the channel as it stood.
- A working view is up, down or sideways, with why, the main risk and the price where it is wrong.
- Counts from one chart are history, not promises.
17. See it explained live: [TP] Trend Lines & Channels - Mentor
Everything in this lesson is built into [TP] Trend Lines & Channels - Mentor, a free indicator coming to TradingView on 16 November 2026. It draws the lines, the channel and the marks on your price chart and talks you through them in plain English, so you can practise on live markets instead of from memory.
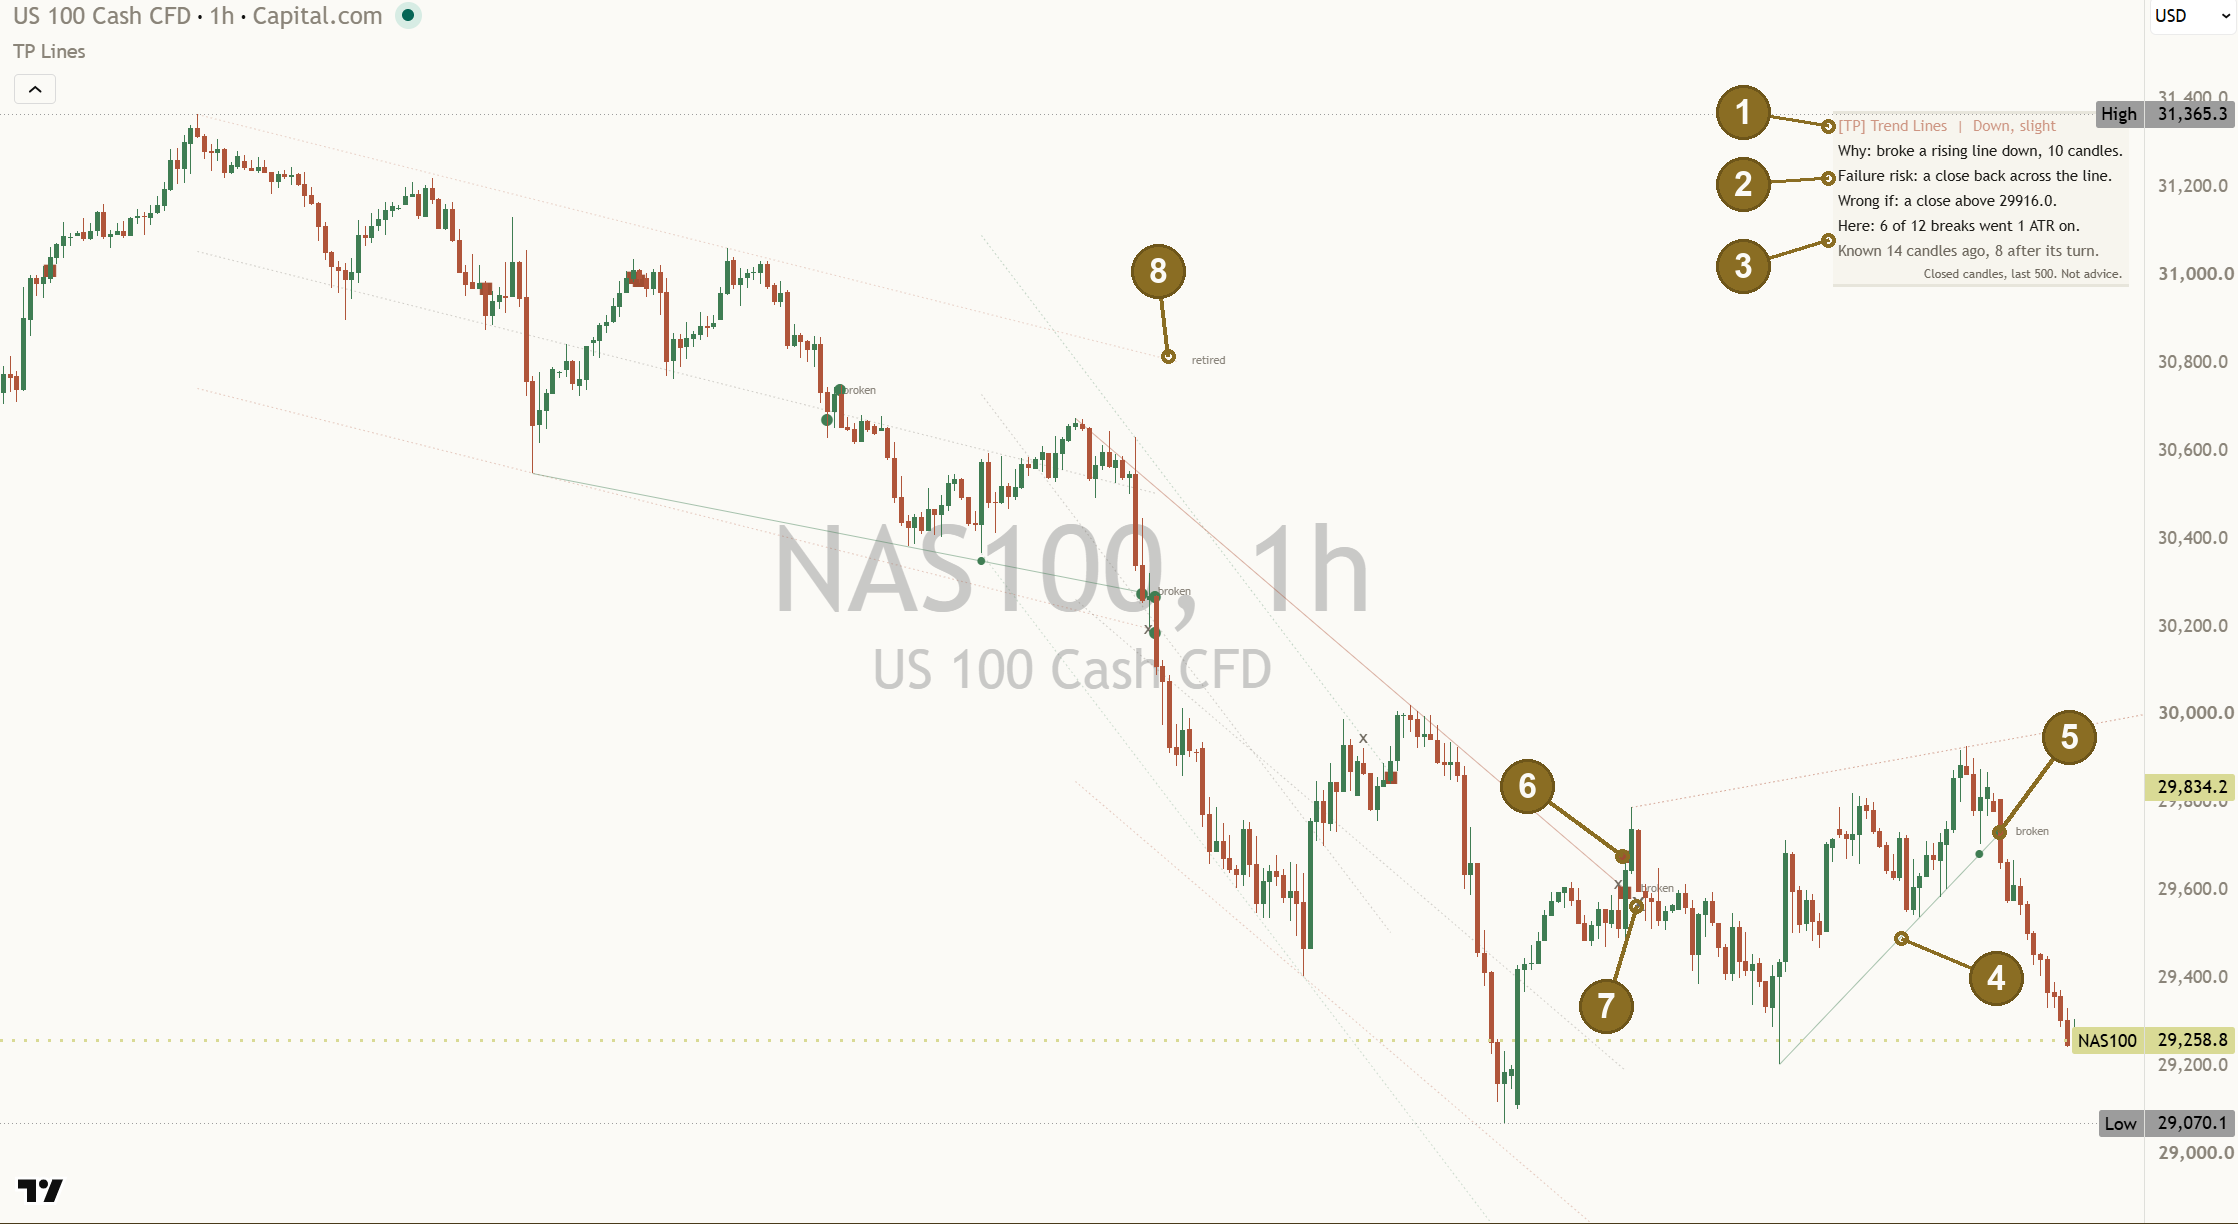
Its first promise is the honest one. Each line says when it became known: hover its tag and it reads, for example, "Known from" a date, and the panel's Known row reads "Known 14 candles ago, 8 after its turn." Every mark sits on the candle that confirmed it, never back at the turn. Failed breaks stay on the chart as squares, broken lines stay pale and tagged "broken", and a regression break leaves a frozen copy behind. Nothing is wiped when a new line forms. Step through it in TradingView's Bar Replay and you will see exactly what the chart showed at the time.
Here is where each part of the lesson shows up:
- The lines (sections 1 to 3). One live line per side, drawn from its first touch, with a tag such as "3 touches". "Touches needed" is 3 by default (2 to 5). With only two, the line shows faint and dotted, tagged "tentative", and it carries no events. "Swing size" (8) sets how many candles a turn needs on each side, which is also how late every line appears.
- Breaks, retests and failed breaks (sections 4 to 6). All judged on finished candles. A filled circle marks a break that went on, a square a failed break, a small x a test or retest that gave way, and a faint ring an event still open. The newest 12 marks are drawn, and failed-break squares keep their own cap of 30 ("Failed-break marks kept").
- The channel and the measured move (sections 7 and 8). "Channel from the trend line" draws the return line and a dashed mid-line, and the channel's width is fixed when it is built, so it never moves. After a channel break a thin gold dotted line tagged "1 channel width" shows while that move is open. The panel names it as "One channel width up:" with this chart's price, and the teaching line reads "A measured move is a distance, not a goal."
- Regression (section 9). Off by default. "Regression channel" set to Auto fit or Fixed draws it, tagged "regression", and the Full panel adds a fit row such as "Fit: strong (R 0.93) over 148 candles." (worked example). A frozen copy stays where price closed outside it.
- Log charts (section 10). Set "Line maths" to Log when your chart uses a log scale.
- Retiring lines (section 11). "Line lookback, candles" (200), "Retire a line after, candles" (120) and "Retire a line beyond, ATR" (8) keep the lines near price. Retired lines stay, faded and tagged "retired".
- The header (section 12). It always gives a read, never "no clear lean": Up, Down or Sideways, with slight, moderate or strong. Under it: "Why:", the main risk, and "Wrong if:" with this chart's price. A Sideways read shows its range, for example "Range: 29120.5 to 29840.0 (last 20)." (worked example). The read changes only after 2 closes in a row ("Closes to confirm a read change"), and a change on its way shows first, for example "Failure risk: down on 1 more close." Strength measures how much of the tool's own live evidence agrees. It is never odds.
- The count (section 13). "Here:" counts this chart's finished events of the play it is reading, in the last 500 candles, for example "Here: 6 of 12 breaks went 1 ATR on." Under 8 events it says "Too few here to count yet (7)." Every number on the panel comes from the chart it sits on.
- On the chart at the top of this lesson, NAS100 one hour, read on 22 Oct 2026, the panel read: "[TP] Trend Lines | Down, slight", then "Why: broke a rising line down, 10 candles.", "Failure risk: a close back across the line.", "Wrong if: a close above 29916.0.", "Here: 6 of 12 breaks went 1 ATR on." and "Known 14 candles ago, 8 after its turn."
- The teaching line. In the Full panel, one line changes with each new event, such as "Lines are drawn after the turn, not at it." or "Three touches make a line, not a promise." The footer: "Closed candles, last 500. Not advice." It never prints a percentage and never tells you what to do.
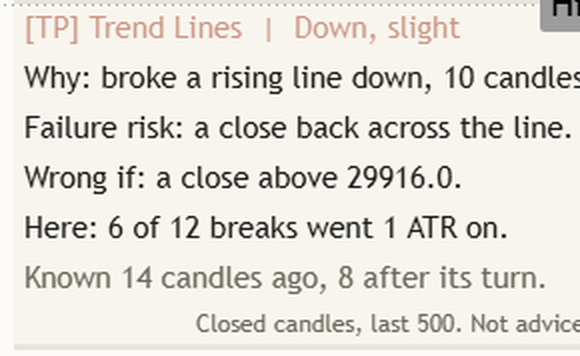
A good way to use it: before you look at the panel, say where the line is and whether the last close is on its side. Then read the header and its Wrong if price, and check the Known row against the chart. Where you disagree is where you learn.
Test yourself
Take the 15-question quiz below to check what stuck.
Question 1 of 15 · Beginner
In a rising market, where does the trend line usually run?
Question 2 of 15 · Beginner
Why does this lesson treat a line through only two turns as tentative?
Question 3 of 15 · Beginner
A candle's wick pokes through a rising line, but the candle closes above it. What happened?
Question 4 of 15 · Beginner
Why does every trend line appear some candles after its last turn?
Question 5 of 15 · Beginner
A line tool's past chart shows only breaks that worked. What should you ask first?
Question 6 of 15 · Intermediate
Price closed above a falling line, then a few candles later dipped back to that line and closed above it again. What is this called?
Question 7 of 15 · Intermediate
Price closes below a rising line, then two candles later closes back above it. What is this?
Question 8 of 15 · Intermediate
How is the return line of a channel drawn?
Question 9 of 15 · Intermediate
Price closes out of the top of a channel. How is the measured move worked out?
Question 10 of 15 · Intermediate
In a rising channel, price makes a swing high that fails to reach the return line. What does the lesson say this can show?
Question 11 of 15 · Advanced
Why can a regression channel mislead you on a past chart?
Question 12 of 15 · Advanced
Your long daily chart uses a log scale, but the line tool assumes a normal scale. What goes wrong?
Question 13 of 15 · Advanced
Your working view is Down after price broke a rising line. Which line belongs with it?
Question 14 of 15 · Expert
On one chart, 6 of 12 breaks went on (worked example). How should you read that?
Question 15 of 15 · Expert
What does a read's strength (slight, moderate or strong) measure in this lesson?
Educational interpretation only. Not financial advice. Every reading comes from candles that already closed, and the counts are history, not promises about what comes next.
Learn the idea here. Apply it with the desk.
Titan Protect turns lessons like this into a daily practice: live market research, the full framework, and the tools that put it to work. This lesson is free; the desk is where it compounds.