Elliott Wave, honestly: what a possible count is, and what came next
Look at any chart and say, in plain words, what a five-wave count is, which three rules it must pass, and why the same chart can be counted in more than one way.
By the end of this lesson you will be able to look at any chart and say, in plain words, what a five-wave count is, which three rules it must pass, and why the same chart can be counted in more than one way. You will also be able to read what past possible counts did on your own chart, both outcomes side by side, and say why that count is history, not a path.
1. The idea in one sentence
Foundry lesson. Free, no gate. Page: /foundry/elliott-wave/ (existing key, replaced in place). Educational interpretation only. Not financial advice.
How to use this lesson at your level
- Beginner: sections 1 to 6 and the traps in section 17. Get the habit of seeing a count as one reading, built from confirmed swings and three rules.
- Intermediate: add sections 7 to 10. Many counts, drawn late, nothing drawn ahead, and the three outcomes over 30 candles.
- Advanced: sections 11 to 14. Titan research, why the panel does not lean, and reading this chart's own count.
- Expert: sections 15 and 16, plus the honest limit in every section. The skill is knowing what a count of the past cannot tell you.
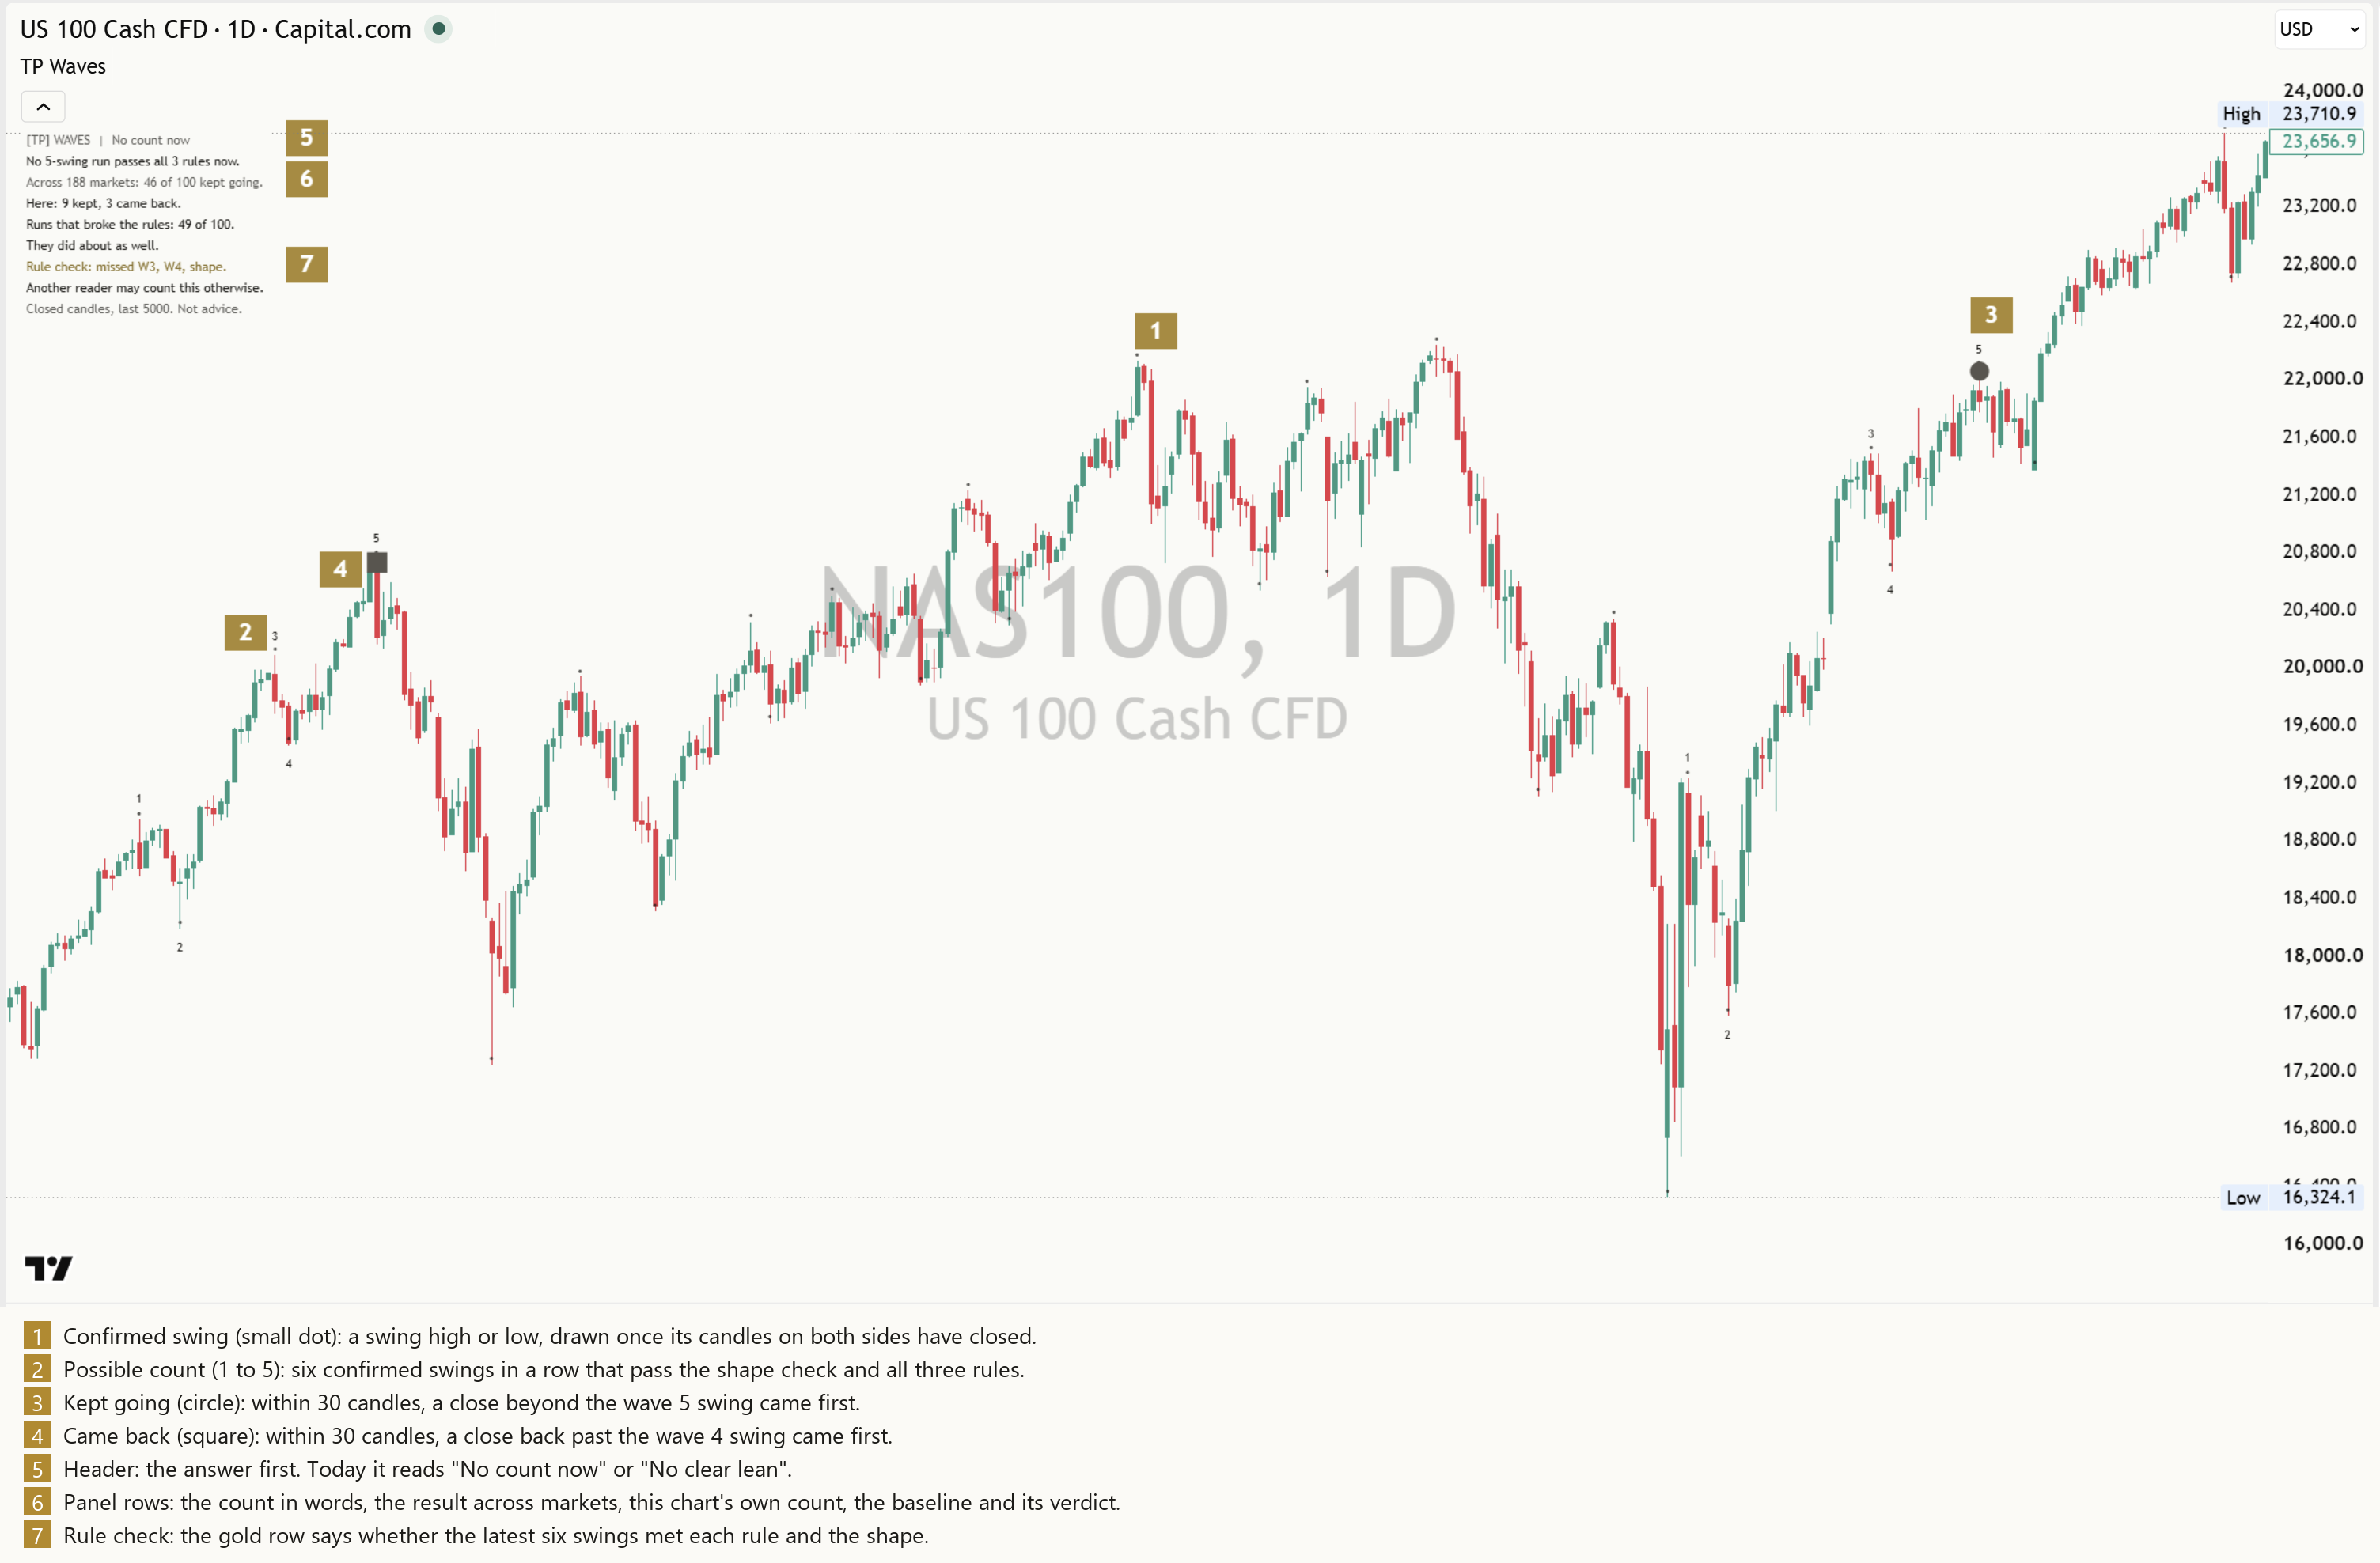
Elliott Wave reads a move as five swings: three with the move (waves 1, 3 and 5) and two against it (waves 2 and 4), often followed by a three-swing pullback. Ralph Nelson Elliott described it in the 1930s as a picture of crowd mood swinging between hope and fear.
That is the whole idea. Everything else, the rules, the ratios people add and the many named patterns, is detail built on top of it.
Honest limit: a wave count describes swings that already happened. It does not say what price does next.
2. Start with confirmed swings
A swing high is a high with lower highs on both sides of it. A swing low is the mirror. You only know a high was a swing once some candles have closed after it. With five candles on each side, the most common choice, a swing is confirmed five candles after it happened. If two highs arrive in a row with no low between them, the more extreme one is kept, so the swings always alternate high, low, high, low. See Reading market structure for how swings build a trend.
Honest limit: fewer candles on each side find more, smaller swings, sooner. More candles find fewer, larger swings, later. Neither is the true swing, and the count changes with the choice.
3. The shape of a five-wave run
Take six confirmed swings in a row. For a run up: a low (the start), a high (end of wave 1), a higher low (end of wave 2), a higher high (end of wave 3), a higher low (end of wave 4) and another higher high (end of wave 5). Wave 3 must end beyond wave 1, and wave 5 beyond wave 3. A run down is the exact mirror.
Honest limit: some analysts allow a fifth wave that falls short of the third. A strict shape check, like the one in this lesson's indicator, leaves those runs out.
4. Rule 1: wave 2 stays beyond the start
Wave 2 cannot go past the start of wave 1. In a run up, the wave 2 low must stay above the low where wave 1 began. If it goes below, there was no wave 1 to count.
Honest limit: the rule uses swing prices, wicks included. A close-based version would accept some runs this one rejects.
5. Rule 2: wave 3 is not the shortest
Of the three waves with the move, 1, 3 and 5, wave 3 must not be the shortest. It does not have to be the longest, only not the shortest. Many wave tools skip this rule. It is one of the three that every textbook agrees on.
Honest limit: "shortest" here means price distance from swing to swing. Time is not measured.
6. Rule 3: wave 4 stays out of wave 1's range
In a run up, the wave 4 low must stay above the wave 1 high. If wave 4 dips into wave 1's price range, the run fails. Down runs mirror it.
Honest limit: some markets, especially those that trade around the clock with many small gaps, overlap often. The rule rejects those runs; it does not say the market was "wrong".
7. Why one chart has many counts
Change the swing size and the swings change. Change where you start counting and the waves change. Allow corrections inside waves, or waves inside waves, and the number of possible counts grows fast. That is why two careful analysts can look at the same chart and disagree. A rule-passing count is one mechanical reading, never the answer.
Honest limit: passing the rules makes a count allowed, not right.
8. Drawn late, never moved
An honest count can only be drawn once its sixth swing is confirmed, which is some candles after wave 5 ended. From then on its numbers should never move. Tools that redraw their counts as new candles arrive can make every past count look perfect, because the count was fitted after the fact.
Honest limit: a count drawn late is honest about timing, but it is still late. It describes a move that is already over.
9. No forming counts, no path ahead
A run with three swings so far invites a story about waves 4 and 5. Ratios drawn to the right of price invite a story about where wave 5 ends. Both turn a description into a guess. This lesson, and the indicator, label only finished runs and draw nothing ahead of the last candle.
Honest limit: leaving out forming runs means the indicator is silent while a run is in progress. That silence is the honest answer.
10. Three outcomes over 30 candles
To check what a count was worth, look at the next 30 finished candles after it was confirmed and record what happened first:
| Outcome | For a count up | For a count down | Mark |
|---|---|---|---|
| Kept going | a close above the wave 5 high | a close below the wave 5 low | ● |
| Came back | a close below the wave 4 low | a close above the wave 4 high | ■ |
| Neither | neither close within 30 candles | neither close within 30 candles | ○ |
Only closes decide. A wick through either swing decides nothing, and every unclear case lands in neither.
Honest limit: 30 candles is one fixed window. A longer or shorter one would sort some counts differently.
11. Titan research: what we found when we tested the three rules offline
We tested this rule on 161 to 196 markets offline. This is our research, not something the indicator reads on your chart.
One chart rarely has enough clean five-wave runs to say anything, so we ran the test on finished history from many markets: daily charts (2020 to 2026) and one-hour charts (one year). The fair comparison for a rule-passing count is a run with the same five-swing shape that broke at least one rule. If the rules matter, rule-passing runs should do noticeably better. Per 100 counts, over the next 30 finished candles:
| Chart and direction | Markets | Counts (n) | Kept going | Came back | Neither | Rule-breaking runs |
|---|---|---|---|---|---|---|
| Daily, count up | 188 | 698 | 46 | 42 | 12 | 49 kept going |
| Daily, count down | 161 | 341 | 37 | 49 | 14 | 42 came back |
| One hour, count up | 196 | 681 | 45 | 41 | 14 | 45 kept going |
| One hour, count down | 189 | 583 | 42 | 45 | 13 | 38 came back |
The plain reading: in our test, runs that passed all three rules did not clearly beat runs of the same shape that broke one. On counts up the two are within 5 in 100. On counts down the gap is 7 (49 against 42 daily, 45 against 38 on one hour), still small. On daily counts up, the rule-breaking runs kept going slightly more often. No outcome comes near a clear majority: the highest is 49 in 100.
Honest limit: this is our offline history, and the indicator does not show it. The markets are today's list, so names that no longer trade are missing, and the one-hour history covers one year.
12. Why the panel does not lean
The header reads "[TP] WAVES | No clear lean" when a possible count is on the chart, and "[TP] WAVES | No count now" when the latest six swings do not pass. The panel does not pick a side for you. Every number on it comes from the chart it sits on, and one chart has few clean runs, so it shows both outcomes and leaves the weighing to you.
Honest limit: "no clear lean" is not "bad". It means the panel leaves the call to you and your chart.
13. Reading both outcomes together
A count means little until you read both sides of it. "9 kept" sounds like something until you see that 3 came back on the same chart, and that 12 counts is a small sample. Read the kept count, the came back count and the neither count as one thought, then ask how many counts there were in all.
Honest limit: a dozen counts can line up by chance. A longer window adds counts, but it also mixes older and newer markets.
14. This chart's own count
Under the count in words the panel gives this chart's own history, for counts in the same direction as the latest one, over the last 5000 finished candles. It shows both outcomes side by side, and the next row says how many were neither. That row only appears when at least one run was neither. For example (worked example):
- "Here: 7 kept, 5 came back."
- "3 of 15 were neither."
With fewer than 8 settled outcomes it says "Too few here to count yet (5)." (worked example). Clean five-wave runs are rare, so this is common. With fewer than 12 qualifying runs in the window, the teaching line says so too: "Clean five-wave runs are rare here: 9." (worked example).
Honest limit: a chart's own count never sets a lean, and the header stays as it is.
15. What changing the settings does
- Swing strength (Responsive 3, Balanced 5, Structural 10, or Custom) changes every swing, so it changes every count and every outcome. None of these settings is the right one.
- Finished candles to count (500 to 5000) changes how far back this chart's own count looks.
- Panel detail on Full swaps the one-line rule check for the four-line rule block, and adds "Changes if", which names the count's own swing, for example "Changes if: a close above the wave 5 high.", and the mark legend "● kept ■ came back ○ neither".
- Show higher-timeframe context (off by default) adds one row in Full view saying whether the swings on one higher timeframe step higher, step lower or are mixed, for example "Agrees: the 1W swings step higher." on a daily chart. It is context only and never changes a count.
- Show swing line (off by default) joins the confirmed swings with one neutral line. "Line width" sets how thick it draws; it does not change the marks.
- Mark size (Tiny, Small, Normal or Large; Normal by default) sets how large the circle, square and ring marks draw, and the still-open ring too. It changes their size only, not where they sit (centred on the wave 5 high or low) or what they count.
Honest limit: if you change the swing size until an old chart counts cleanly, you have fitted the chart, not read it.
16. Honest limits, all in one place
- History, not a path: every count and every outcome describes finished candles.
- One reading: a rule-passing count is allowed, not right. Other counts can fit.
- Drawn late: swings confirm five candles late on Balanced, and counts later still.
- Narrow on purpose: five-wave runs only, one swing size, no corrections, triangles, diagonals or waves inside waves, no forming counts.
- The rules are not a forecast: a count that meets all three rules can still come back.
- Small samples: clean runs are rare, so this chart's own count is often small.
17. Six common traps
- Believing there is one right count. There are usually several.
- Treating "rules met" as "right". The history says the rules added little.
- Labelling a run that is still forming. Wait for the sixth swing.
- Drawing the rest of the move in your head. Nothing on the chart says where it ends.
- Letting a wick decide. Wait for the close.
- Reading only one side of the count. "9 kept" means little until you see "3 came back" beside it, and how few counts there were.
18. Practise it
- Pick one market and one timeframe and keep them for a few weeks.
- When a possible count appears, write down one other way the same swings could be counted.
- Read the rule check (Full view lists the three rule lines) and say which rule was closest to failing.
- Then watch the next 30 candles. Kept going, came back, or neither?
- Keep a one-line log per count, including the ones that did not go the way you thought.
Key takeaways
What to remember
- A five-wave count is three swings with the move and two against it, built from confirmed swings.
- Three rules: wave 2 stays beyond the start, wave 3 is not the shortest, wave 4 stays out of wave 1's range.
- Every honest count is drawn late, once its sixth swing confirms, and never moves after that.
- One chart can be counted many ways, so every count is a possible count.
- The panel's count comes from your chart only: read kept and came back side by side.
- The counts are history, not a path.
19. See it explained live: [TP] Elliott Wave - Mentor
Everything in this lesson is built into [TP] Elliott Wave - Mentor, a free indicator on TradingView. It draws the swings and possible counts on your price chart and talks you through them in plain English, so you can practise on live markets instead of from memory.
Here is where each part of the lesson shows up:
- Confirmed swings (section 2). Each swing gets a small neutral dot. "Swing strength" sets the swing (Balanced, five candles each side, by default). Hover a dot and it says "Confirmed swing. It arrived after the selected right-side candles closed." "Show swing line", off by default, joins the confirmed swings with one neutral line.
- The shape and the rules (sections 3 to 6). The numbers 1 to 5 go on only when the shape check and all three rules pass. At the default Compact, one gold panel row tests the latest six swings, for example "Rule check: missed W3, W4, shape.", or "Rule check: W2, W3, W4 and shape met." when all pass. With "Panel detail" on Full, a separate four-line rule block gives one line per rule and one for the shape, for example "W3 is not the shortest: rule met.", "W4 dipped into W1's range: rule missed." or "Waves 3 and 5 extended: shape met.", with a missed line in gold.
- Many counts (section 7). In Full view the rule block's title always ends "Other counts can fit.", and the numbers' tooltip starts "Possible count; other counts fit."
- Wave sizes, after the fact (sections 3 and 9). Each number's tooltip adds one size from the finished run: "Wave 2 went back Nx wave 1.", "Wave 3 was Nx wave 1.", "Wave 4 went back Nx wave 3." or "Wave 5 was Nx wave 1." They compare waves that are over. Nothing is drawn from them to the right of price.
- Drawn late, nothing ahead (sections 8 and 9). Counts appear when the sixth swing confirms and never move. Optional extras, off by default, show a gold ring while a count's window is open ("Still open, not counted yet") and a dotted forming leg ("Forming, not counted").
- The outcomes (section 10). "Mark past events" puts a filled circle for kept going, a square for came back and a hollow ring for neither, centred on the wave 5 high (the wave 5 low for a count down), all in one neutral colour. The NAS100 daily chart at the top has no ring: all 12 of its marks are circles or squares. The last 12 stay on the chart, and "Mark size" (Normal by default) sets how large they draw.
- The header (section 12). The header says "No clear lean", or "No count now" when the latest six swings do not pass. The panel shows no figures from other markets; our offline research (section 11) stays in the lesson.
- This chart (section 14). "Here: 7 kept, 5 came back." with "3 of 15 were neither." (shown only when at least one run was neither), or "Too few here to count yet (5)." (worked examples).
- On the chart at the top of this lesson, NAS100 daily (read 19 Oct 2026, last candle 16 Oct), the panel read "No 5-swing run passes all 3 rules now." then "Here: 9 kept, 3 came back." and "Rule check: missed W3, W4, shape." None of its 12 settled outcomes was neither, so that row was left out.
- How to read the panel, top to bottom. The header, the count in words, this chart's count, how many were neither (only when at least one was), the one-line rule check, one teaching line such as "Rules met is not the same as right.", and the footer: "Closed candles, last 5000. Not advice." It never prints a percentage and never instructs.
- Easier to read. "Colours" on Auto matches your chart. "Panel text size" goes from Tiny to Large, Compact keeps the panel to seven rows or fewer, one line each, with the rule check in one row, and "Show rule checks" hides that row and the Full view rule block.
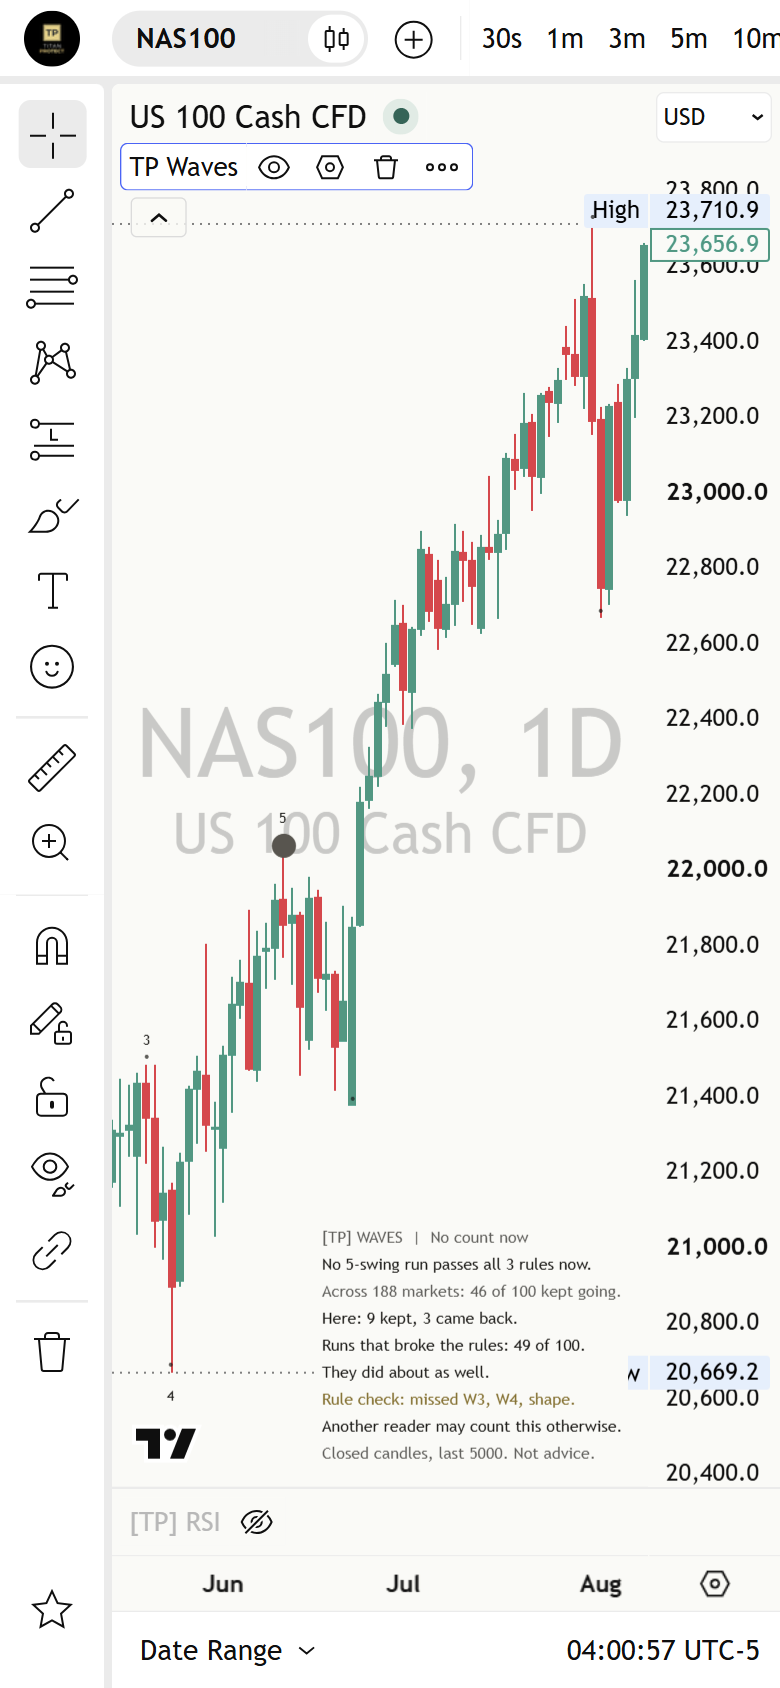
A good way to use it: say what you see first: which six swings, and which rule came closest to failing? Write down one other count that could fit. Then watch the next 30 candles, and only then read the panel's count on this chart, both outcomes together. Where you disagree is where you learn.
Test yourself
Take the 17-question quiz below to check what stuck.
Question 1 of 17 · Beginner
In plain words, what is a five-wave count?
Question 2 of 17 · Beginner
When is a swing high confirmed with five candles on each side?
Question 3 of 17 · Beginner
In a run up, what does rule 1 say about wave 2?
Question 4 of 17 · Beginner
What does rule 2 say about wave 3?
Question 5 of 17 · Beginner
In a run up, what does rule 3 say about wave 4?
Question 6 of 17 · Intermediate
Why can two careful analysts count the same chart differently?
Question 7 of 17 · Intermediate
The panel says "Rules met is not the same as right." What does it mean?
Question 8 of 17 · Intermediate
Why is every honest count drawn some candles after wave 5?
Question 9 of 17 · Intermediate
Why does the indicator not label a run that is still forming?
Question 10 of 17 · Intermediate
After a possible count up, a candle closes below the wave 4 low before any close above the wave 5 high. Which mark appears?
Question 11 of 17 · Intermediate
A long wick pokes above the wave 5 high but the candle closes below it. What has been decided?
Question 12 of 17 · Advanced
On NAS100 daily the panel reads "Here: 9 kept, 3 came back." What is the fair reading?
Question 13 of 17 · Advanced
Why does the header say "No clear lean" when a possible count is on the chart?
Question 14 of 17 · Advanced
The panel says "Too few here to count yet (5)." What does that mean?
Question 15 of 17 · Expert
You switch Swing strength from Balanced to Responsive. What happens?
Question 16 of 17 · Expert
Full view shows "Changes if: a close above the wave 5 high." Is that a level to aim for?
Question 17 of 17 · Expert
Which sentence best sums up what the panel's count on one chart tells you?
Educational interpretation only. Not financial advice. Every count describes swings that already closed, and the counts are history, not promises about what comes next.
Learn the idea here. Apply it with the desk.
Titan Protect turns lessons like this into a daily practice: live market research, the full framework, and the tools that put it to work. This lesson is free; the desk is where it compounds.