Reading Fibonacci retracements: which swing, which levels, and what they cannot tell you
Look at any set of Fibonacci lines and say, in plain words, which move they measure, whether the swing has finished forming, where price sits between the lines, and how far the nearest line is.
By the end of this lesson you will be able to look at any set of Fibonacci lines and say, in plain words, which move they measure, whether the swing has finished forming, where price sits between the lines, and how far the nearest line is. You will also be able to read the lines as proportions rather than a promise, and say why the swing you pick matters more than the ratio.
1. What a Fibonacci retracement is
Foundry lesson. Free, no gate. Page: /foundry/fibonacci-retracement/. Educational interpretation only. Not financial advice.
How to use this lesson at your level
- Beginner: sections 1 to 4 and the traps in section 16. Get the habit of asking "which move is this measuring?"
- Intermediate: add sections 5 to 9. Picking the swing, reading the lines, the shaded zone, and when the lines move.
- Advanced: sections 10 to 13. Extensions, log scale, calendar ranges and counting revisits honestly.
- Expert: sections 14 and 15, plus the honest limit in every section. The skill is knowing what a Fibonacci line cannot see.
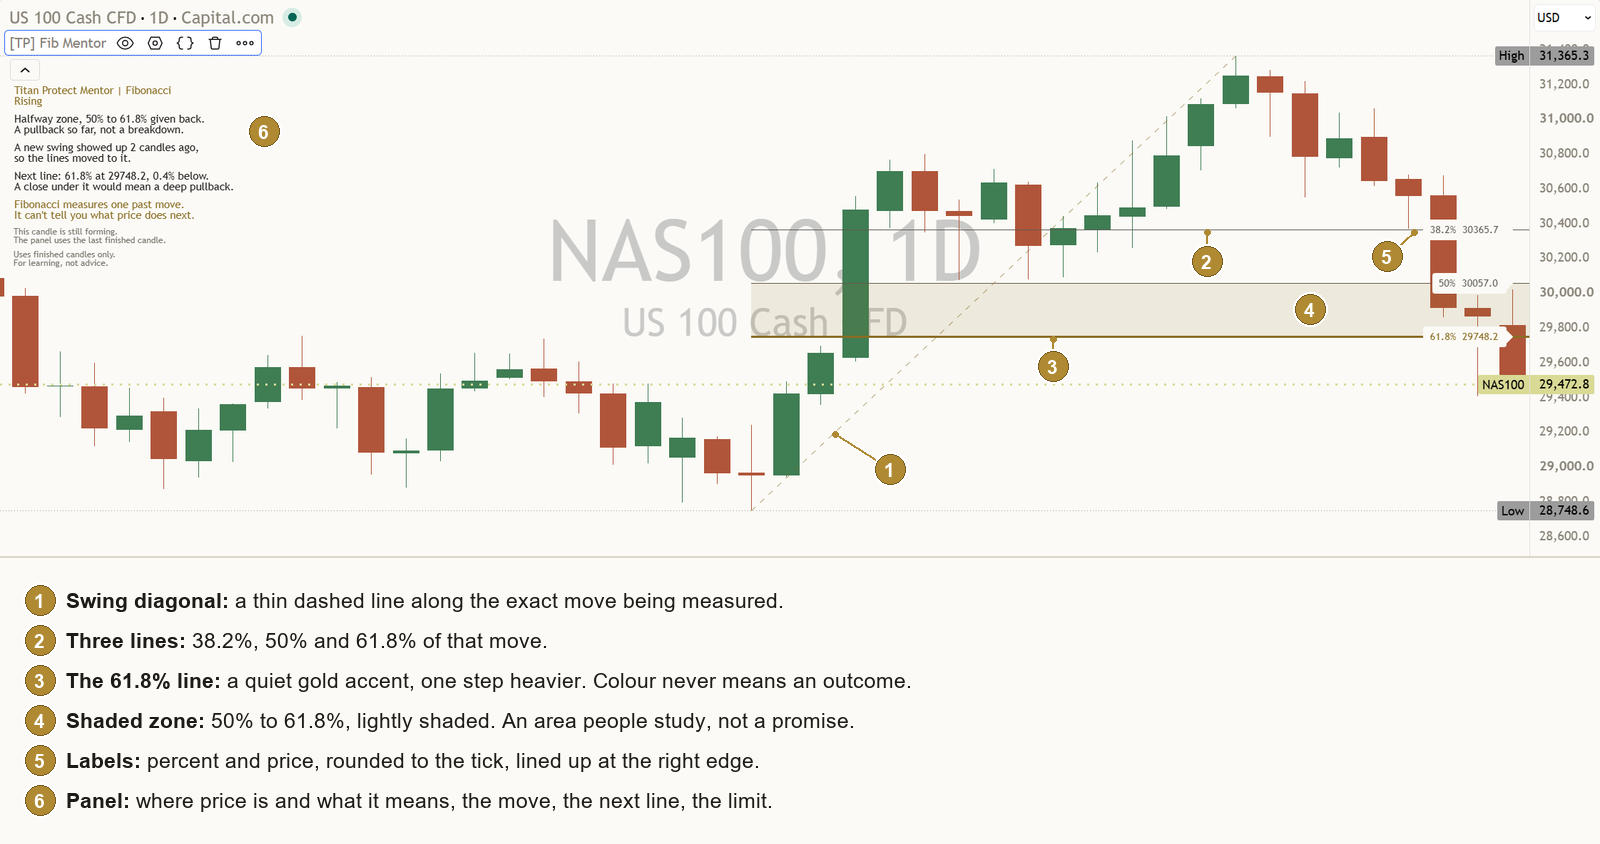
A retracement is a pullback inside a move. Price rises from a low to a high, then gives some of it back. Fibonacci retracement lines measure that pullback as a share of the move.
Take the move from its start to its end. Draw lines at set proportions of it, counted back from the end: 38.2%, 50% and 61.8% are the common ones. A 50% line sits exactly halfway between the start and the end.
That is all the lines are: a ruler laid over one past move.
Honest limit: the lines are proportions of a move that has already happened. They do not know what price will do next.
2. Where the ratios come from
The Fibonacci sequence goes 1, 1, 2, 3, 5, 8, 13, 21, and so on. Each number is the sum of the two before it. Divide one number by the next and the answer settles near 0.618. Divide by the number two places on and it settles near 0.382. Three places on gives about 0.236.
- 61.8% and 38.2% come straight from the sequence.
- 23.6% comes from it too.
- 50% is not a Fibonacci ratio at all. It is simply halfway, and traders watched it long before anyone called it Fibonacci.
- 78.6% is the square root of 0.618.
Honest limit: the ratios have a neat history, but nature does not place price there. Any pull a level has comes from people watching it, not from the maths.
3. The swing is the whole story
The single most important fact about Fibonacci lines is which move they measure. Pick a different low or a different high and every line moves.
That is why "which swing?" is the first question. Most Fibonacci tools pick a swing and never say which one. Then, when the lines look wrong for the move you care about, you cannot tell whether to trust them or redraw them.
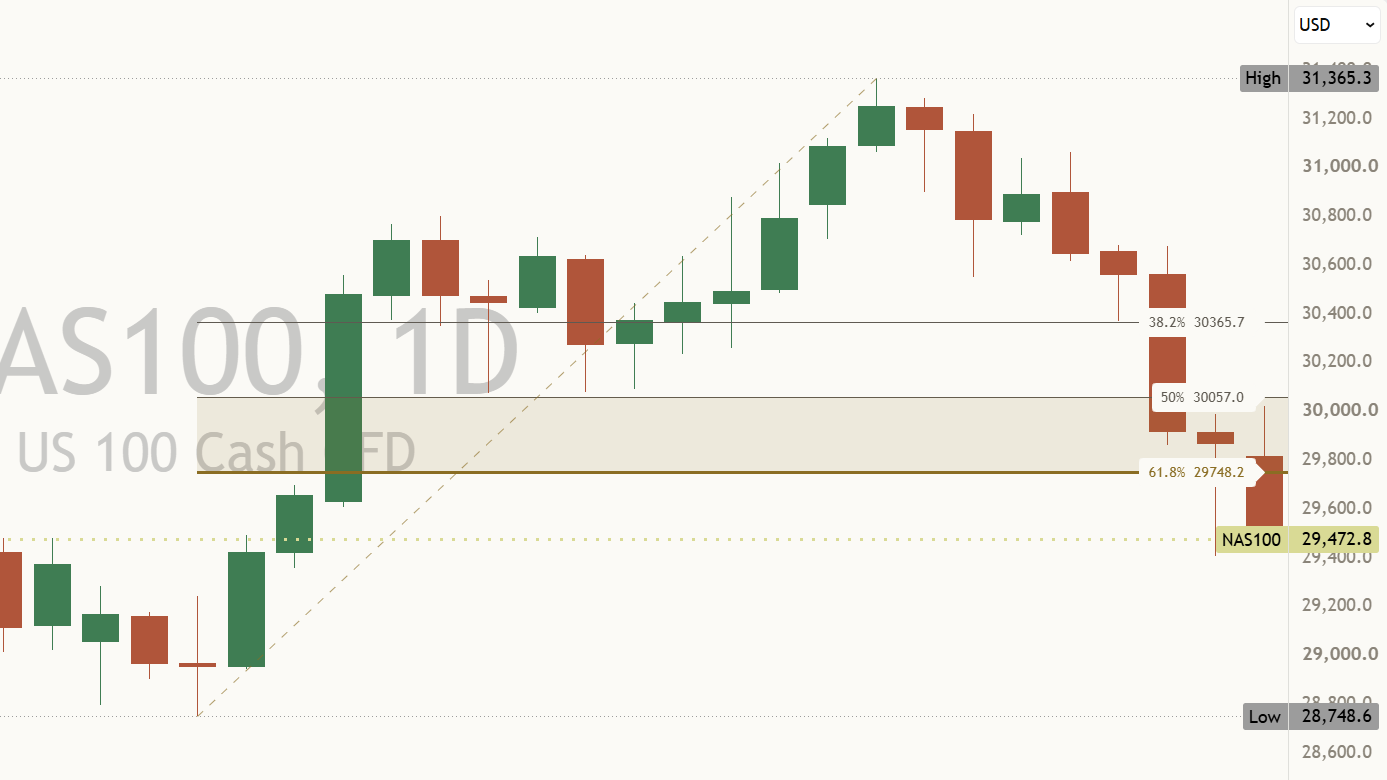
Honest limit: no swing is the "correct" one. A small swing and a big swing on the same chart give two fair sets of lines that answer different questions.
4. Why a swing is only known late
A swing high is a bar whose high is above the highs of a set number of bars on each side. A swing low is the mirror. (See Market structure.)
Here is the catch: you cannot know a bar was a swing high until the bars on its right have closed. So a swing only counts once the candles after it have closed, and it is always known a few candles late. From here on, "swing" means one of these.
There are two ways to handle that:
- Honest: wait for those candles to close, then draw the lines. They appear a few candles after the swing, and once drawn they stay put.
- Misleading: draw from the highest high so far and keep stretching the lines as price moves. On an old chart it looks perfect. At the time, the lines kept moving.
Honest limit: waiting costs a few candles. That lag is the price of lines that never move.
5. Picking the swing by rule, not by taste
Picking a swing by eye invites a quiet bias: we tend to choose the swing that makes the lines fit what already happened. A fixed rule removes that.
One clear rule is: start from the most important recent turn (the base of the current structure) and end at the latest swing the other way. Before there is such a turn, use the two newest swings going opposite ways.
How many candles count as "each side" sets the size of the swings. Fewer candles finds small, recent swings. More candles finds only the big turns. Match it to your timeframe.
Honest limit: a rule makes the choice consistent, not right. It still picks one move out of many.
6. Reading the lines
For an up move, the lines count back down from the high:
- 38.2%: a shallow pullback, less than half the move given back.
- 50%: halfway.
- 61.8%: a deep pullback, most of the move given back.
For a down move, it is the mirror: the lines count back up from the low.
The useful read is not "is price at a line?" but "between which two lines did the last candle close, and how far is the nearest one?" Distance in percent of price works on any market: "0.4% below" means the same on a stock index and a currency.
Honest limit: a close near a line is a location, not an event. Price can pass a line without pausing.
7. The 50% to 61.8% zone: an area people study
The space between 50% and 61.8% is the part of a pullback that gets studied most. Shading it lightly makes it easy to find.
Some traders give this area dramatic names and treat it as a place where price must turn. It is not. Price can turn before it, pass straight through it, or sit inside it for a long time.
Honest limit: the zone is popular, so it is watched. Watched is not the same as reliable.
8. Fewer lines, clearer read
Charts with ten lines, two sets of extensions and a coloured candle on top bury the chart. The eye has nowhere to land.
A cleaner habit is three lines by default: 38.2%, 50% and 61.8%. Add 23.6% or 78.6% one at a time, only when you will actually read them. One quiet accent on a single line (such as 61.8%) gives the eye a focal point. Colour should never mean "good" or "bad".
Honest limit: fewer lines do not make the read more accurate. They make it easier to read honestly.
9. When a new swing confirms
Markets keep moving. When a newer swing confirms, the old lines no longer measure the current move. A good tool moves the lines once that new swing is confirmed, and says so out loud.
Keeping one to three old sets of lines as faint outlines with no labels can help: you see where the lines used to be, without confusing them with the current ones.
Honest limit: old lines are not "wrong" in hindsight. It measured the move that existed at the time.
10. Extensions: proportions past the end
Extensions continue past the end of the swing, in the direction it went: 127.2%, 161.8%, 200% and 261.8% are common. A 161.8% extension of an up move sits above the high by 61.8% of the move.
Extensions are the first thing that clutters a chart, so keep them off until you want them.
Honest limit: an extension is a proportion, the same as a retracement. It does not say how far a move will go.
11. Linear or logarithmic
On a short move, measuring in price and measuring in percentage change give almost the same lines. On a long, large move they do not. If a market went from 10 to 100, halfway in price is 55. Halfway in percentage terms is about 31.6.
- Linear: the move measured in price.
- Logarithmic: the move measured in percentage change. It suits long moves and markets that have multiplied in value.
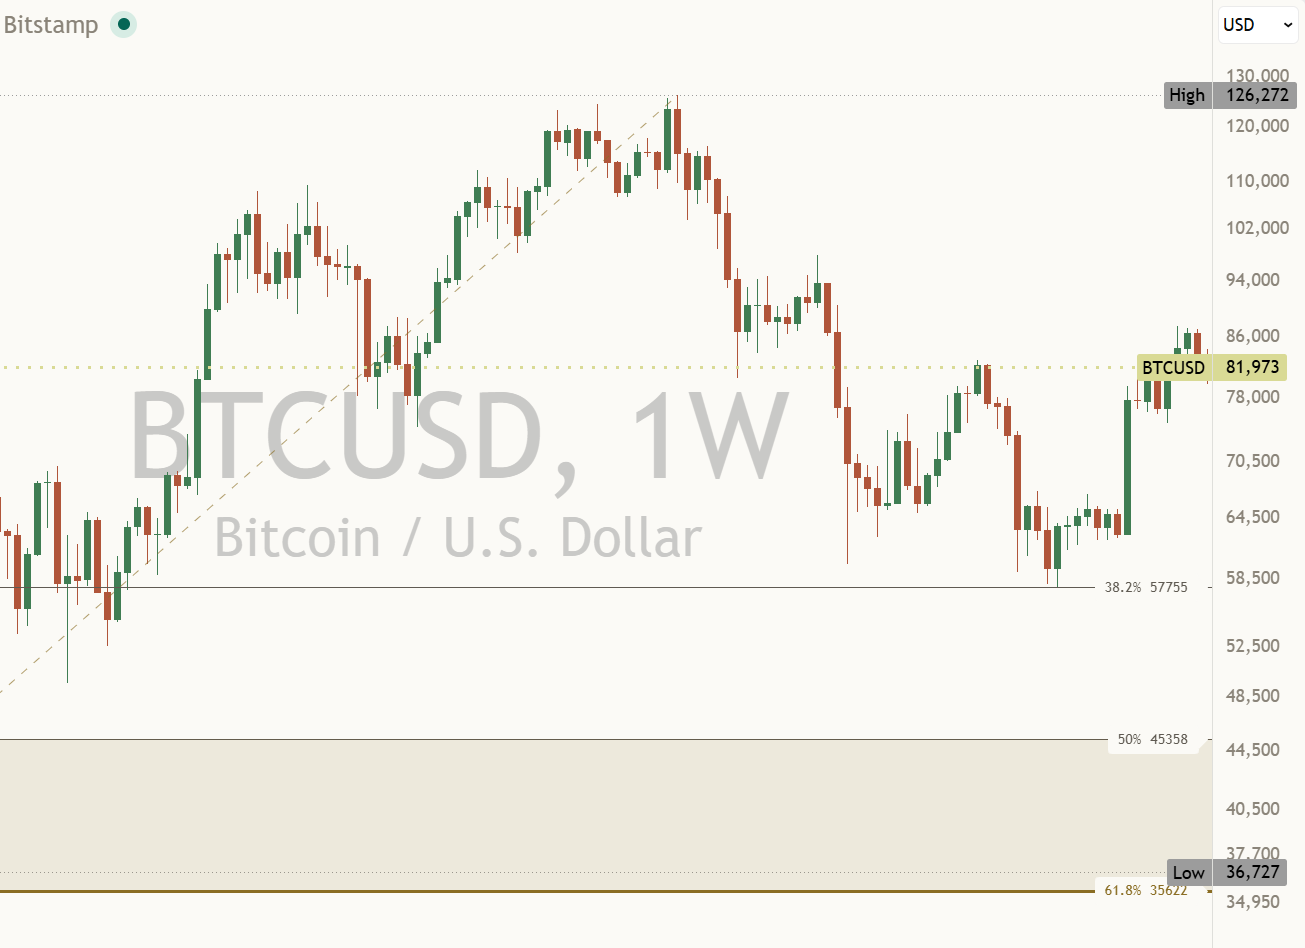
Honest limit: log scale only works with prices above zero. A tool should say so rather than draw something wrong.
12. Calendar ranges
Instead of a market swing, you can measure a calendar range: the high and low of the previous day, week, month, quarter or year. It is simple, and it is fixed for the whole period, so it never surprises anyone mid-period.
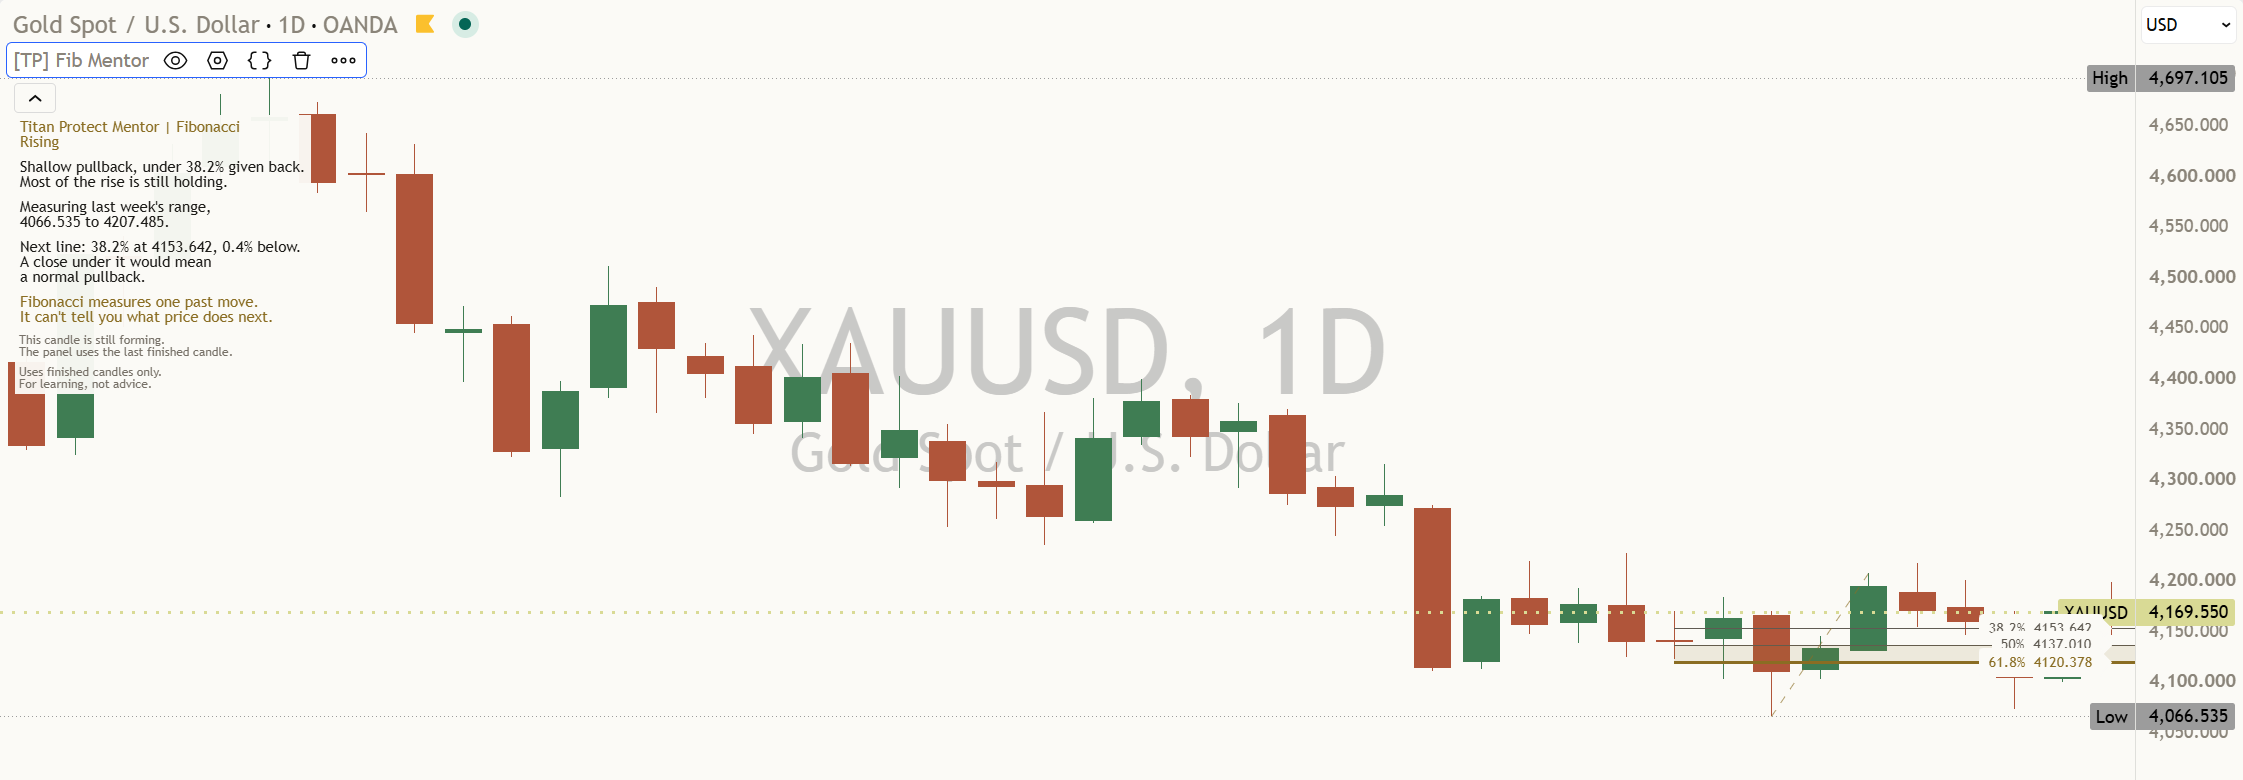
Honest limit: a calendar range is a date fact, not a market fact. Last week's high may have nothing to do with the move you care about.
13. Revisits, and counting honestly
It is tempting to remember the times a level "held" and forget the times it did not. Counting fixes that.
A fair count looks like this:
- A revisit is one stretch of finished candles touching a line, or close to it. Several candles in a row count as one revisit.
- Counting starts only once the lines could have been known, not from the swing itself.
- The count starts again when the lines move.
- The count is the sample. A count of one or three is one or three cases, which is thin evidence. Loaded history and swing settings can change it.
Honest limit: a count describes the past on the loaded chart. It is context, never a cue to act.
14. Why levels sometimes seem to work
Fibonacci lines can look uncanny on old charts. Three plain reasons explain most of it:
- Many eyes. Lots of traders watch the same lines, so some reaction near them is likely.
- Choice after the fact. On an old chart it is easy to pick the swing that makes the lines fit.
- Memory. The hits stick in the mind; the misses fade.
Honest limit: none of this means the lines are useless. It means a line is a place to pay attention, not a reason on its own.
15. Honest limits, all in one place
- Past move: every line is a proportion of a move that already happened.
- Swing choice: a different swing gives different lines. None is "the right one".
- Lag: a swing is known a few candles late.
- Moving lines: a newer swing moves the lines. Old lines were fair for their time.
- The zone: popular, so watched. Not a promise.
- Extensions: proportions, not destinations.
- Scale: linear and log give different lines on long moves.
- Counts: describe the loaded history only, and each count is a small sample.
- Neither direction is favoured: every rule works the same for up moves and down moves.
16. Six common traps
- Reading the lines without knowing which move they measure. Ask first.
- Treating a line as a place price must turn. It is a proportion of a past move.
- Picking the swing that fits after the fact. Use a rule.
- Turning on every level and extension at once. Three lines read better than ten.
- Trusting lines that keep moving. Wait for the swing to be confirmed.
- Remembering the hits and forgetting the misses. Count them, misses included.
17. Practise it
- Pick one market and one timeframe, and keep them for a few weeks.
- Use bar replay. Before each step, say out loud: which move are the lines measuring, between which two lines did the last candle close, and how far is the nearest one? Then step forward.
- When the lines move, write down why: which new swing formed?
- On a long move, compare linear and log lines. Note where they differ.
- Keep a one-line log per observation, including the times price ignored the lines.
Key takeaways
What to remember
- Fibonacci lines are proportions of one past move. The swing is the whole story.
- Wait for the candles after a swing to close, so the lines never move once drawn.
- Pick the swing by rule, not by what fits.
- Three lines read better than ten. Add more one at a time.
- The 50% to 61.8% zone is an area people study, not a promise.
- Read where price sits between lines, and the distance in percent.
- Counts describe the past, and a small count is a small sample.
18. See it explained live: [TP] Fibonacci - Mentor
Everything in this lesson is built into [TP] Fibonacci - Mentor, a free indicator on TradingView. It draws calm Fibonacci lines on your chart and talks you through them in plain English, so you can practise on live markets instead of from memory.
Here is where each part of the lesson shows up:
- Which swing (sections 3 to 5). With "Measure from" on Latest swing, the default, swings are found as in [TP] Market Structure - Mentor. "How large a swing" sets their size: Small swings (3), Medium swings (5, the default), Large swings (10) or Custom (2 to 50). The lines run from the main turning point of the trend to the latest swing the other way; before that turn exists, from the two newest opposite swings. The panel says when the lines were set: "A new swing showed up 2 candles ago, so the lines moved to it." Ten candles on, it names the move's size and prices.
- Finished candles only (section 4). The start and end of the move are only set once a candle closes, and the Full panel says why that takes time: "A turn is found 5 candles later, so it was not known at the time." While a candle is still forming, the panel says so: "This candle is still forming. The panel uses the last finished candle."
- The lines (sections 6 and 8). 38.2%, 50% and 61.8% by default; 23.6% and 78.6% are one switch each. The 61.8% line has a quiet gold accent and is one step heavier. Labels show Price + percent by default, rounded to the tick, lined up at the right edge ("Put labels on" Right).
- Where price sits (section 6). The panel leads with it: "Halfway zone, 50% to 61.8% given back. A pullback so far, not a breakdown." Then the next line: "Next line: 61.8% at 29748.2, 0.4% below. A close under it would mean a deep pullback." Hidden lines never count.
- The shaded zone (section 7). Light shading from 50% to 61.8% ("Shade the 50% to 61.8% zone"), on by default. The panel calls it the halfway zone.
- When the lines move (section 9). The lines move once the candle that confirms the new swing closes, and for the next 10 candles the panel says so, for example "A new swing showed up 1 candle ago, so the lines moved to it." On the first candle it reads "A new swing showed up on the last candle, so the lines moved to it." "Keep earlier sets of lines" keeps up to 3 old sets of lines as faint, dotted outlines with no labels; it is 0 by default.
- Extensions (section 10). 127.2%, 161.8%, 200% and 261.8%, each with its own switch, all off by default.
- Scale (section 11). "Price spacing": Linear (the default) or Logarithmic. On log, the panel says log spacing cannot be used when a price is not above zero.
- Calendar ranges (section 12). "Measure from" Previous period uses the last finished day, week, month, quarter or year (Week and Low to high by default): "Measuring last week's range, 4066.535 to 4207.485." Manual takes your own start and end: "Measuring your own move from 31061.2 to 29404.5."
- Revisits (section 13). With "Panel detail" on Full, the panel counts touches at 38.2%, 50% and 61.8%: "Returns since these lines were set: 38.2% 1, 50% 0, 61.8% 0. They show where price revisited a line." Then the limit: "Counts use the candles on your chart. Loading more candles or changing the swing size can change them." Counts start again when the lines move and never change a line colour.
- How to read the panel, top to bottom. It sits on the left of the price chart. Compact, the default: the header and direction ("Rise undone" or "Fall undone" once price is past the start), where price is and what it means, the move, the next line and what a close past it would mean, the limit, a note while a candle forms, and the footer: "Uses finished candles only. For learning, not advice." Full adds the counts, the confirmation detail and the loaded-history note. It never instructs.
- Alerts. They say what happened, after a candle closes, once per touch. Three are always in TradingView's alert dialog: "Price touched a Fibonacci line", "Price moved into another zone" and "Fibonacci lines moved to a new swing". Each name says what happened. Extra messages stay off until you switch on "Send live alert messages".
- Easier to read. A fixed, phone-safe text size, and "Panel colours" (in Colours) on Auto to match your chart, or force Light or Dark.
- Settings. The defaults are a good start. It is fine to change only the look.
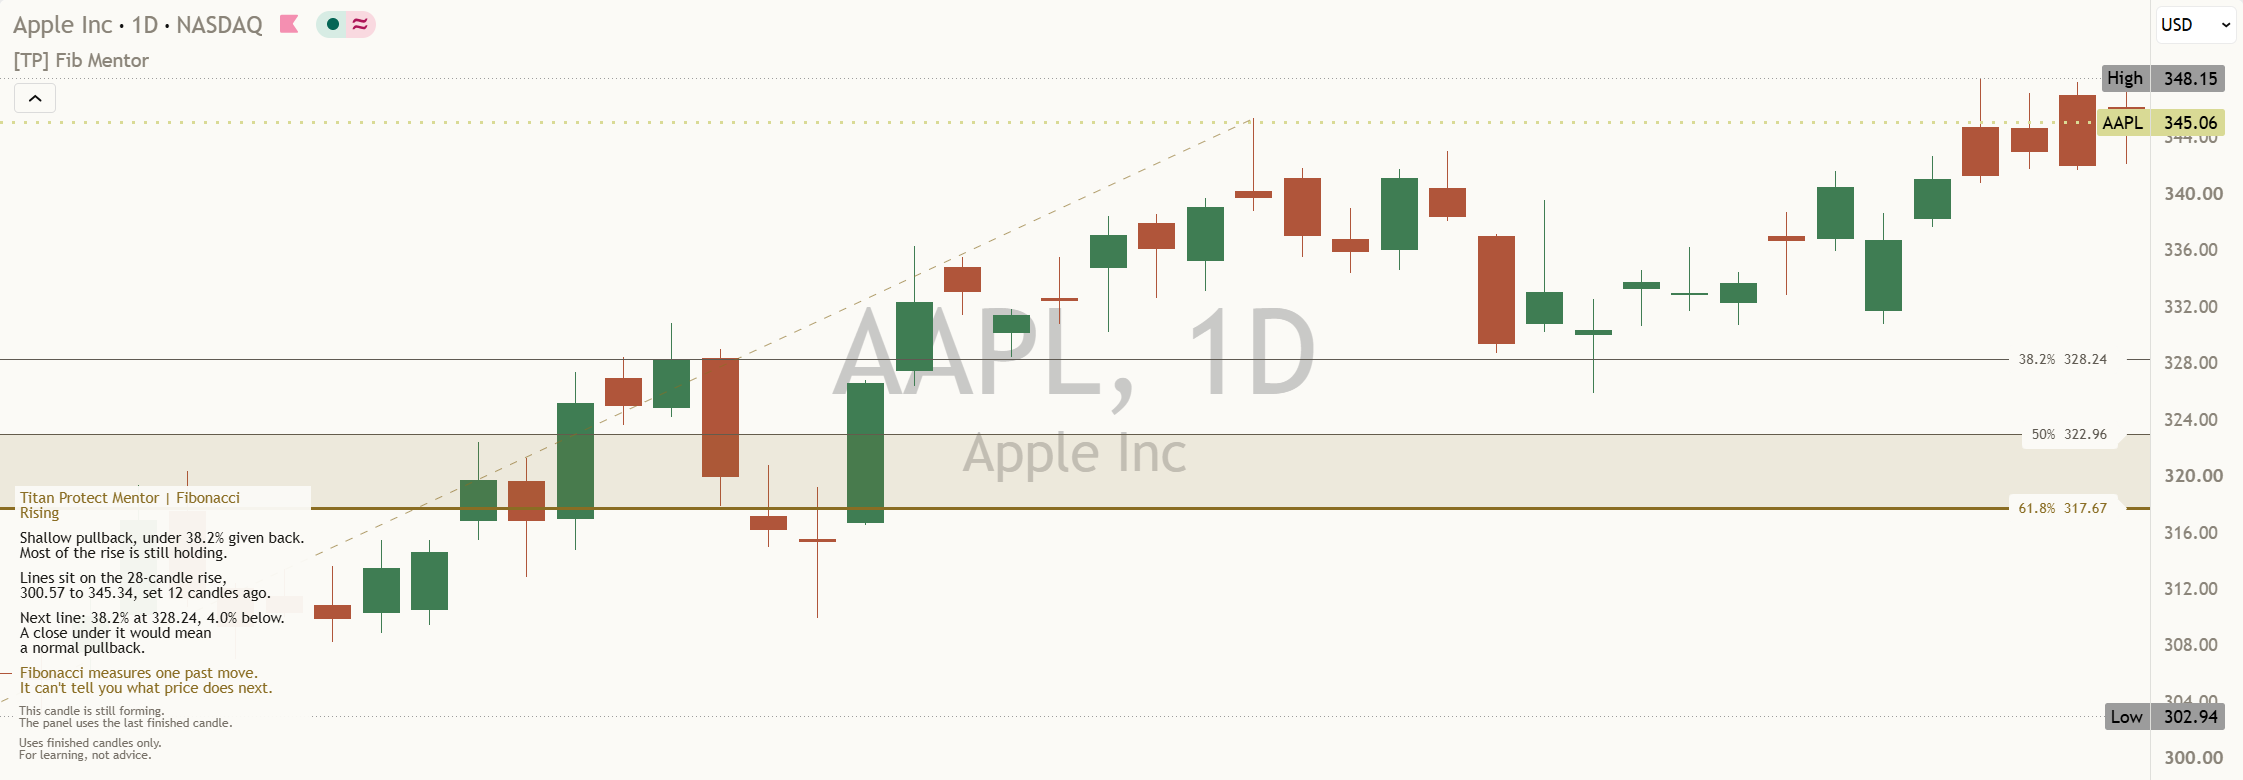
A good way to use it: turn on bar replay, add the Mentor, and read each bar yourself first. Which move are the lines measuring? Between which two lines did the last candle close? How far is the nearest one? Then check your read against the panel. Where you disagree is where you learn.
Test yourself
Take the 18-question quiz below to check what stuck.
Question 1 of 18 · Beginner
What do Fibonacci retracement lines measure?
Question 2 of 18 · Beginner
What is the first question to ask about any set of Fibonacci lines?
Question 3 of 18 · Beginner
Which of these levels is NOT a Fibonacci ratio?
Question 4 of 18 · Beginner
Price rose from 100 to 200. Where is the 50% retracement line?
Question 5 of 18 · Beginner
Why is a swing high always known a few candles late?
Question 6 of 18 · Intermediate
What is the honest trade-off of waiting for the candles after a swing to close?
Question 7 of 18 · Intermediate
Why pick the swing by a fixed rule rather than by eye?
Question 8 of 18 · Intermediate
What does the shaded zone from 50% to 61.8% describe?
Question 9 of 18 · Intermediate
On [TP] Fibonacci - Mentor at default settings, which lines are drawn?
Question 10 of 18 · Intermediate
Why does the Mentor give the 61.8% line a quiet gold accent?
Question 11 of 18 · Intermediate
A newer swing confirms. What should a trustworthy Fibonacci tool do?
Question 12 of 18 · Advanced
What is a 161.8% extension of an up move?
Question 13 of 18 · Advanced
A market went from 10 to 100. Why might logarithmic scale suit it better than linear?
Question 14 of 18 · Advanced
What is the honest limit of measuring the lines from last week's high and low?
Question 15 of 18 · Advanced
Which of these makes a revisit count honest?
Question 16 of 18 · Expert
Why can Fibonacci lines look uncanny on an old chart?
Question 17 of 18 · Expert
A candle is still forming and has moved through the 61.8% line. What does the Mentor go by?
Question 18 of 18 · Expert
The Full panel reads "Returns since these lines were set: 38.2% 3, 50% 0, 61.8% 0." What is the right way to read the 3 at 38.2%?
Educational interpretation only. Not financial advice. Fibonacci lines describe the proportions of a past move; it does not predict what price will do next.
Learn the idea here. Apply it with the desk.
Titan Protect turns lessons like this into a daily practice: live market research, the full framework, and the tools that put it to work. This lesson is free; the desk is where it compounds.