Reading Bollinger Bands and the squeeze: how quiet, how long, and what it cannot tell you
Look at any Bollinger Bands chart and say, in plain words, whether price is quiet or busy, whether a squeeze is on, how long it has lasted and how tight it is for that chart.
By the end of this lesson you will be able to look at any Bollinger Bands chart and say, in plain words, whether price is quiet or busy, whether a squeeze is on, how long it has lasted and how tight it is for that chart. You will also be able to read a squeeze as a quiet state rather than a forecast, and say why it can break up or down, or simply fizzle.
1. What Bollinger Bands are
Foundry lesson. Free, no gate. Page: /foundry/bollinger-bands/. Educational interpretation only. Not financial advice.
How to use this lesson at your level
- Beginner: sections 1 to 4 and the traps in section 15. Get the habit of asking "is price quiet or busy right now?"
- Intermediate: add sections 5 to 8. What a squeeze is, how strong, how long, and why narrow is relative.
- Advanced: sections 9 to 12. The push, the end of a squeeze, closes outside the bands, and finished candles.
- Expert: sections 13 and 14, plus the honest limit in every section. The skill is knowing what the bands cannot see.
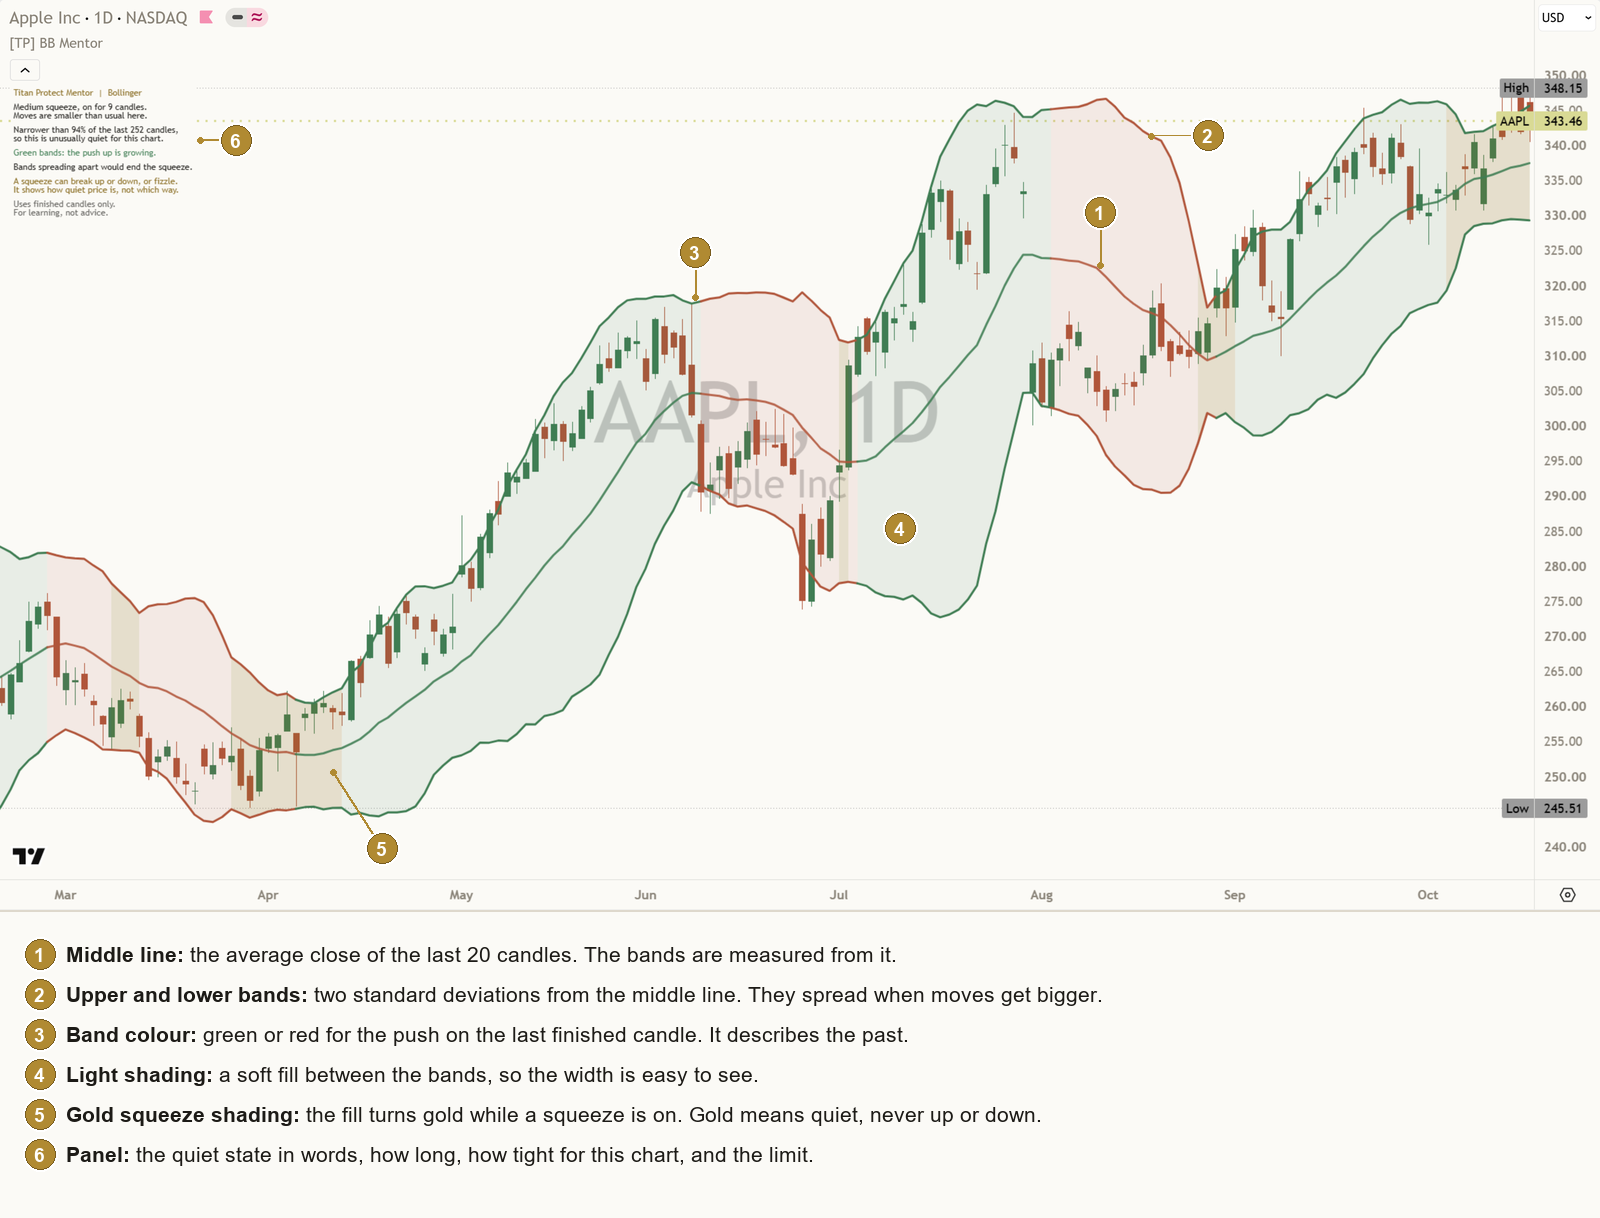
Bollinger Bands are three lines on a price chart.
- The middle line is the average close of the last 20 candles.
- The upper band sits a set distance above it.
- The lower band sits the same distance below it.
The distance is two standard deviations. Standard deviation is a measure of how spread out recent closes are. If the last 20 closes were all close together, it is small. If they jumped around, it is large.
So the bands are a picture of how much price has been moving lately. That is all they are.
Honest limit: the bands are built from past closes. They describe how much price moved, not where it goes next.
2. Why the bands spread and pinch
When price makes big moves, the closes spread out, the standard deviation grows, and the bands move apart. When price goes quiet, the closes bunch up and the bands pinch together.
The distance between the bands is often called the band width. A wide gap means a busy market. A narrow gap means a quiet one.
Honest limit: wide or narrow describes the recent past. A quiet market can stay quiet for a long time.
3. The bands are not walls
A common belief is that price "bounces" off the bands. Sometimes it turns near a band. Often it does not. In a strong, steady move, price can close near or outside one band for many candles in a row.
About 95% of closes fall inside two standard deviations only when price behaves like a neat bell curve. Markets often do not, so closes outside the bands are more common than that number suggests.
Honest limit: a touch of a band is a fact about one candle. It is not a reason on its own to expect a turn.
4. Quiet is a state, not a forecast
People watch quiet markets because quiet spells do not last forever. A very quiet stretch is often followed by a busier one.
But "busier" says nothing about which way. A quiet spell can end with a jump up, a jump down, or a slow fade back to normal with no real move at all.
Honest limit: knowing that price is quiet tells you about volatility, not direction.
5. What a squeeze is
"Squeeze" is a stricter name for a very quiet state. A common way to define it compares two channels:
- Bollinger Bands, which react quickly to how spread out the closes are.
- Keltner lines, a steadier channel built from the average candle range around a 20-candle average.
When the Bollinger Bands pinch so close that both bands sit inside the Keltner lines, a squeeze is on. When either band pushes back outside, the squeeze is over.
Honest limit: this is a definition people agree on, not a law. A different channel or setting gives a slightly different answer.
6. How strong, and for how long
Not every squeeze is equally tight. One clear way to grade it uses three Keltner distances:
- Mild: the bands fit inside a wide Keltner range (2.0 average ranges).
- Medium: they fit inside a closer one (1.5).
- Strong: they fit inside the closest one (1.0).
The other number that matters is how long. Count the finished candles since the squeeze began. A squeeze that has lasted 3 candles and one that has lasted 30 are different quiet spells.
Honest limit: a stronger or longer squeeze is a quieter spell. It is not a bigger promise.
7. Narrow is relative
A narrow band on one market can be normal on another. Gold, a currency pair and a small stock all have their own usual size of move. Even one market changes over the years.
So a useful habit is to compare the width with the same chart's own history. Rank today's width against, say, the last 252 candles (about a year of daily candles). A width narrower than 94% of the last 252 candles means this is one of the quietest stretches in that window, whatever the market.
Honest limit: the comparison depends on the window. A different number of candles, or a different timeframe, can give a different rank.
8. Quiet bands without a squeeze
The bands can be narrow for the chart without being inside the Keltner lines. That is a quiet state, short of a squeeze. It is worth naming separately, so that "narrow" and "squeeze" do not get mixed up.
The reverse also happens: a squeeze can be on while the width is only middling for the chart, because the Keltner lines are wide at that moment.
Honest limit: two measures of quiet can disagree. Neither is wrong; they measure different things.
9. The push: momentum, described
During a squeeze, many traders also look at momentum: whether price has been pushing up or down relative to its recent range, and whether that push is growing or easing.
This is useful context about the candles that already closed. It is easy to misread as a forecast. A push up during a quiet spell does not mean the quiet spell will end upward.
Honest limit: momentum describes the last finished candles. It changes often, and it says nothing certain about the next move.
10. When a squeeze ends
A squeeze ends when the bands spread back outside the Keltner lines. Moves are getting bigger again. People often call this a squeeze "firing".
The end of a squeeze tells you the quiet spell is over. It does not tell you which way the new move goes, how far it goes, or whether it lasts. Some squeezes end with a burst. Some end with a twitch and drift back into quiet.
Honest limit: after a squeeze ends, the only fact is that the bands opened up.
11. Closes outside the bands
A close above the upper band or below the lower band means that candle moved further than the recent usual range. In a quiet market that can be the first sign the quiet spell is ending. In a strong move it can happen again and again.
Honest limit: one close outside a band is one candle's fact, not a cue to act.
12. Finished candles only
A candle that is still forming can change until it closes. The bands over it move with every tick. A squeeze can appear and vanish inside one candle.
An honest reading uses finished candles only. The live candle can be drawn so you see it, but the state, the count and any alert wait for the close.
Honest limit: waiting for the close costs a little time. In return, a reading never changes after the fact.
13. Why squeezes seem to work
Squeezes can look uncanny on old charts. Three plain reasons explain most of it:
- Hindsight. On an old chart you see the squeezes that ended in a big move. The ones that fizzled are easy to skip past.
- Base rates. Quiet spells end eventually, so some move after a squeeze is likely. Its direction is not.
- Memory. The dramatic cases stick in the mind; the dull ones fade.
Honest limit: none of this makes squeezes useless. It makes a squeeze a reason to pay attention, not a reason on its own.
14. Honest limits, all in one place
- Past closes: the bands describe how much price moved, not where it goes.
- Not walls: price can sit near or outside a band for many candles.
- No direction: a squeeze can break up or down, or fizzle.
- Relative: narrow depends on the market, the window and the timeframe.
- Definitions: a squeeze depends on the channels and settings used.
- Momentum: the push describes finished candles only.
- Live candles: a forming candle can change everything until it closes.
- Neither direction is favoured: every rule works the same for up and down.
15. Six common traps
- Treating a squeeze as a promise of a big move. It is a quiet state. It can fizzle.
- Guessing the direction from the squeeze. The squeeze has no direction.
- Reading the bands as walls. Price can close outside them and stay there.
- Judging narrow by eye, the same way on every chart. Compare with the chart's own history.
- Reading the live candle as if it had closed. Wait for the close.
- Remembering the squeezes that ran and forgetting the ones that faded. Count them all.
16. Practise it
- Pick one market and one timeframe, and keep them for a few weeks.
- Use bar replay. Before each step, say out loud: is price quiet or busy, is a squeeze on, for how many candles, and how narrow is it for this chart? Then step forward.
- Every time a squeeze ends, write down how: a jump up, a jump down, or a fade.
- After 20 squeezes, look at your notes. How many went each way, and how many fizzled?
Key takeaways
What to remember
- Bollinger Bands show how much price has been moving lately. They pinch when price goes quiet.
- A squeeze is a strict quiet state: the bands sit inside the Keltner lines.
- Name how strong the squeeze is and how long it has lasted.
- Narrow is relative. Compare the width with the same chart's own history.
- A squeeze can break up or down, or fizzle. It has no direction.
- Read finished candles only.
- Counting how past squeezes played out on one chart is history, not a forecast. Under 12 squeezes, there is no lean.
17. See it explained live: [TP] Bollinger Bands - Mentor
Everything in this lesson is built into [TP] Bollinger Bands - Mentor, a free indicator on TradingView. It draws standard Bollinger Bands on your chart and talks you through them in plain English, so you can practise on live markets instead of from memory.
Here is where each part of the lesson shows up:
- The bands (sections 1 to 3). The middle line averages 20 candles ("Candles for the middle line") and each band sits 2.0 standard deviations away ("Distance from the middle line"). At these defaults they match TradingView's built-in Bollinger Bands. A light fill sits between them ("Shade between the bands").
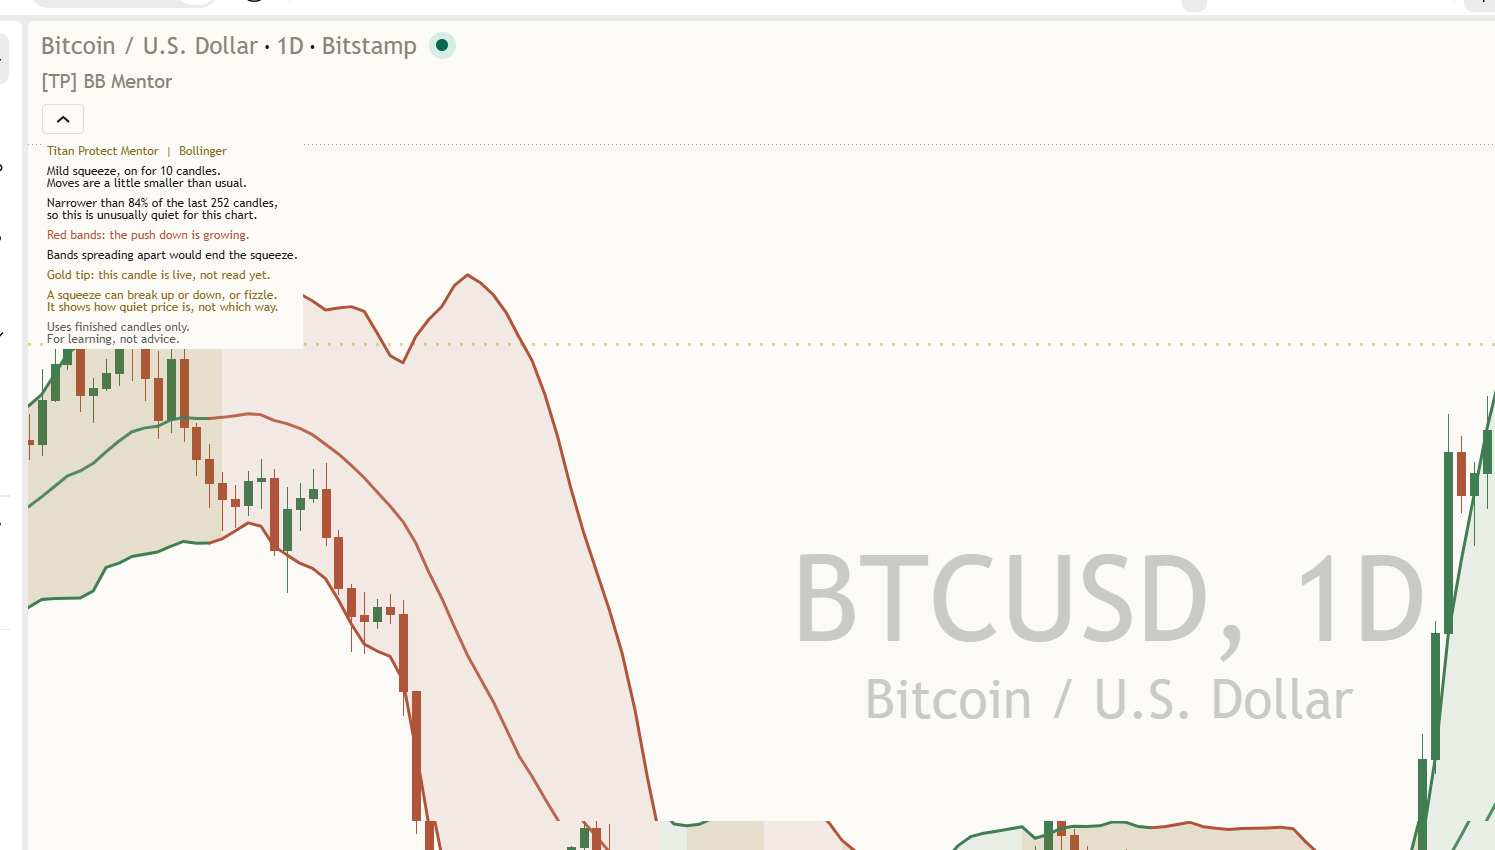
- The squeeze (sections 5 and 6). When both bands sit inside the Keltner lines, the fill turns gold and the panel counts the candles. On the Bitcoin daily chart on 17 Oct it read: "Bands are tight: a squeeze, 10 candles." The Keltner lines themselves are off by default ("Show Keltner lines").
- Narrow is relative (section 7). The width is ranked against the last 252 candles on your chart ("Candles to compare"). The bands count as close together at or below 20% ("Call the bands close below") and far apart at or above 80% ("Call the bands far apart above"). The rank is in the Data Window as "Tighter than recent candles".
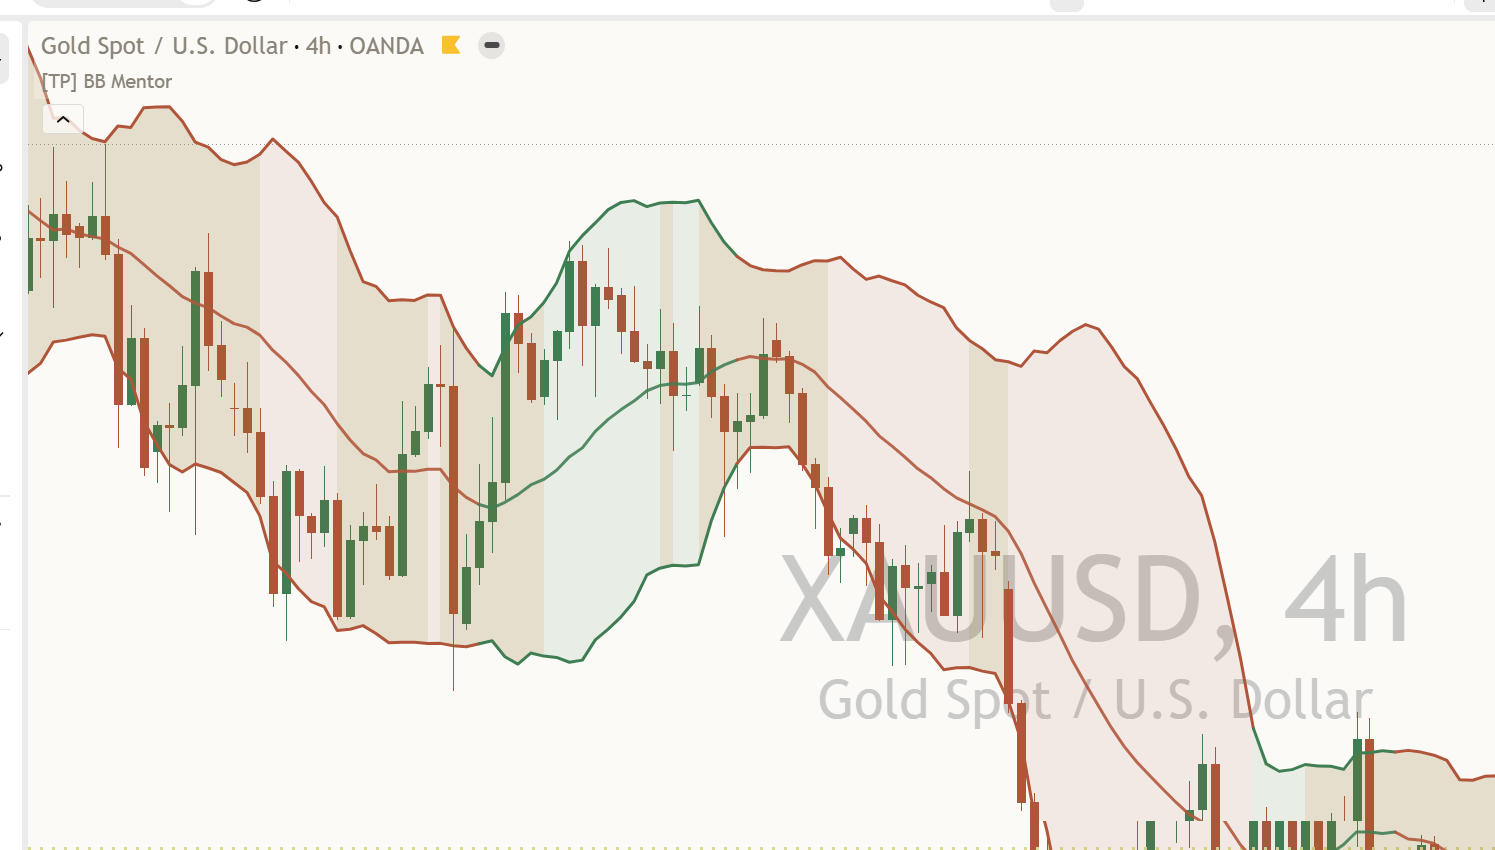
- Quiet without a squeeze (section 8). When no squeeze is on, the first line names the width for this chart: "No squeeze: bands are narrow.", "No squeeze: bands at a normal width." or "No squeeze: bands are wide apart."
- The push (section 9). The bands are green or red for the push on the last finished candle. It describes the past candle only.
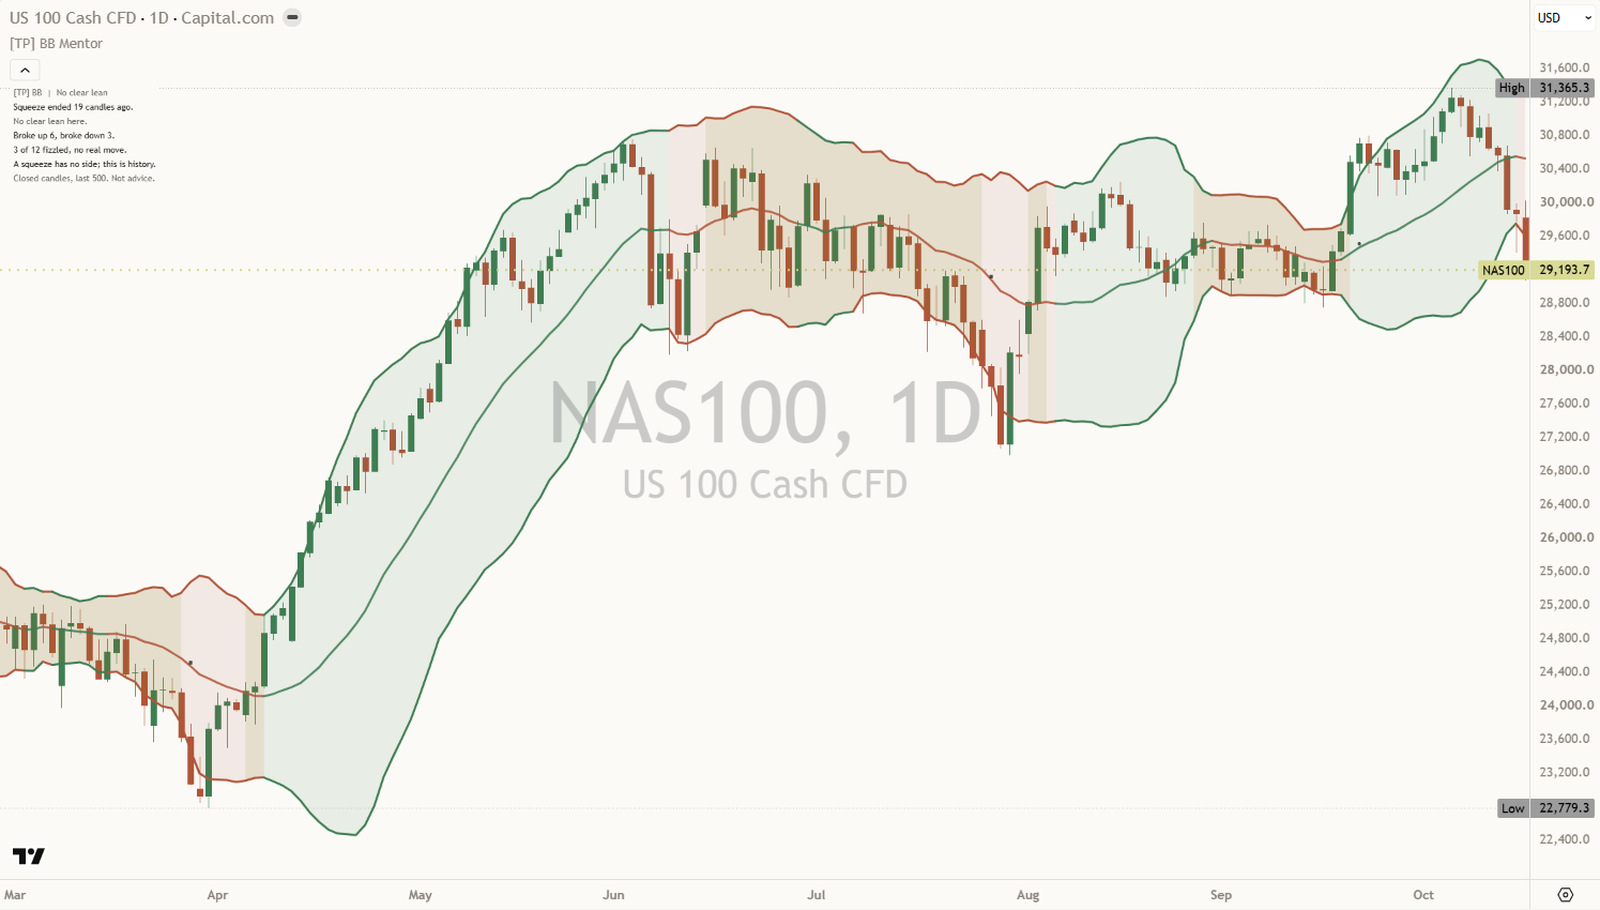
- When a squeeze ends (section 10). The panel watches the next 10 finished candles ("Squeeze ended. Measuring 10 candles."), then gives the age, as on the NAS100 daily chart: "Squeeze ended 19 candles ago."
- Closes outside the bands (section 11). A close above or below the squeeze range is what the Mentor counts as a break. A close outside a band is a fact about one candle.
- Finished candles only (section 12). While a candle forms, the bands over it are drawn in a muted gold tip. The panel and every alert wait for the close: "Closed candles, last 500. Not advice."
- The limit (sections 4, 10 and 14). A teaching line keeps it plain, for example "A squeeze has no side; this is history."
- How to read the panel, top to bottom. Compact: the header with the lean ("[TP] BB | No clear lean"), the quiet state, the count from this chart and the other side ("No clear lean here." then "Broke up 6, broke down 3."), the squeezes that fizzled ("3 of 12 fizzled, no real move."), a teaching line and the footer. Full adds the middle band's slope ("Neutral: the middle band is rising."), what would change the read ("Changes if: a new squeeze starts.") and the legend for the marks.
- Alerts. Four, each after a candle closes: "A squeeze started", "A squeeze ended", "Bollinger Bands became close" and "Bollinger Bands are no longer close". Each message ends with the same limit.
- Easier to read. "Colours" on Auto matches your chart, or force Light or Dark. "Where to put the panel" on Auto picks the emptiest corner and prefers the left. "Panel text size" is Tiny by default.
- Settings. The defaults are a good start. It is fine to change only the look.
This chart's own history
The Mentor keeps a record of this chart. Each time a squeeze of 5 candles or more ends, it watches the next 10 finished candles and notes one of three results, marked on the chart where the squeeze ended: ● broke up (a close above the squeeze range first), ■ broke down (a close below it first), ○ fizzled (neither).
The panel then counts them. When one side clearly leads, the line reads like this: "Leans up: 8 of 12 broke up here." That means 12 finished squeezes were counted on this chart and 8 of them broke up. The next line always gives the other side, worded the same way: "Other way: 3 of 12 broke down." When neither side leads clearly, it says "No clear lean here." and shows both, as on the NAS100 daily chart: "Broke up 6, broke down 3." When most squeezes fizzled, it says "Sideways: more caution here."
Under 12 squeezes there is no lean, because a handful of cases can look one-sided by chance. On the AAPL daily chart it read "Too few here to count yet (6)." Every count is history from this chart, not a forecast of the next squeeze.
A good way to use it: turn on bar replay, add the Mentor, and read each candle yourself first. Is price quiet or busy? Is a squeeze on, and for how long? How narrow is it for this chart? When a squeeze ends, note whether price breaks up, breaks down or fizzles within 10 candles, then check the mark when it appears. Where you disagree is where you learn.
Test yourself
Take the 20-question quiz below to check what stuck.
Question 1 of 20 · Beginner
What do Bollinger Bands show?
Question 2 of 20 · Beginner
The bands have pinched close together. What does that tell you?
Question 3 of 20 · Beginner
What is the middle line of standard Bollinger Bands?
Question 4 of 20 · Beginner
Price has closed near the upper band for several candles in a row during a steady rise. What is the honest read?
Question 5 of 20 · Beginner
Which sentence describes a squeeze honestly?
Question 6 of 20 · Intermediate
In a common definition, when is a squeeze on?
Question 7 of 20 · Intermediate
Why compare band width with the same chart's own history?
Question 8 of 20 · Intermediate
Today the bands are narrower than on 94% of the last 252 candles on this chart. What does 94% mean here?
Question 9 of 20 · Intermediate
On [TP] Bollinger Bands - Mentor, what does gold shading between the bands mean?
Question 10 of 20 · Intermediate
The panel reads "Bands are tight: a squeeze, 10 candles." Which statement is right?
Question 11 of 20 · Intermediate
The bands are narrow for the chart, but they are not inside the Keltner lines. How does the Mentor describe it?
Question 12 of 20 · Advanced
During a squeeze the bands are green: on the last finished candle, price pushed up against its recent range. What is the honest read?
Question 13 of 20 · Advanced
A squeeze has just ended and the bands are opening up. What do you know for sure?
Question 14 of 20 · Advanced
The last finished candle closed above the middle line, inside the bands. How should you read it?
Question 15 of 20 · Advanced
A candle is still forming and the bands over it are drawn in a muted gold tip. What does the Mentor go by?
Question 16 of 20 · Expert
Why can squeezes look uncanny on an old chart?
Question 17 of 20 · Expert
You change "Candles to compare" from 252 to 100. Why might the panel's first line change from "No squeeze: bands are narrow." to another width?
Question 18 of 20 · Expert
You log 20 squeezes on one chart: 7 ended with a jump up, 6 with a jump down, and 7 faded out. What is the right takeaway?
Question 19 of 20 · Intermediate
A panel reads "Leans up: 8 of 12 broke up here." and then "Other way: 3 of 12 broke down." What does that tell you?
Question 20 of 20 · Intermediate
On the AAPL daily chart the panel read "Too few here to count yet (6)." Why no lean?
Educational interpretation only. Not financial advice. Bollinger Bands describe how much price has moved; they do not say which way it moves next.
Learn the idea here. Apply it with the desk.
Titan Protect turns lessons like this into a daily practice: live market research, the full framework, and the tools that put it to work. This lesson is free; the desk is where it compounds.