Reading MACD: which way momentum is going, which side of zero, and why it always trails price
Look at any MACD pane and say, in plain words, which way momentum is going, whether it is building or easing off, which side of zero MACD is on, and whether the column you are reading has finished.
By the end of this lesson you will be able to look at any MACD pane and say, in plain words, which way momentum is going, whether it is building or easing off, which side of zero MACD is on, and whether the column you are reading has finished. You will also be able to read MACD as momentum that has already happened, and say why it always trails price.
1. What MACD measures
Foundry lesson. Free, no gate. Page: /foundry/the-macd/ (existing key, replaced in place). Educational interpretation only. Not financial advice.
How to use this lesson at your level
- Beginner: sections 1 to 5 and the traps in section 15. Get the habit of putting the last column into words.
- Intermediate: add sections 6 to 9. Finished candles, the lag, the bigger picture and flat momentum.
- Advanced: sections 10 to 12. Differences between price and MACD, turns and crosses, and what the settings change.
- Expert: sections 13 and 14, plus the honest limit in every section. The skill is knowing what MACD cannot see.
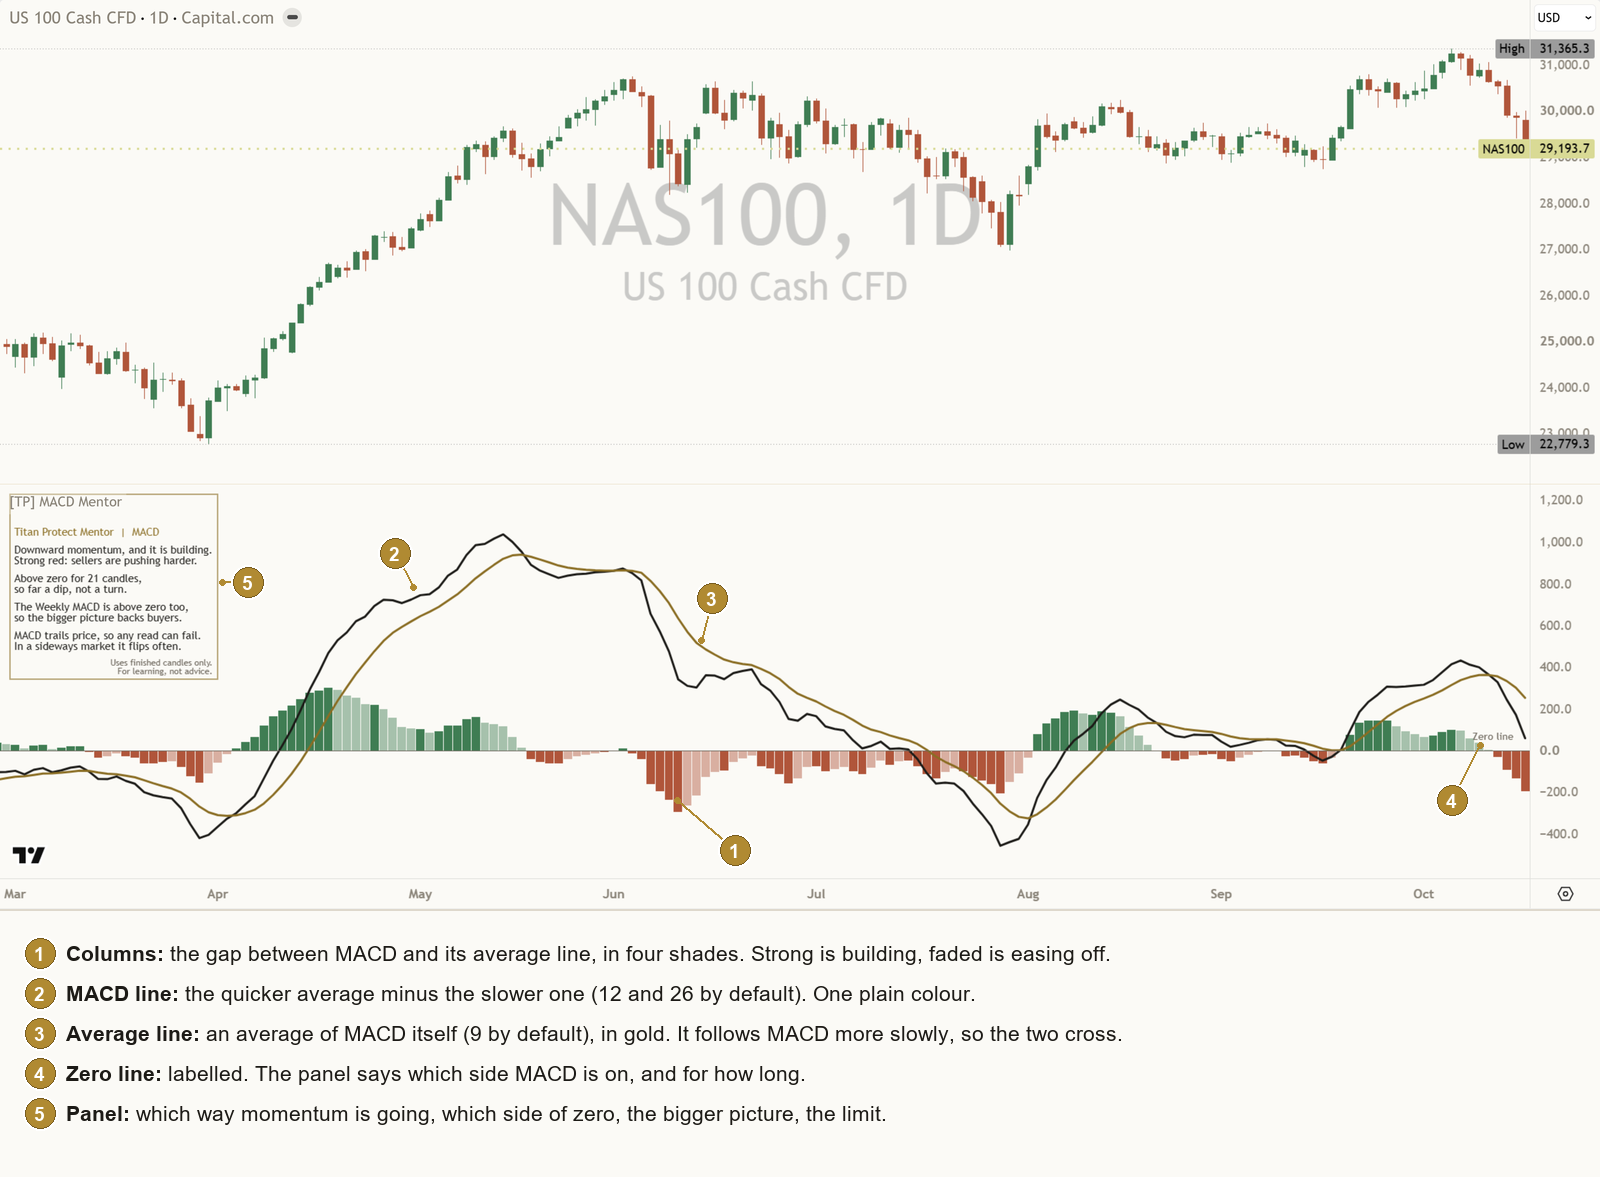
MACD measures momentum: how fast price has been moving, and whether that pace is picking up or slowing down. It does this with averages of price, so it is a summary of the recent past.
The name stands for moving average convergence divergence. In plain words: two averages of price, and whether they are moving apart or coming together.
Honest limit: MACD describes momentum that already happened. It does not know what price does next.
2. The MACD line: two averages and a gap
Take two averages of the closing price. A quicker one follows the last 12 candles. A slower one follows the last 26. (See Moving averages.)
The MACD line is the quicker average minus the slower one.
- When price has been rising, the quicker average sits above the slower one, so MACD is above zero.
- When price has been falling, the quicker average sits below, so MACD is below zero.
- When the two averages pull apart, MACD moves away from zero. When they come back together, it moves toward zero.
Honest limit: both inputs are averages, so the MACD line is smooth and late. Smooth is easy to read. Late is the price you pay.
3. The average line
Now take an average of MACD itself, usually over 9 candles. That is the average line. It follows MACD more slowly, so the two lines cross from time to time.
When MACD is above its average line, momentum has been improving lately. When it is below, momentum has been getting weaker.
Honest limit: the average line is an average of an average. It is the latest of the three things MACD draws.
4. The columns: four shades
The columns show the gap between MACD and its average line. A column above its zero means MACD is above its average line. A column below means MACD is below it.
Four shades make the read quick:
- Strong green: above, and the gap is growing. Upward momentum is building.
- Faded green: above, but the gap is shrinking. Upward momentum is easing off.
- Strong red: below, and the gap is growing. Downward momentum is building.
- Faded red: below, but the gap is shrinking. Downward momentum is easing off.
Faded is not the same as turned. A faded green column is still green.
Honest limit: the shade tells you what the last finished candle did to the gap. It does not tell you what the next one will do.
5. Two zeros, two reads
This is the part that trips people up. MACD has two different "zero" questions:
- The columns' zero: is MACD above or below its average line? That gives the colour.
- The zero line: is the MACD line itself above or below zero? That gives the side.
They can disagree. Red columns while MACD is still above zero mean momentum has slowed inside an up move. That is a dip so far, not a turn. Green columns while MACD is still below zero are the mirror: a bounce so far, not a turn.
A useful habit is to say both reads out loud, with how long MACD has been on its side. For example: "Red columns, getting stronger, but MACD has been above zero for 21 candles: so far a dip, not a turn."
Honest limit: "so far" matters. A dip can become a turn. The zero line only tells you which side MACD is on now.
6. Finished candle, live candle
A column on a candle that is still open changes with every tick. It can turn red and back to green before the candle closes. Reading it as if it had closed is one of the commonest MACD mistakes.
The honest habit is to read the last finished column and treat the live one as unknown. Some tools draw the live column in a different colour, so you can see at a glance that it is not final.
Honest limit: waiting for the close costs time. That delay is the price of a read that does not change after you see it.
7. Why MACD always trails price
MACD is built from averages, and an average needs the candles that make it up. So MACD always moves after price does. By the time the columns change shade, price has often already moved.
In a sideways market, this gets worse. Price goes up a little, down a little, and MACD flips back and forth behind it. Each flip looks like news, and most of them are not.
Honest limit: no setting removes the lag. Shorter lengths react faster and flip more. Longer lengths flip less and react later.
8. The bigger picture
The same chart at a longer candle length can say something different. A daily chart may show momentum fading while the weekly MACD is still above zero.
A simple habit is to check one longer length, using only its last finished candle, and say whether it agrees. Two examples:
- Agrees: the weekly MACD is above zero too, so the bigger picture backs the up side.
- Disagrees: the daily MACD is still below zero while a four-hour chart is above, so the four-hour move is against the bigger picture.
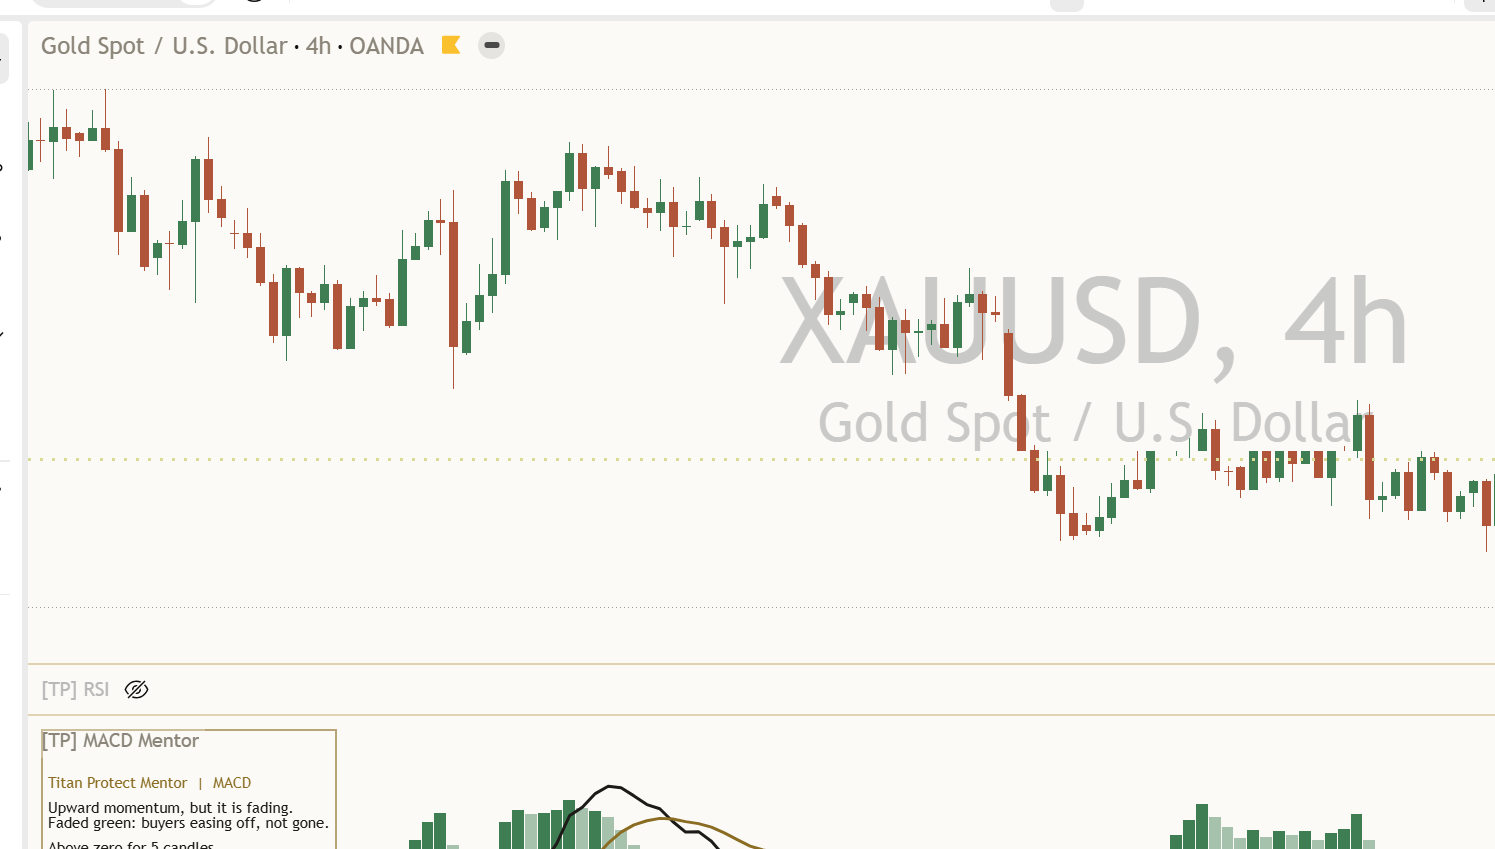
Honest limit: the bigger picture adds context, not certainty. It trails price even more, because its candles are longer.
9. When momentum is flat
Sometimes the columns barely change. A colour alone says very little then. Two counts help:
- How long it has been flat: how many finished candles in a row the columns have hardly moved.
- How choppy it has been: how many times the columns changed direction in the last 20 finished candles. A handful is quiet. Six or more is choppy, and reads whipsaw.
Honest limit: flat is not a forecast. It can end in either direction.
10. Price and MACD differences
Sometimes price and MACD disagree at their turns. Price makes a lower low, but MACD makes a higher low: the push down had less force the second time. The mirror is a higher high in price with a lower high in MACD. Many traders call this divergence.
Two rules keep it honest:
- Finished turns only. A low is only a low once the candles after it have closed higher. So a difference can only be drawn a few candles late, and then it should never move. (See Market structure.)
- Evidence, not proof. A difference can last a long time in a strong trend, and price can ignore it.
Honest limit: a difference is a reason to look closer. It does not say when, or whether, price turns.
11. Turns and crosses
Three events get attention on MACD:
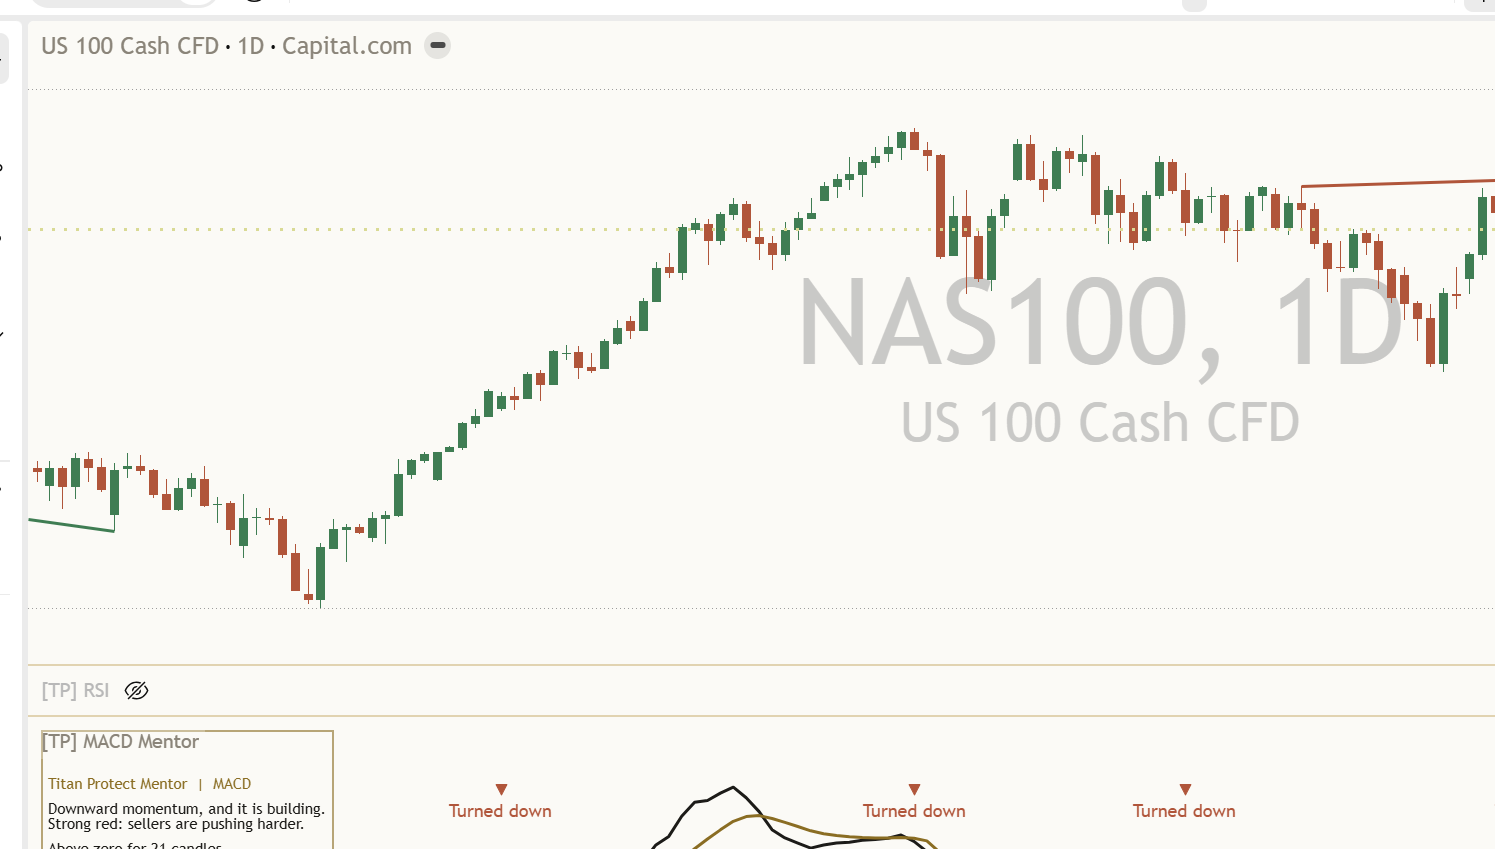
- A turn in the columns: they switch from growing to shrinking, or the other way round. A change of pace, not proof of a trend.
- MACD crossing its average line: the columns change colour.
- MACD crossing zero: the quicker average moves past the slower one.
Each one happens after price has moved, for the reasons in section 7. Counting them in a sideways market shows how often they flip.
Honest limit: every cross is a description of the last candle. None of them is an instruction.
12. What the settings change
The classic settings are 12, 26 and 9, with exponential averages (EMA), which give more weight to recent candles. Simple averages (SMA) weigh every candle the same.
- Shorter lengths: react sooner, flip more often.
- Longer lengths: flip less, react later.
- EMA or SMA: EMA reacts a little sooner. Neither is "right".
The same chart with different settings gives different reads. That is not an error. They measure different paces.
Honest limit: tuning the settings to fit an old chart makes it look better on that chart only.
13. Why MACD sometimes seems to work
On an old chart, MACD crosses often look well timed. Three plain reasons explain most of it:
- Hindsight. On an old chart you see where price went, so the good crosses stand out.
- Trends. In a long trend, MACD stays on one side and looks right for weeks.
- Memory. The well-timed crosses stick in the mind; the flips in sideways markets fade.
Honest limit: none of this means MACD is useless. It means a column is a description of momentum, not a reason on its own.
14. Honest limits, all in one place
- Past momentum: MACD summarises candles that already closed.
- Lag: it always trails price, and the bigger picture trails more.
- Sideways markets: it flips often, and most flips are noise.
- Live candle: the open column can change until the close.
- Two zeros: the colour and the side can disagree. Read both.
- Differences: evidence, not proof, and they can last in a strong trend.
- Settings: different lengths give different reads. None is the right one.
- Neither direction is favoured: every read works the same way up and down.
15. Six common traps
- Reading a red column as a turn while MACD is still above zero. Check the side.
- Reading the live column. Wait for the close.
- Treating faded as reversed. Faded means easing off, not gone.
- Forgetting the lag. The columns turn after the move starts.
- Trusting every cross in a sideways market. Count the flips first.
- Remembering the good crosses and forgetting the rest. Count them, misses included.
16. Practise it
- Pick one market and one timeframe, and keep them for a few weeks.
- Use bar replay. Before each step, say out loud: is the last finished column strong or faded, green or red? Which side of zero is MACD on? Does the longer length agree? Then step forward.
- When the columns change shade, write down what price did in the candles before it.
- On a sideways stretch, count the flips.
- Keep a one-line log per observation, including the times the read was wrong.
Key takeaways
What to remember
- MACD is a gap between two averages of price. It describes momentum that already happened.
- The columns show MACD against its average line, in four shades: building or easing, up or down.
- The zero line is a second read. Red columns above zero are a dip so far, not a turn.
- Read only finished candles. The live column can change until the close.
- MACD always trails price, and it flips often in a sideways market.
- A difference between price and MACD is evidence, not proof.
- Counting how past turns played out on one chart is history, not a forecast. Under 8 turns, there is only a tally.
17. See it explained live: [TP] MACD - Mentor
Everything in this lesson is built into [TP] MACD - Mentor, a free indicator on TradingView. It draws the classic MACD in its own pane and talks you through it in plain English, so you can practise on live markets instead of from memory.
Here is where each part of the lesson shows up:
- The MACD line and the average line (sections 2 and 3). 12, 26 and 9 by default, EMA or SMA for each ("Method for the two averages", "Method for the average line"). The MACD line is plain ink. The average line is gold.
- The columns (section 4). Four shades by default ("Show four-shade columns"). Strong means the gap is growing, faded means it is shrinking.
- Two zeros (section 5). The panel counts two kinds of turn: MACD crossing below its average line while above zero, and the mirror below zero. The Full panel names the last one and how long ago, for example "Turned down above zero, 3 candles ago."
- Finished candles only (section 6). The column on the candle still open is gold and is not read. A turn joins the count only after its 20 candles have closed. Every read, mark and alert waits for the close.
- The lag (section 7). One of the panel's teaching lines says it plainly: "MACD trails price; this is past history."
- The bigger picture (section 8). "Show the bigger picture" is on by default and uses only the last finished candle of one longer length (Weekly on a daily chart, on Auto). "Draw the bigger-picture line" adds it as a quiet stepped line; it is off by default. The panel does not give it a line.
- Flat momentum (section 9). "Flat change allowance" sets how small a column change still counts as flat.
- Differences (section 10). "Show price and MACD differences" is off by default. When on, it draws a line in the pane and on price after both turns are finished (5 candles each side). The panel does not count them.
- Turns and crosses (section 11). "Show momentum turns" is off by default. When on, it marks where the columns change direction, at most once every 20 candles each way. Eight alerts cover the crosses, the turns and the differences, each after the candle closes.
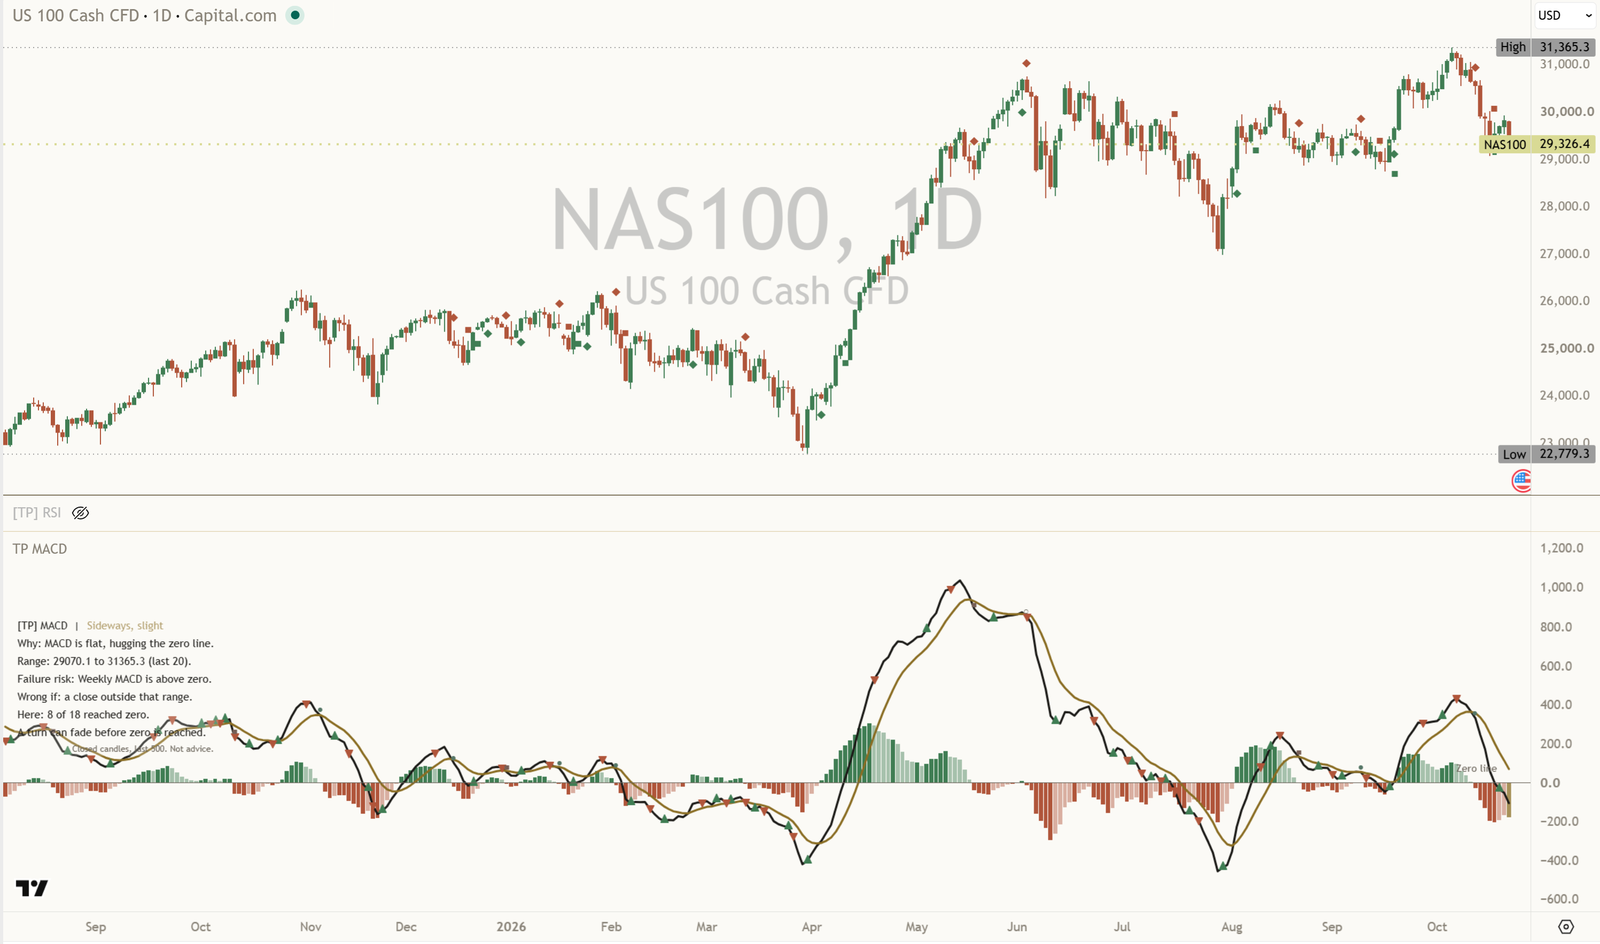
- How to read the panel, top to bottom. It sits at the top left of the MACD pane by default. Standard: the header always gives a read, Up, Down or Sideways, with how strong it is: slight, moderate or strong (on a NAS100 1-hour replay: "[TP] MACD | Up, moderate"). Under it, a Why line says what the read rests on ("Why: above zero and above its average line."), one risk line names what could break it or turn it flat ("Failure risk: higher high, lower MACD high."), and a Wrong if line gives the price where the read would be wrong ("Wrong if: a close below 30123.7."). A Sideways read also shows its range, and its Wrong if is a close outside it (NAS100 daily, 22 Oct 2026: "[TP] MACD | Sideways, slight", "Why: MACD is flat, hugging the zero line.", "Range: 29070.1 to 31365.3 (last 20).", "Wrong if: a close outside that range."). Then how many past turns reached zero on this chart ("Here: 7 of 12 reached zero."), a teaching line, and the footer: "Closed candles, last 500. Not advice." Every number in it comes from this chart. The read changes only after 2 closes in a row, and on the close before, the risk line says a change is coming. Strength is how much of this MACD's evidence agrees on this chart, not a forecast. Full adds the last turn, what backs the read, and the legend for the marks. It never prints a MACD number and never instructs.
- Easier to read. "Panel colours" on Auto matches your chart, or force Light or Dark. "Panel text size" goes from Tiny to Large; Small is the default.
- Settings. The defaults are a good start. It is fine to change only the look.
This chart's own history
The Mentor keeps a record of this chart. Each time MACD turns, it follows that turn for 20 finished candles and notes one of three results, marked on the chart where the turn happened: ● reached zero, ■ turned back across its average line first, ○ neither.
The panel then counts how many reached zero. On the AAPL weekly chart it read "Here: 5 of 19 reached zero." So 19 turns of this kind were counted on that chart, and 5 of them reached zero within 20 candles; the marks show the ones that turned back first or did neither. That count is history. The header read comes from where MACD is now, and its strength says how much of the evidence agrees.
Under 8 turns the panel only says how many it has, because a handful of cases can look one-sided by chance. On the EURUSD 1-hour chart it read "Too few here to count yet (6)." Every count is history from this chart, not a forecast of the next turn.
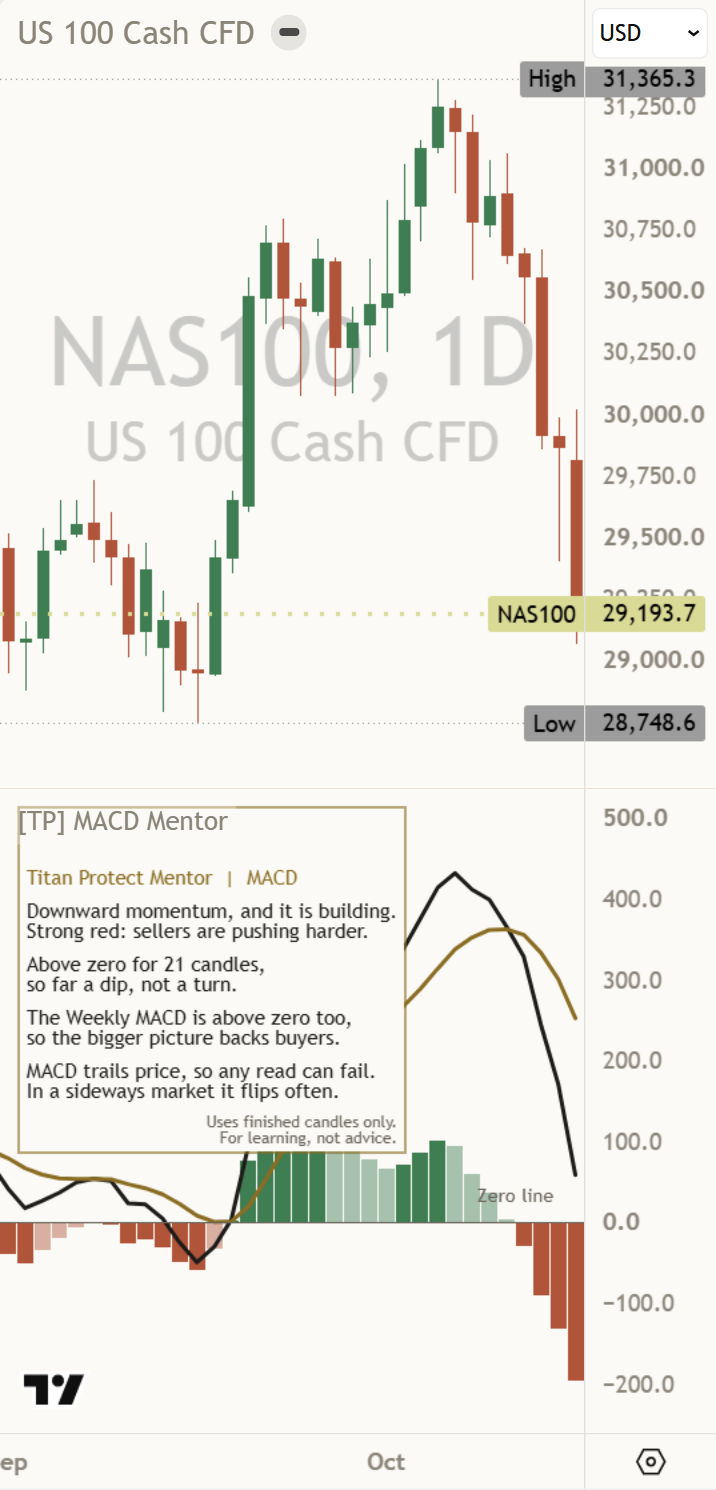
A good way to use it: turn on bar replay, add the Mentor, and read each finished column yourself first. Which way is momentum going? Is it building or easing off? Which side of zero is MACD on? When MACD crosses its average line, note whether it reaches zero or turns back within 20 candles, then check the mark when it appears. Where you disagree is where you learn.
Test yourself
Take the 20-question quiz below to check what stuck.
Question 1 of 20 · Beginner
What is the MACD line?
Question 2 of 20 · Beginner
MACD is above zero. What does that tell you?
Question 3 of 20 · Beginner
What do the MACD columns show?
Question 4 of 20 · Beginner
A column is faded green. What is the plain read?
Question 5 of 20 · Beginner
The columns are strong red, but the MACD line is still above zero. What is the best plain read?
Question 6 of 20 · Intermediate
Why does MACD always trail price?
Question 7 of 20 · Intermediate
The newest column belongs to a candle that is still open. How should you treat it?
Question 8 of 20 · Intermediate
What happens to MACD in a sideways market?
Question 9 of 20 · Intermediate
On [TP] MACD - Mentor, where does the bigger picture come from?
Question 10 of 20 · Intermediate
On a four-hour chart the bigger-picture line shows the Daily MACD below zero, while the four-hour MACD is above zero. What does that add?
Question 11 of 20 · Intermediate
The MACD columns have barely moved for 2 candles, and they changed direction only once in the last 20. What does that mean?
Question 12 of 20 · Advanced
Price makes a higher high, but MACD makes a lower high. What is the honest read?
Question 13 of 20 · Advanced
Why should a difference between price and MACD only use finished turns?
Question 14 of 20 · Advanced
What does a momentum turn in the columns tell you?
Question 15 of 20 · Advanced
You shorten the MACD lengths from 12 and 26 to 6 and 13. What changes?
Question 16 of 20 · Expert
Why do MACD crosses often look well timed on an old chart?
Question 17 of 20 · Expert
Why is "so far a dip, not a turn" a better way to say it than "only a dip"?
Question 18 of 20 · Expert
One of the Mentor's teaching lines is "MACD trails price; this is past history." How should you use that line?
Question 19 of 20 · Intermediate
On the AAPL weekly chart the panel read "Here: 5 of 19 reached zero." What does that tell you?
Question 20 of 20 · Intermediate
On the EURUSD 1-hour chart the panel read "Too few here to count yet (6)." Why no count?
Educational interpretation only. Not financial advice. MACD describes momentum that has already happened; it does not say what price will do next.
Learn the idea here. Apply it with the desk.
Titan Protect turns lessons like this into a daily practice: live market research, the full framework, and the tools that put it to work. This lesson is free; the desk is where it compounds.