Volume profile: where the volume was, and what the edges actually did
Look at any chart and say, in plain words, where the last finished period's volume sat, where its busiest price and value edges are, and what happened when price came back to those edges.
By the end of this lesson you will be able to look at any chart and say, in plain words, where the last finished period's volume sat, where its busiest price and value edges are, and what happened when price came back to those edges. You will also be able to read a count of past returns on your own chart, both outcomes side by side, and say why a value edge is a record of past trade, not a floor or a ceiling.
1. The idea in one sentence
Foundry lesson. Free, no gate. Page: /foundry/volume-profile/. Educational interpretation only. Not financial advice.
How to use this lesson at your level
- Beginner: sections 1 to 5 and the traps in section 17. Get the habit of reading a profile as a record of where volume was.
- Intermediate: add sections 6 to 10. Finished profiles, both edges, the return and its three outcomes.
- Advanced: sections 11 to 13. Titan research, this chart's count, and what the header says.
- Expert: sections 14 to 16, plus the honest limit in every section. The skill is knowing what a count of the past cannot tell you.
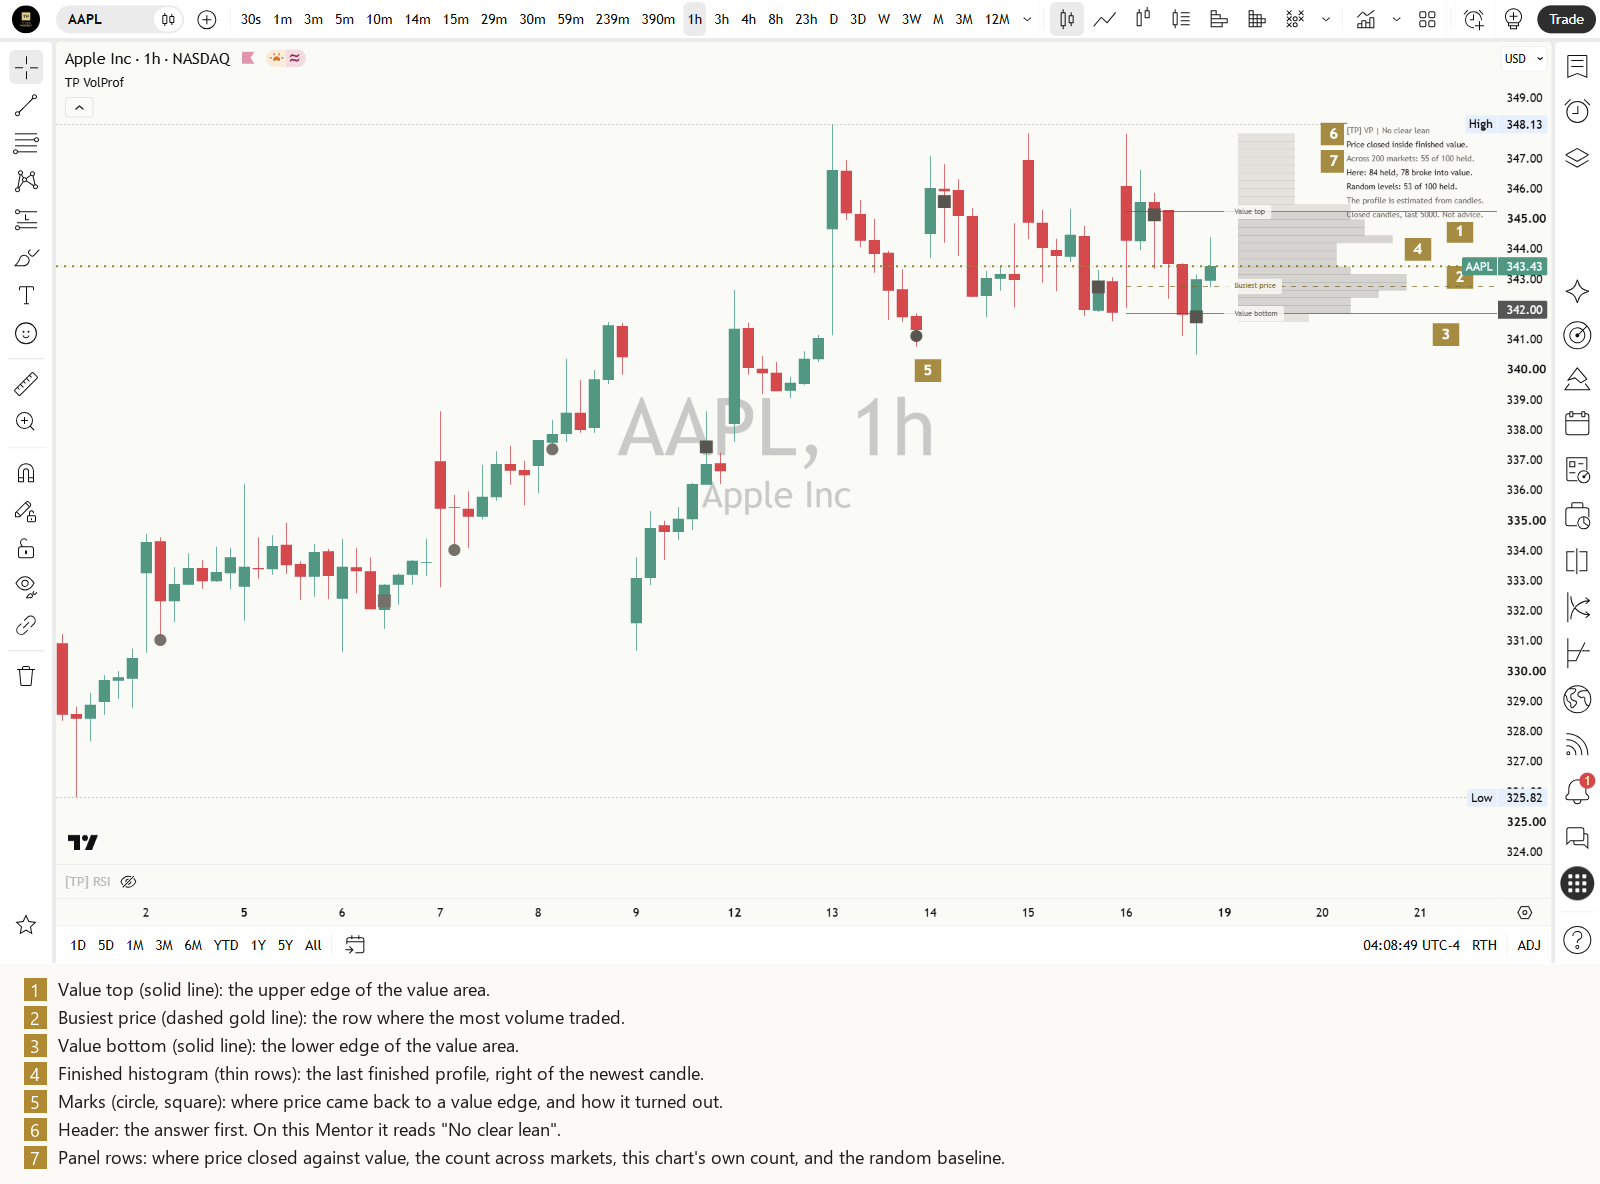
A volume profile counts how much volume changed hands at each price during one stretch of trading, and draws it sideways. Ordinary volume bars answer "how much traded in this candle?". A profile answers "how much traded at this price?".
That is the whole idea. The rows show where trading was heavy and where it was light. They do not show who traded, or why. See Reading volume for volume itself.
Honest limit: a profile describes where volume was in the past. It does not say where price goes next.
2. Busiest price
The row with the most volume is the busiest price. Many tools call it the point of control, or POC. It is simply the price where the most business was done in that period.
Honest limit: a busy price shows past trade only. Nobody is obliged to trade there again.
3. The value area and its edges
Start at the busiest row and keep adding the bigger of the two neighbouring rows until the band holds 70 of every 100 units of the period's volume. That band is the value area. Its upper edge is the value top (often written VAH) and its lower edge the value bottom (VAL).
Honest limit: 70 is a convention, not a law. A value area of 60 or 80 gives different edges from the same candles.
4. Busy shelves and thin gaps
Some profiles have a second bump, a busy shelf, and some have a quiet dip between busy areas, a thin gap. Price often crossed a thin gap quickly in the period that made it, which is why the gap is thin.
Honest limit: a thin gap records that price passed through quickly before. It does not mean it will again.
5. Built from candles, not from every trade
A chart tool usually builds the profile from the chart's own candles. It knows each candle's high, low and volume, but not where inside the candle the volume happened. So it shares each candle's volume evenly across the rows its range touched. On forex and many CFD feeds the volume is tick volume, a count of price updates, not shares or contracts.
Honest limit: a candle-built profile is an estimate. Finer candles give a better estimate. Some feeds have no volume at all, and then there is no profile.
6. Read a finished profile
Many tools draw a profile over the last so many candles. Every new candle shifts it, so the busiest price you saw yesterday is somewhere else today. A cleaner habit is to read a finished period: the last finished session on an intraday chart, the last finished week on a daily chart. Its lines do not move until the next period finishes.
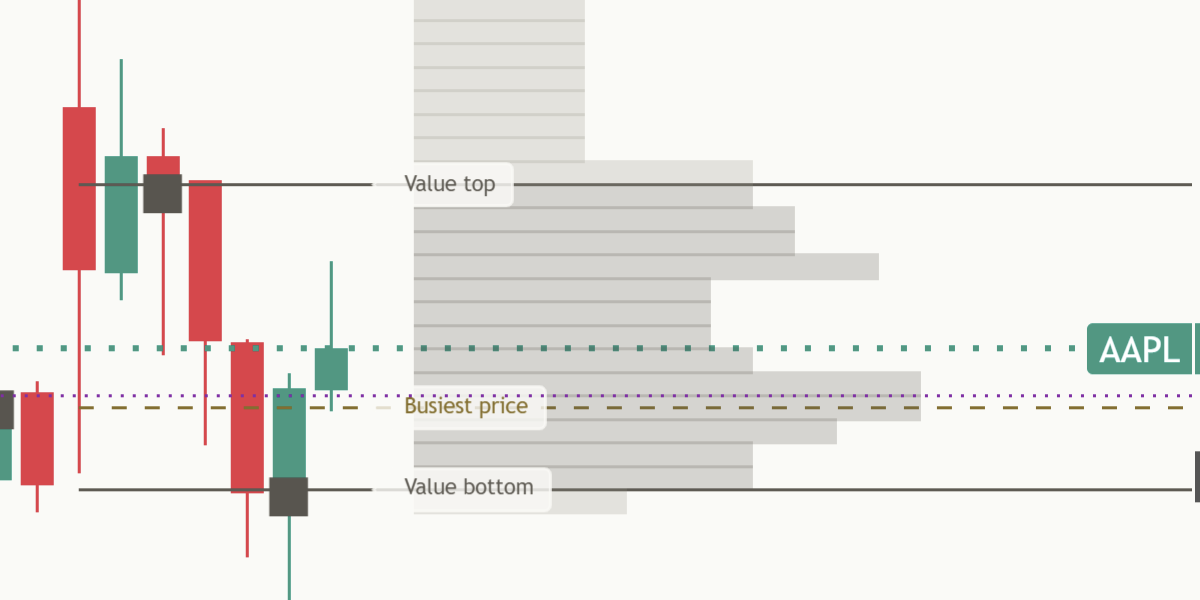
Honest limit: a finished profile is always one period old. That is the price of lines that hold still.
7. Two edges, read separately
Price coming down to the value top from above and price coming up to the value bottom from below are mirror situations. Read them, and count them, separately.
Honest limit: a mirrored rule treats both edges fairly. It does not mean they behave alike on a given chart.
8. The usual claim
Most profile tools and many lessons say the value edges act as support and resistance: price "respects" them. That is a claim you can check. You only need to count what price did each time it came back.
Honest limit: a line that looks important on a chart is not the same as a line that changed what price did.
9. A return to an edge
A return to the value top: the previous candle closed above it, and this finished candle's low reaches it, or comes within a tenth of a typical candle. A return to the value bottom is the mirror. Each edge counts once per period, and only one return is watched at a time, so the same candles are never counted twice.
Honest limit: price often never comes back to an edge within the period. Those edges add nothing to the count.
10. Three outcomes over ten candles
From the candle after the return, watch ten finished candles. For the value top (mirror everything for the value bottom):
- Held: a candle closes at least half a typical candle back above the level.
- Broke through: a candle closes at least half a typical candle below the level.
- No clear move: neither happens within the ten candles.
A typical candle here is ATR, the average true range over the last 14 candles, fixed on the return candle. See the ATR lesson. Only closes decide, and every unclear case goes to no clear move, never to held.
Honest limit: ten candles and half a typical candle are choices. Other choices sort the same returns differently.
11. Titan research: what we found when we tested value edges offline
We tested this rule on 198 to 200 markets offline. This is our research, not something the indicator reads on your chart.
We ran that exact test on 200 markets on one-hour charts (the last year) and 198 markets on daily charts (since 2020), and ran the same test again from random price levels inside the prior period's range, as a fair comparison:
| Chart | Edge | Held, in 100 | Broke through, in 100 | Random levels held, in 100 |
|---|---|---|---|---|
| One hour | Value top | 54 | 45 | 53 |
| One hour | Value bottom | 55 | 45 | 53 |
| Daily | Value top | 55 | 45 | 53 |
| Daily | Value bottom | 51 | 48 | 53 |
On both one-hour and daily charts the edges did about the same as random levels, within 2 in 100 either way. That is why we do not claim that value edges act as a floor or a ceiling.
Honest limit: this is our offline history from many markets. The indicator does not show it, and it says nothing certain about the next return on your chart.
12. Reading the panel's count
Every number on the panel comes from the chart it sits on. On AAPL one hour at the value bottom (read 19 Oct 2026 from the published script) it shows this chart's own count, both outcomes side by side: "Here: 84 held, 78 broke into value."
Read it as one thought: on this chart 84 returns held and 78 broke into value, out of 162. That is close to even. None of the 162 did neither, so the no clear move line is left out. When some do, it appears under the count, as on MSFT daily (read 18 Oct 2026): "Here: 209 held, 162 broke into value." then "1 of 372 had no clear move." Under 8 settled returns the chart's own line says "Too few here to count yet (n)." with the number so far, and the no clear move line is left out.
Honest limit: this chart's count is a small sample. It never changes the header, and a few lucky returns can tilt it.
13. When there is no lean, say so
The header reads "[TP] VP | No clear lean" on every chart and every timeframe. The panel does not pick a side for you. The chart's own line shows held and broke into value side by side, and the weighing is yours. That is the design, not a gap in the tool.
Honest limit: "no clear lean" is not "bad". It means the panel leaves the call to you and your chart.
14. Why the counts are history, not promises
- Small samples. 162 returns on one chart (AAPL one hour, 19 Oct 2026) is a small sample, and a few lucky returns can tilt it.
- One chart, one setting. Another timeframe, row count or value share gives different lines and different counts.
- Markets change. What a value edge did on this chart last year can differ from what it does next.
- The window rolls. As old returns drop out, this chart's count can shift with nothing new on the chart.
Honest limit: counts are the most honest summary of the past. They are still only the past.
15. What changing the settings does
- Profile period: a session, a week or a month gives different lines.
- Price rows: more rows give a finer profile and can move the busiest price.
- Value area share: a wider share pushes the edges further apart.
- The timeframe: each timeframe builds its own profile from its own candles.
Honest limit: changing settings until an old chart looks clean makes it look better on that chart only.
16. Honest limits, all in one place
- A profile is a record: it shows where volume was, not who traded or why.
- Built from candles: an estimate, and tick volume on forex and CFD feeds.
- Finished profiles only: always one period old.
- Closes decide: a wick decides nothing.
- Value edges: records of past trade, not floors or ceilings.
- Counts: history, not a promise.
- Neither edge is favoured: both are read the same way, mirrored.
17. Six common traps
- Treating a value edge as a floor or a ceiling. It is a record of past trade, and the count on your chart shows how often price broke into value.
- Reading a profile that is still being built. Its lines will move.
- Forgetting the estimate. A candle-built profile cannot see inside a candle.
- Counting every touch. Only the first return per period is counted.
- Reading only one side of the count. "Held" means little without "broke into value" beside it.
- Telling a story about the busiest price. It records past trade only.
18. Practise it
- Pick one market and one timeframe and keep them for a few weeks.
- At the start of each period, say out loud where price is against the last finished value: above, inside or below.
- When price comes back to an edge, note it, then watch ten candles. Held, broke through, or no clear move?
- Keep a one-line log per return, including the ones that did not go the way you expected.
- After a dozen returns, compare your own log with the panel's count on the same chart.
Key takeaways
What to remember
- A volume profile shows how much volume traded at each price in one period.
- The busiest price and the value top and bottom are records of past trade, not walls.
- Read a finished profile, so its lines do not move under you.
- A return to an edge is judged on closes over ten candles: held, broke through or no clear move.
- The panel's count comes from your chart only: read held and broke into value side by side.
- The counts are history, not promises.
19. See it explained live: [TP] Volume Profile - Mentor
Everything in this lesson is built into [TP] Volume Profile - Mentor, a free indicator on TradingView. It draws the last finished profile on your price chart and talks you through it in plain English, so you can practise on live markets instead of from memory.
Here is where each part of the lesson shows up:
- The profile (sections 1 to 5). Three named lines at the right edge, "Value top", "Busiest price" and "Value bottom", whose tooltips give the short names VAH, POC and VAL. "Show finished histogram" draws the rows to the right of the newest candle. "Show busy shelf and thin gap" adds the optional pair.
- Finished profiles (section 6). "Profile period" on Auto uses the last finished session on intraday charts, week on daily charts and month on weekly charts.
- Both edges and the return (sections 7 to 10). While a return is being watched, a gold ring at the Mark size says "Still open, not counted yet". Then "Mark past events" puts a filled circle for held, a square for broke through and a hollow ring for no clear move, centred on the level itself on the return candle, in one neutral ink. "Mark size" sets how big they are (Normal by default). The last 12 stay on the chart, and the older half of them is drawn in a fainter shade so the newest returns stand out.
- The counts (sections 12 and 13). The header always reads "[TP] VP | No clear lean". Then this chart's own count such as "Here: 84 held, 78 broke into value." (AAPL one hour, 19 Oct 2026), and "1 of 372 had no clear move." when any did neither (MSFT daily, 19 Oct 2026). The panel shows no figures from other markets; our offline research (section 11) stays in the lesson.
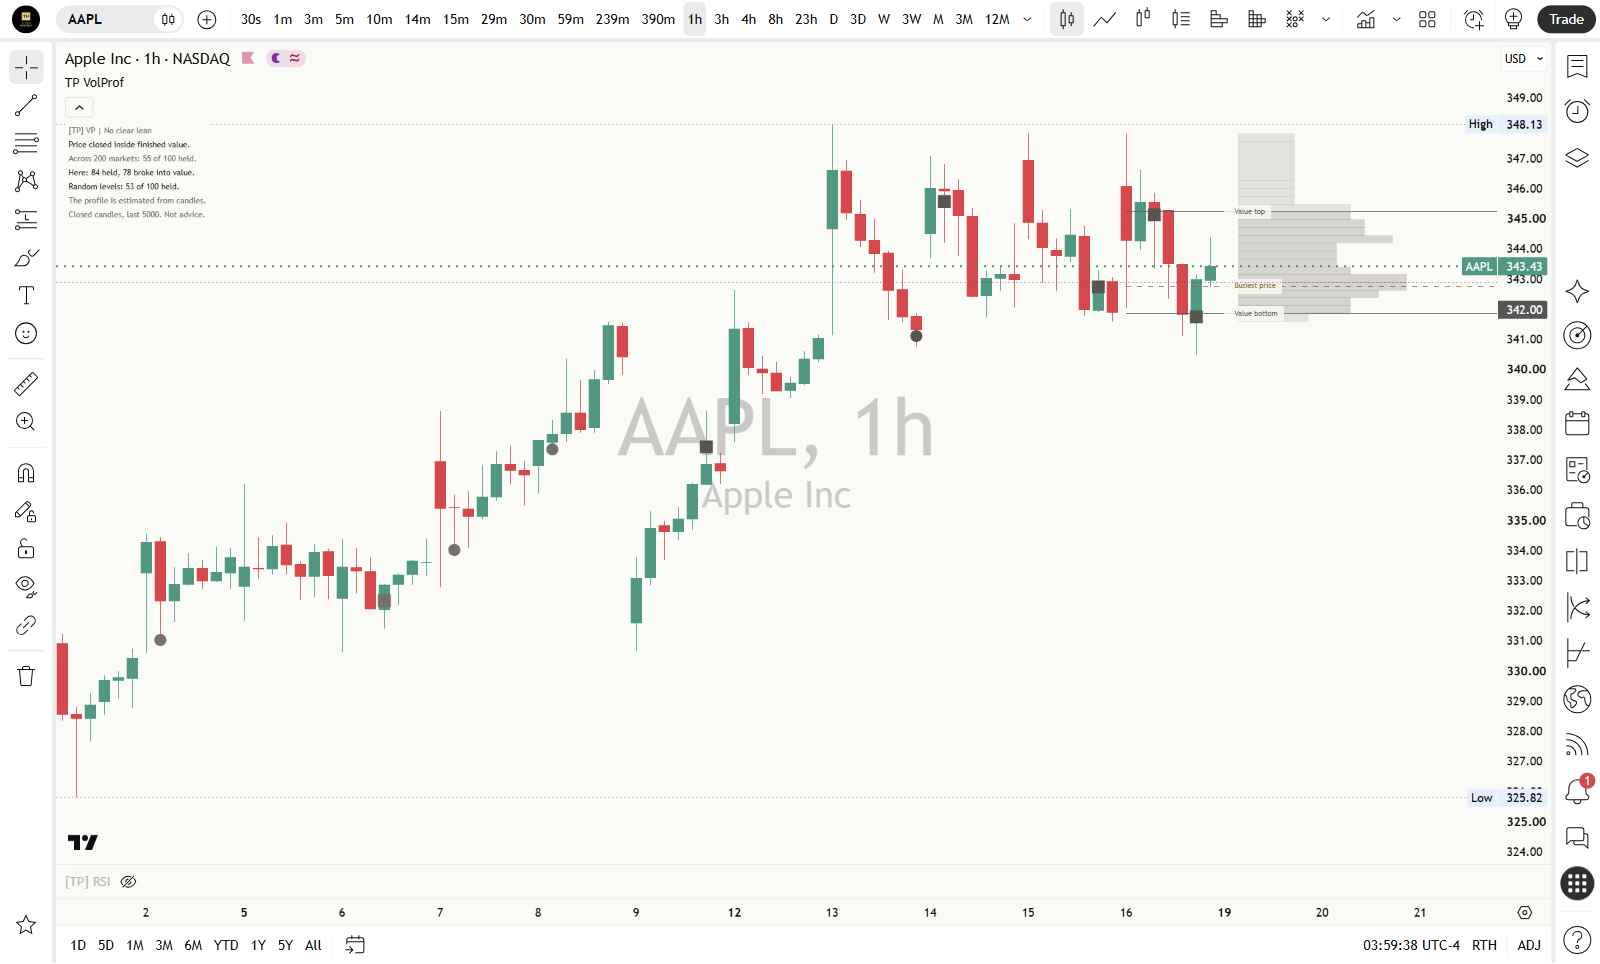
- On the chart at the top of this lesson, AAPL one hour (read 19 Oct 2026 from the published script, last candle 16 Oct), the panel read "Price closed inside finished value." then "Here: 84 held, 78 broke into value."
- How to read the panel, top to bottom. The header, where price closed against value, the count here, how many had no clear move (left out when none did), one teaching line such as "The profile is estimated from candles.", and the footer: "Closed candles, last 5000. Not advice." It never prints a % sign and never instructs.
- Easier to read. "Colours" on Auto matches your chart. "Panel text size" goes from Tiny to Large, and Compact keeps the panel to six rows at most (five when the no clear move line is left out). The optional "Show estimated direction split" shades rows in the same neutral ink as the histogram, never green or red.
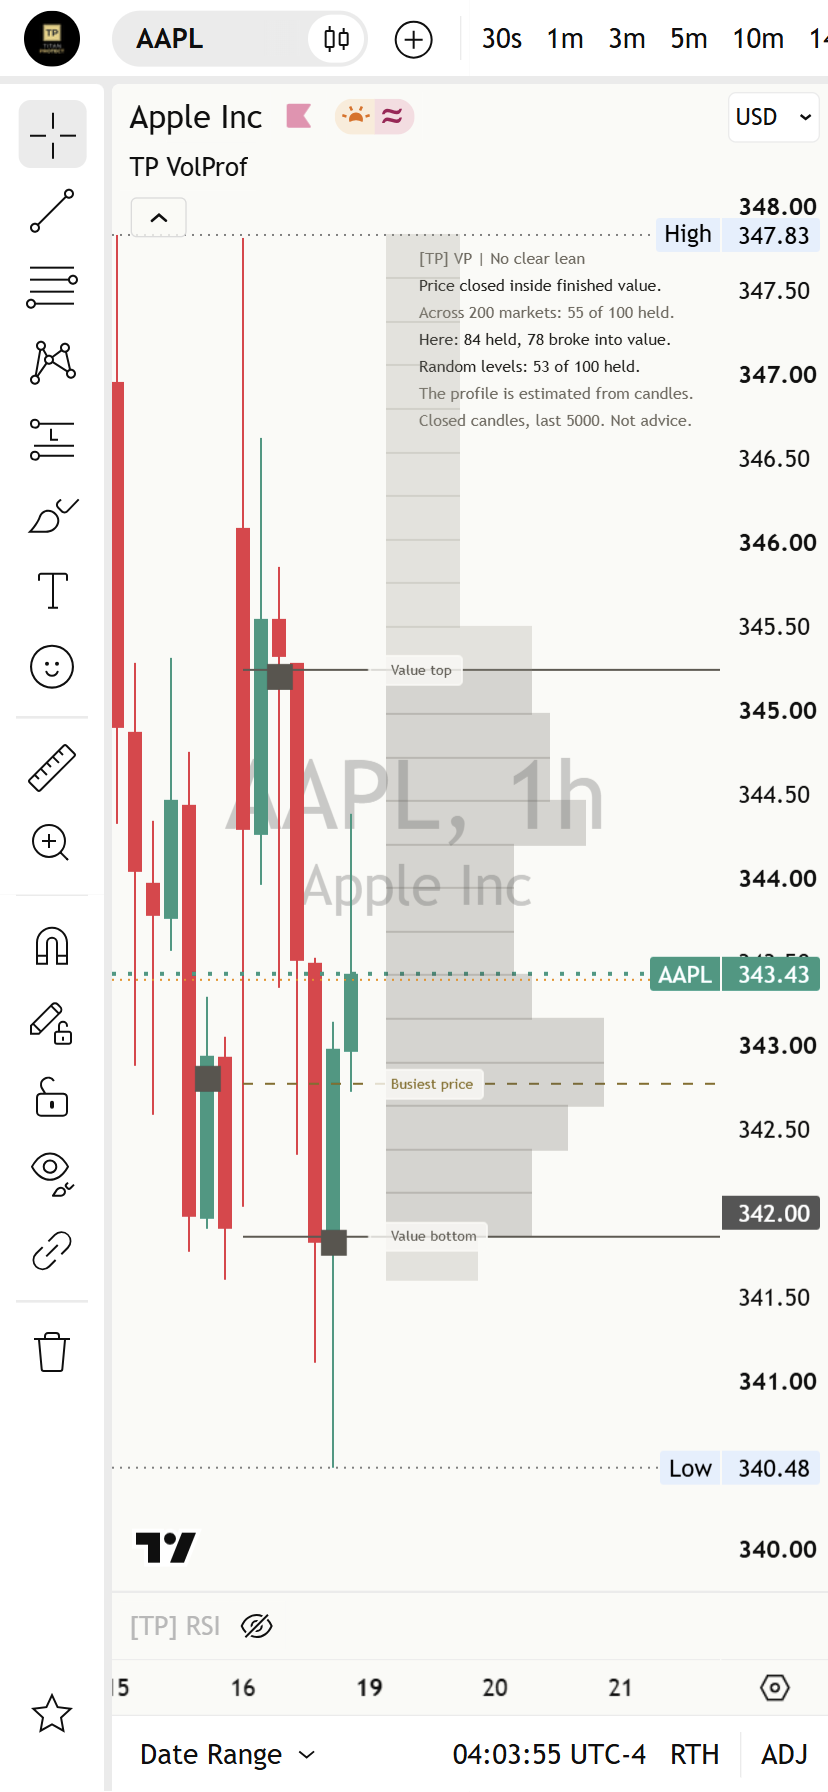
A good way to use it: say what you see first: where did price close against the last finished value? When price comes back to an edge, say what you expect, then watch the ten candles. Then check your call against the panel's count on this chart. Where you disagree is where you learn.
Test yourself
Take the 15-question quiz below to check what stuck.
Question 1 of 15 · Beginner
In plain words, what does a volume profile show?
Question 2 of 15 · Beginner
What is the busiest price?
Question 3 of 15 · Beginner
How is the value area built?
Question 4 of 15 · Beginner
A profile built from chart candles is...
Question 5 of 15 · Beginner
The panel says "A busy price shows past trade only." What does that mean?
Question 6 of 15 · Intermediate
Why does the Mentor read the last FINISHED profile?
Question 7 of 15 · Intermediate
The previous candle closed above the value top, and this finished candle's low reaches it. What is that?
Question 8 of 15 · Intermediate
After a return to the value top from above, a candle closes half a typical candle back above the level within ten candles. The outcome is...
Question 9 of 15 · Intermediate
Ten candles pass after a return and no candle closes half a typical candle either side of the level. The outcome is...
Question 10 of 15 · Intermediate
What does the gold ring with the tooltip "Still open, not counted yet" mean?
Question 11 of 15 · Advanced
On a one-hour chart the panel reads "Here: 84 held, 78 broke into value." What is the honest reading?
Question 12 of 15 · Advanced
Why does the header read "[TP] VP | No clear lean"?
Question 13 of 15 · Advanced
The panel reads "Too few here to count yet (5)." What does that mean?
Question 14 of 15 · Expert
A trader changes the price rows and the value share until the value edges on an old chart look perfect. What has changed?
Question 15 of 15 · Expert
Which statement fits a value edge best?
Educational interpretation only. Not financial advice. Every profile describes a period that already finished, and the counts are history, not promises about what comes next.
Learn the idea here. Apply it with the desk.
Titan Protect turns lessons like this into a daily practice: live market research, the full framework, and the tools that put it to work. This lesson is free; the desk is where it compounds.