VIX Session Compression Details
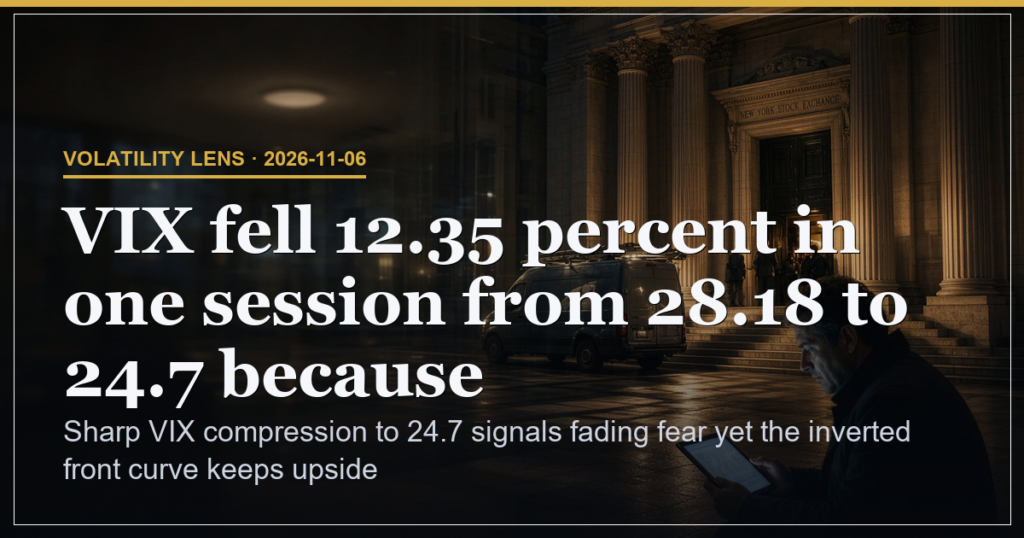
The VIX closed at 24.7 after dropping 3.48 points or 12.35 percent from the 28.18 prior close because the session low reached 23.47 which means downside protection demand collapsed inside one day and removed the prior session’s full reversal gain. The open sat at 27.68 while the high printed 27.76 which means the entire range captured a swift repricing of near term equity stability. Volume remained zero on the print which means the move occurred without visible new futures hedging activity in the data slice. This compression directly follows the 60.39 percent spike recorded the prior session and therefore narrows the window for sustained fear repricing until the five day average reasserts itself.
Front Curve Inversion Metrics
VIX9D finished at 27.04 while spot VIX printed 25.19 because the front end of the term structure remains inverted which means short dated volatility still carries a premium over the five day average of 23.02. The 1.85 point gap between VIX9D and spot VIX keeps the near term protection bid alive even after the headline drop and therefore limits how far equity upside can extend before volatility reprices higher again. This inversion stands in contrast to a flat or discounted curve and signals that option buyers continue to favour immediate expiry coverage over longer dated positions.
| Metric | Value | Implication |
|---|---|---|
| VIX9D last | 27.04 | Prices near term moves at a premium to spot which means protection demand stays front loaded |
| VIX spot last | 25.19 | Sits 2.17 above five day average which means the calm print has not yet fully retraced the prior spike |
Volatility of Volatility Reading
VVIX closed at 123.63 while the VIX print sat only 1.68 above the five day average of 23.02 because volatility of volatility itself remains elevated which means any further equity rally could compress the VVIX reading quickly and remove the remaining fear premium. The 123.63 level sits well above typical calm readings and therefore keeps the market sensitive to headline shocks even after the 12.35 percent VIX drop. This dynamic reinforces the inverted front curve and caps the scope for sustained downside volatility compression until the 23.02 average is reclaimed on a closing basis.
Support Resistance and Risk Level
Support rests at the 23.02 five day average while resistance sits at the 27.04 VIX9D level because a sustained break below the average would confirm the compression has fully retraced the prior spike which means further equity stability becomes more likely. The 28 percent risk factor stems from the persistent curve inversion which means any weekend headline can re invert the structure rapidly and push VIX back toward 27.04 without requiring fresh equity weakness. Positioning Pressure shows bullish options sentiment which aligns with the VIX compression but does not yet override the front curve premium.
| Scenario Trigger | Weight | Outcome Path |
|---|---|---|
| Close below 23.02 five day average | 45 | Further VIX compression toward 21 range as inversion unwinds |
| Reclaim above 27.04 VIX9D | 30 | Volatility reprices higher into next session on protection bid return |
| Range hold between 23.02 and 27.04 | 25 | Sideways equity action with limited directional conviction |
Experience Level Tape Watchpoints
| Level | What to Watch |
|---|---|
| Beginner | Track the daily VIX change percentage and note how a 12.35 percent drop alters the prior session reversal |
| Intermediate | Observe the gap between VIX9D and spot VIX to gauge whether the inversion narrows or widens on subsequent prints |
| Advanced | Monitor VVIX relative to the five day VIX average to assess how quickly fear of volatility itself can compress on further equity gains |
Sharp VIX compression to 24.7 signals fading fear yet the inverted front curve keeps upside limited until 23.02 breaks.
This is analysis, not financial advice. Always manage your risk.