Date: Monday 1 June 2026 | Pre-NY Edition, Post 9 of 19 | Data: Live as of 09:00 EDT
Series: Option Watch — max pain, gamma exposure, expected moves, put/call ratios, IV skew
Published: ~14:00 BST / 09:00 EDT / 22:00 JST (Mon)
Max Pain Map: Where Dealers Need the Market to Land
Max pain theory is straightforward in principle. Options dealers are short most retail options positions. When retail buys calls, dealers sell calls and delta-hedge by buying the underlying. When retail buys puts, dealers sell puts and delta-hedge by selling the underlying. The strike where dealers have the least aggregate pain — where the maximum number of options expire worthless — is max pain. Dealers have incentive for the market to drift toward that level into expiration because it reduces their hedging obligations.
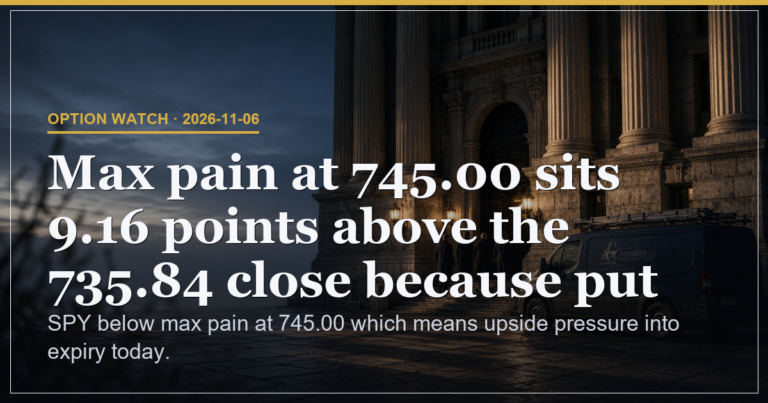
SPY max pain is $754.00 against a current price of $755.73. That is a $1.73 gap. In a calm week, you would expect SPY to drift down toward $754 ahead of Friday expiration. The complication is that NFP Friday creates a directional catalyst. If NFP is strong, SPY may push toward $760 and the max pain pull becomes irrelevant. If NFP is weak, the $754 pull and the potential for further selling combine. The $750 put OI of 34,858 contracts is the next significant level below max pain — that is the strike where dealer delta-hedging flips from buying to selling if SPY breaks through.
| Instrument | Current Price | Max Pain | Gap | Direction Signal | P/C Volume |
|---|---|---|---|---|---|
| SPY | $755.73 | $754.00 | +$1.73 above | Mild gravitational pull lower | 0.916 (call-heavy) |
| QQQ | $737.28 | $735.00 | +$2.28 above | Mild pull lower; tech-specific risk | 1.151 (put-leaning) |
| IWM | $287.43 | $289.00 | -$1.57 below | Max pain above — gravitational pull higher | 2.561 (heavy put volume) |
| NVDA | $219.90 | $212.50 | +$7.40 above (+3.37%) | Significant downside pull from max pain | 0.411 (strongly call-heavy) |
| TSLA | $423.63 | $432.50 | -$8.87 below (-2.09%) | Max pain above — pull higher into week | 0.892 (near parity) |
| META | $613.74 | $625.00 | -$11.26 below (-1.83%) | Max pain well above. Pull higher intact. | 0.408 (strongly call-heavy) |
| MSFT | $460.54 | $430.00 | +$30.54 above (+6.63%) | Large gap — max pain very far below current price | 0.425 (call-heavy) |
| AMD | $493.11 | $485.00 | +$8.11 above (+1.65%) | ATM IV 76.9% — highest in universe. Volatility premium elevated. | 1.626 (put-leaning) |
IV Skew: The 184-Point Gap Between Put and Call Protection
IV skew measures the difference between implied volatility for OTM puts and OTM calls at the same distance from current price. A large skew means institutions are paying a significant premium to protect against downside versus upside. A skew of 184 points on SPY is substantial. It tells you that the options market is not pricing a symmetric two-way risk. It is pricing a world where the downside outcome is significantly more likely to be violent than the upside outcome.
The specific numbers: SPY OTM put IV is at 193.8% against OTM call IV of 9.8%. That 183.9-point differential is not a panic signal on its own. But taken alongside a VIX reading of 15.32, it represents a structural inconsistency. VIX measures the implied volatility of near-term ATM SPX options. A low VIX says the market expects calm. A high put skew says the protective desks are paying up for downside insurance against a very specific tail risk. These two things can coexist — but only for a limited time before one of them has to adjust.
| Instrument | ATM IV | OTM Put IV | OTM Call IV | Skew (pts) | Read |
|---|---|---|---|---|---|
| SPY | ~18% | 193.8% | 9.8% | 183.9 | Heavy put protection premium. Tail risk priced in. |
| QQQ | ~20% | 196.9% | 18.4% | 178.5 | Tech put protection elevated. Iran vs AI capex tension. |
| TSLA | 22% | 280.6% | ~45% | 235.2 | Extreme put skew. Highest skew in this set. |
| AMD | 76.9% | 340.6% | ~78% | 262.2 | ATM IV at 76.9% is highest in universe. Major event risk priced. |
| NVDA | 49.5% | 205% | ~50% | ~155 | ATM IV elevated. Dark pool bullish vs options caution. |
| META | ~28% | ~180% | ~30% | ~150 | Max pain $625 exactly at expected move upper bound. |
Expected Move: What the Straddle Is Pricing for This Week
The expected move is derived from the current week’s at-the-money straddle price. It represents the options market’s consensus on the one-standard-deviation range for the expiration date. It is not a prediction. It is the price at which the market has decided to price two-way risk. The practical use of it is this: if you are positioning for a move, you want to know whether the options market is already pricing that move. If it is, buying options into an event is expensive. If it is not, there may be relative value in directional options.
SPY’s expected move this week is $2.95, which represents 0.39% from current price. That is a narrow range: $752.78 to $758.68. For a week with NFP, an Iran headline risk, and crude at $90, a 0.39% expected move is low. Either the market is pricing a contained outcome — geopolitical noise resolves, NFP is in-line, crude gives back some gains — or the options market is under-pricing this week’s event risk. Given the put skew of 184 points, the latter is more likely. The expected move from the straddle is cheap. The tail protection via OTM puts is not.
| Instrument | Expected Move | Pct Move | Upper Bound | Lower Bound | Notable |
|---|---|---|---|---|---|
| SPY | $2.95 | 0.39% | $758.68 | $752.78 | Narrow range for NFP week. May be under-pricing. |
| QQQ | ~$4.83 | 0.66% | $742.11 | $732.45 | Tech-specific; wider than SPY relative to price. |
| IWM | ~$2.32 | 0.81% | $289.75 | $285.11 | Max pain $289 inside the upper expected move band. |
| NVDA | ~$3.80 | 1.73% | $223.70 | $216.10 | Max pain $212.50 below lower bound. Gap is significant. |
| AMD | ~$37.25 | 7.55% | $530.36 | $455.86 | Widest expected move. Event-specific catalyst expected. |
| META | ~$10.32 | 1.68% | $624.08 | $603.40 | Max pain $625 exactly at upper bound. Precision alignment. |
Unusual Activity: The Signals That Stand Out
Volume-to-OI ratio flags positions where the options activity in a single session significantly exceeds the existing open interest. A ratio above 3.0 suggests the position is new. A ratio above 5.0 suggests it is urgent. A ratio above 10.0 is a high-conviction, time-sensitive bet from a single desk or a cluster of informed traders moving together.
The SPY $756 call at 6.24x and the $757 call at 4.71x represent notable call accumulation right at the current market level. These are not defensive hedges. These are directional bets that SPY stays at or above $756 into expiration. Given that max pain is at $754, someone is betting against the gravitational pull.
The TSLA $402.50 call at 18.66x and the $425 call at 18.57x are the highest volume-to-OI readings in the set. TSLA is trading at $423.63 with max pain at $432.50. The call activity is concentrated at and below the current price, which is consistent with someone positioning for TSLA to hold its current level and drift toward max pain. With 14 separate unusual activity events logged on TSLA, this is not a single desk. This is distributed positioning from multiple participants converging on the same thesis.
The MSFT $450 put at 12.43x volume-to-OI is the standout defensive signal. MSFT is at $460.54 with max pain at $430. The $450 put is being bought aggressively at a level that would represent a significant pullback from current prices. Combined with MSFT’s $5.96 billion dark pool print from Friday, you have a picture of institutional accumulation at the equity level and simultaneous protective put buying in the options market. That is a position hedge: long the stock, buy downside protection.
| Symbol | Strike | Type | Vol/OI Ratio | Read |
|---|---|---|---|---|
| TSLA | $402.50 | Call | 18.66x | OTM call below current price. Accumulation or spread leg. |
| TSLA | $425.00 | Call | 18.57x | Near ATM. High conviction directional call. |
| MSFT | $450.00 | Put | 12.43x | Position hedge against dark pool long. Equity bought, downside protected. |
| SPY | $756.00 | Call | 6.24x | ATM call. Bet against max pain gravitational pull. |
| SPY | $757.00 | Call | 4.71x | Continuation of call accumulation just above current price. |
| IWM | $286.00 | Put | 7.65x | Small-cap put hedge. IWM below max pain yet put buyers active. Rate-sensitive caution. |
| META | $610.00 | Put | 5.0x | Below current price. Protection against pullback from max pain run-up. |
QQQ NFP Week Divergence: The Bearish Signal Inside Tech
QQQ is the instrument where the options structure is sending the clearest bearish divergence signal this week. The aggregate P/C ratio for the market is 0.948 — mildly call-heavy. QQQ’s own P/C volume ratio is 1.151 and the P/C open interest ratio is 1.891. That is a put-heavy book sitting inside a market that reads call-heavy in aggregate. The divergence tells you that the options market is more cautious about tech specifically than about the broader index.
QQQ’s IV rank is 36.3% with an IV of 20.18% against 30-day historical vol of 15.74%. The IV premium of 4.44 percentage points is moderate but consistent with event risk priced in. Total QQQ open interest of 11.4 million contracts sits at 105.22% of its 30-day average — slightly elevated, which confirms the positioning is active rather than stale. For the June 5 NFP expiry specifically, the put/call ratio on that expiry is 2.21, and the expected move priced into the QQQ options for NFP Friday is plus or minus 1.92%, which translates to approximately $14.20 around current price. That is a wider range than the aggregate SPY expected move of 0.39% — the market is pricing a larger NFP reaction in tech than in the broad index.
| QQQ Metric | Value | Read |
|---|---|---|
| Implied Volatility | 20.18% | Premium over HV of 15.74%. Event risk priced. |
| IV Rank | 36.3% | Mid-range. Not extreme. Options not yet expensive. |
| P/C Volume Ratio | 1.151 | Put-leaning vs market aggregate of 0.948. |
| P/C OI Ratio | 1.891 | Structural put bias. Accumulated over multiple sessions. |
| June 5 Expiry P/C | 2.21 | NFP Friday expiry is heavily put-skewed on QQQ. |
| June 5 Expected Move | +/-1.92% ($14.20) | 5x wider than SPY’s expected move. Tech prices bigger NFP swing. |
| Total OI vs 30-day avg | 105.22% | Elevated positioning. Active, not stale. |
The SPY OI Structure: What $750 Means for Dealer Hedging
The top call OI strikes for SPY sit at $767 (28,120 contracts), $770 (18,975), $765 (18,377), and $760 (16,080). These are the levels above current price with the most call OI. Dealers who sold those calls are delta-hedged by holding long SPY. As SPY rises toward $760 and beyond, dealers need to buy more SPY to maintain their delta hedge. That creates a mechanical buying impulse. In a positive gamma environment, price moves are dampened by dealer activity because dealers buy lows and sell highs.
The top put OI strikes sit at $750 (34,858 contracts), $744 (12,772), and $753 (12,729). The $750 put with 34,858 contracts is the dominant structural level below current price. Dealers who sold those puts are delta-hedged by holding short SPY. As SPY falls toward $750, dealers need to sell more SPY to maintain their delta hedge. Below $750, the selling impulse accelerates. This is the negative gamma flip point: below $750, dealer hedging amplifies downside moves rather than dampening them.
The current price of $755.73 sits between the upside call cluster at $760+ and the downside put trigger at $750. The NFP print Friday will determine which side of this range gets tested. Strong NFP pushes toward $760 and dealers buy. Weak NFP pushes toward $750 and dealer selling adds fuel below.
NFP Week Options Playbook
| Scenario | NFP Outcome | SPY Directional Target | Key Trigger Level | Dealer Hedging Direction |
|---|---|---|---|---|
| Strong NFP (200k+) | Beats expectations | $760-$765 cluster | $760 call OI level | Buy (delta hedging calls) |
| In-line NFP (150-180k) | Meets consensus | $753-$757 drift range | $754 max pain | Neutral; max pain gravity |
| Weak NFP (under 120k) | Misses expectations | $750 trigger level | $750 put OI (34,858 cts) | Sell (neg gamma below $750) |
| Iran escalation pre-NFP | Geopolitical shock | $744 put cluster | $750 break triggers acceleration | Aggressive dealer selling amplifies |
How to Use This: Beginner, Intermediate, Advanced
Max pain at $754 is not a price target. It is a gravitational reference. Think of it as where the market wants to drift if there is no catalyst. This week there are catalysts. The key levels to watch are $750 on the downside (dealer selling accelerates below) and $760 on the upside (dealer buying supports above). NFP Friday determines which side gets tested.
The MSFT unusual put activity at $450 (12.43x Vol/OI) is a hedged position signal. When institutions buy through dark pools and simultaneously buy downside puts, they are building a position they believe in but are not willing to hold unprotected through event risk. Use that pattern: strong dark pool + put hedge = conviction with caution. IWM is below max pain — the small-cap picture has its own gravitational pull up to $289 this week.
The SPY OTM put IV at 193.8% against OTM call IV at 9.8% creates a structurally rich put skew. If you believe Iran escalation risk is under-priced by VIX, the relative value trade is buying OTM SPY puts against selling OTM calls in a risk reversal. The skew is paying you to take the bearish side. The ATM straddle at 0.39% expected move is cheap for an NFP week with live geopolitical risk on the table.
What the Options Market Is Pricing vs What It Should Be Pricing
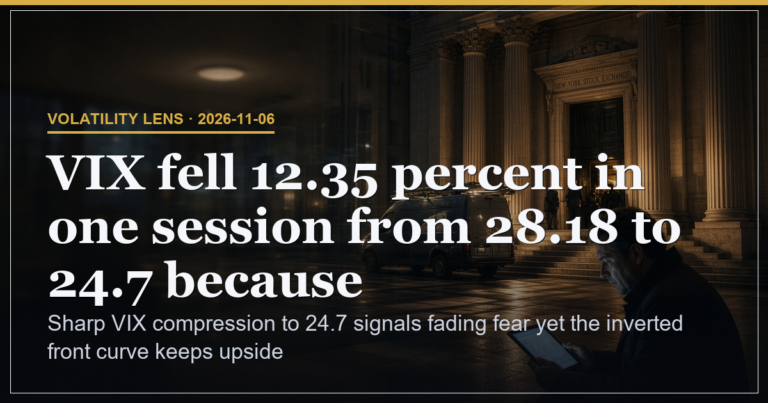
Post 04 (Volatility) established the core contradiction: VIX at 15.32 on the same day US-allied forces struck Iranian oil infrastructure at Goruk and Qeshm Island. VIX is a 30-day forward-looking measure of ATM SPX vol. It tells you what the market expects in a probabilistic, aggregated sense. At 15.32, it is pricing roughly two standard deviations of normalcy. No crisis premium.
The VVIX at 88.88 tells a different story. VVIX is the volatility of VIX itself. At 88.88, it is elevated relative to a VIX of 15.32. The ratio between VVIX and VIX is approximately 5.8. Historically, sustained ratios above 5.5 precede VIX spikes. The options market on VIX options is pricing the probability of a jump in spot vol, even while spot vol itself sits calm. Someone is buying vol-of-vol protection.
The aggregate P/C at 0.948 suggests the market is not in full hedging mode. But that aggregate masks the QQQ-specific P/C of 1.891 on open interest and the QQQ June 5 P/C of 2.21. In aggregate, the market looks moderately call-heavy. In the instrument most exposed to Iran-linked AI capex risk, the book is materially put-heavy. The market is not ignoring Iran. It is hedging the specific exposure.
| Signal | What It Shows | What Is Missing |
|---|---|---|
| VIX 15.32 | Calm. Near-term realised vol not elevated. | No geopolitical tail premium. Iran escalation not in ATM SPX vol. |
| VVIX 88.88 | Vol-of-vol elevated. VIX jump risk being priced. | Consistent with tail risk awareness. Forward-looking. |
| P/C Aggregate 0.948 | Call-heavy aggregate. Bullish tilt in volume. | Masks QQQ P/C OI of 1.891. Aggregate misleads. |
| SPY OTM Put IV 193.8% | Tail protection expensive. Institutions paying up. | Consistent with what should be priced. The correct signal. |
| SPY Straddle 0.39% | ATM options cheap relative to event risk. | NFP + Iran + crude $90 = should be 0.60-0.80% at minimum. |
| AMD Expected Move 7.55% | Market pricing specific catalyst on single name. | No scheduled earnings. Market anticipates announcement. |
The conclusion is not that the options market is uniformly under-pricing risk. It is that it is selectively pricing risk. Tail protection via OTM puts is expensive. ATM vol is cheap. The skew is extreme. The market has decided that the binary outcomes are the threat, not the day-to-day drift. For anyone looking at this week: the ATM straddle is the cheaper instrument; OTM put protection is where the smart desks are already positioned. That tells you the hedging for this week’s catalysts is already placed — and placed primarily via the put wing rather than the ATM structure.
Track Record Context
The options structure read in last week’s editions correctly identified the put skew as the leading structural signal. When VIX fell and skew remained elevated, the framework called this a contradiction — complacency at the index level while institutional protection desks were still paying up for tail cover. That contradiction is now more acute, not less. VIX at 15.32 has fallen further. The put skew has not compressed. That divergence is widening, and it is doing so into an event week with more catalysts, not fewer.
The AMD expected move at 7.55% is a significant data point. When options markets price a 7.5% move on a single name in a week with no scheduled earnings, they are anticipating an announcement, a conference presentation, or a sector catalyst large enough to move the stock by that magnitude. Cross-reference with Post 07’s dark pool and whale flow data — AMD had $2.68 billion in dark pool prints and $59.59 million in options whale flow. The confluence of elevated expected move and dark pool accumulation is worth watching closely.
Alpha Insights is produced for Titan Protect members. For educational purposes only. Not financial advice. All data as of Monday 1 June 2026 pre-NY session. Always size positions according to your own risk tolerance and plan.
Deepen Your Understanding
Related articles from the Titan Protect Foundry: