Options Whale Concentration
Eight whale trades total 8.3M in premium with six call-heavy prints which means net bullish positioning concentrates in INTC at 3.45M on 90,005 contracts, SOXS at 3.19M on 24,934 contracts and NVDA at 1.31M on 40,136 contracts. The two put-heavy names total only 46.5K which means call volume outweighs puts by more than 170 to 1 in the slice. This flow configuration keeps upside pressure on semis and tech names because listed activity dominates without offsetting block prints.
Put Call Ratio and Sentiment Label
The average put call ratio sits at 0.908 which means crowd positioning leans long equities and the bullish sentiment label aligns with listed call flow on TSLA, META, AMD and AMZN. Yesterday’s ratio of 0.892 rose only 0.016 which means the shift stays marginal and does not alter the call-led read. MSFT shows the sole bearish options label which means any downside in that name stays isolated from the broader flow.
SPY Price Versus 0 DTE Max Pain
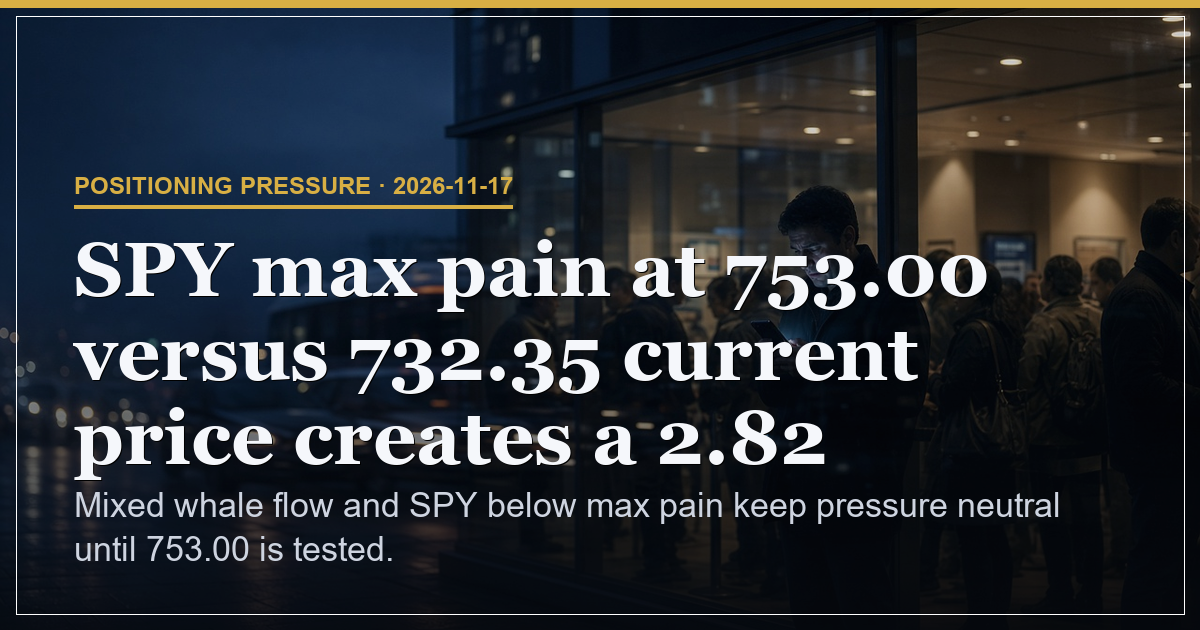
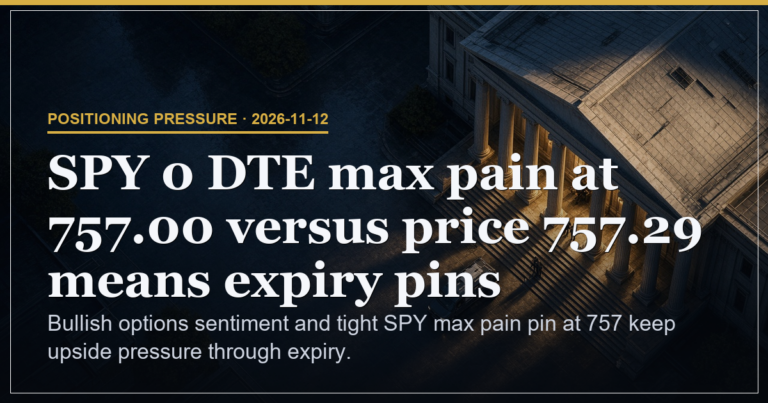
SPY closes at 750.99 against the 0 DTE max pain of 758 which means price sits 7.01 below the pin and hedging may provide support only if open interest remains clustered at 758. The 750 level holds as immediate support because any break would require fresh volume to shift the cluster first. No dark pool top list appears in the slice which means zero large block data exists to modify the options-driven read.
| Strike | Max Pain vs Price | Implication |
|---|---|---|
| 758.00 | +7.01 (+0.93%) | Nearest resistance because open interest clusters there and any test would require sustained call flow to hold |
| 750.00 | -0.99 (-0.13%) | Immediate support because price already trades near this level and a breach would widen the gap to max pain |
Listed Bullish Names and Flow Balance
Bullish options appear on four names while only one bearish label exists which means the net options structure favours upside in the names tied to the 8.3M whale total. The absence of open interest changes leaves no fresh gamma data which means positioning pressure rests on the existing call-heavy prints alone.
Scenario Triggers and Weights
45 percent weight attaches to a close above 758 because that would confirm hedging support into expiry. 35 percent weight sits on a test of 750 because that level already acts as immediate support and a break would widen the gap to max pain. 20 percent weight remains on unchanged flow because the 0.908 ratio shows no acceleration that would force further upside.
Risk and Experience Watchpoints
Risk stands at 2.1 percent driven by the gap between current price and max pain which means any reversal in call flow could widen that distance quickly.
| Level | What to Watch on Tape |
|---|---|
| Beginner | Track whether price holds 750 or drifts toward 758 because the distance shows the current pin tension |
| Intermediate | Monitor the 0.908 put call ratio for any daily move above 1.0 because that would signal a shift in listed sentiment |
| Advanced | Compare the 3.45M INTC and 1.31M NVDA prints against total 8.3M to gauge whether call dominance persists or narrows |
Bullish options flow and sub 1 put call ratio outweigh SPY price below max pain and point to upside pressure.
This is analysis, not financial advice. Always manage your risk.