Index Performance Across Major Benchmarks
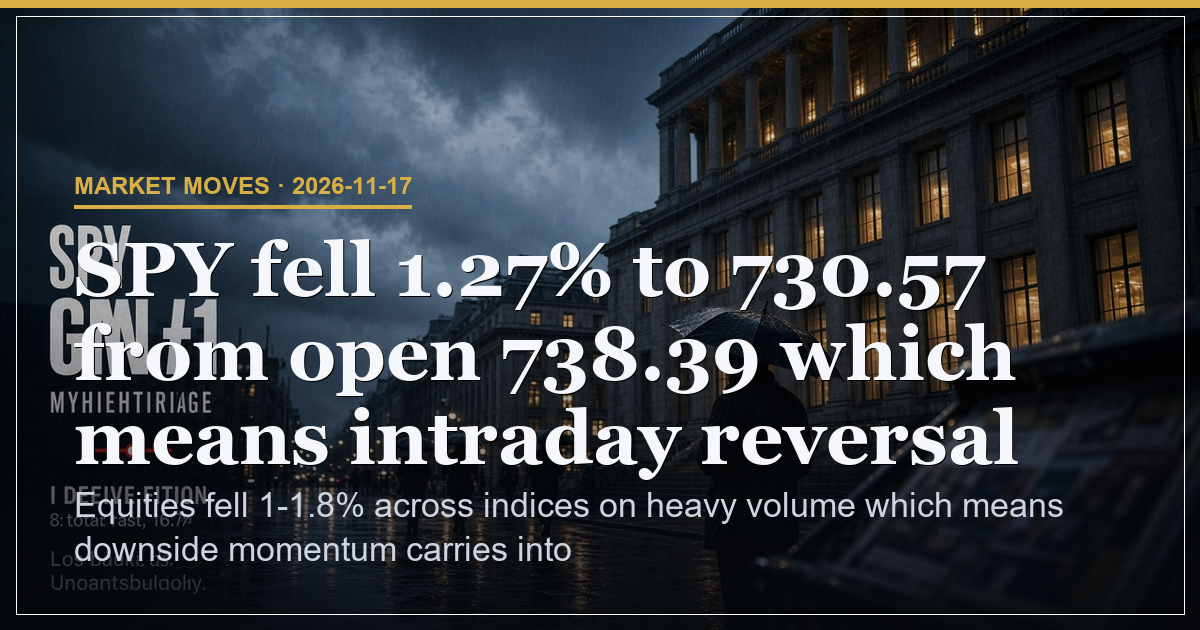
SPY closed at 730.57 after a 1.27% drop from the 738.39 open which means sellers drove price to the 727.00 low and established fresh downside momentum. QQQ finished at 655.02 following a 1.02% decline from the 663.05 open which means growth names participated in the uniform slide to the 646.65 low. IWM fell 1.55% to 268.72 while DIA dropped 1.84% to 506.20 because small-cap and blue-chip names both registered losses above 1% on volume exceeding 24 million shares for IWM. The S&P 500 ended at 7325.64 after a 1.23% decline from the 7411.02 open which means broad large-cap pressure extended across the session low of 7288.34.
Volatility and Fear Metrics
VIX rose 12.27% to 25.72 after a 2.81 point gain from the prior 22.91 close which means near-term implied volatility lifted materially and raised the cost of downside protection. The term structure shows VIX9D at 27.56 sitting above spot at 26.24 which means front-end protection remains expensive relative to the curve. VVIX printed 125.02 because elevated volatility of volatility signals continued uncertainty in option pricing.
| Index | Close | Daily Change | Implication |
|---|---|---|---|
| SPY | 730.57 | -1.27% | Sellers reached session low at 727.00 |
| QQQ | 655.02 | -1.02% | Growth names extended downside to 646.65 |
| DIA | 506.20 | -1.84% | Blue-chip weakness reinforced broad move |
Investor Sentiment Readings
The AAII bearish reading reached 51.4% against a 31.5% historical average which means individual investor pessimism sits well above normal levels. Fear and Greed fell 6.2 points to 24.8 because the drop shifted sentiment deeper into caution territory from the prior 31.0 reading. These extremes coincide with the uniform index declines above 1% which means crowd positioning has aligned with the risk-off price action.
Price Levels and Potential Triggers
Support rests at the session lows of 727.00 for SPY and 646.65 for QQQ while resistance forms at the session opens of 738.39 and 663.05 because those prints mark the first barriers where demand interest appeared intraday. A close back above the opens would alter the immediate downside structure which means the levels define the near-term directional boundary. The risk-off regime keeps pressure on risk assets until the next data release arrives which means the calendar remains the primary catalyst ahead.
| Metric | Value | Meaning |
|---|---|---|
| VIX close | 25.72 | 12.27% jump lifted protection costs |
| AAII bearish | 51.4% | 20 points above long-term average |
| Fear and Greed | 24.8 | 6.2 point daily decline deepened caution |
Scenario Probabilities and Risk Factors
Downside continuation holds 55% odds if price remains below the 738.39 SPY open because momentum from the 1.27% decline carries forward. A reversal toward the prior session high carries 25% odds if a close above 738.39 occurs which means the resistance level would need to flip to support. Range-bound consolidation holds 20% odds while VIX stays above 25 until the next macro print arrives because volatility expansion typically precedes either extension or pause.
The overall risk level stands at 25% driven by the 12.27% VIX surge which means implied volatility can amplify moves in either direction from current levels.
| Experience Level | What to Watch on Tape |
|---|---|
| Beginner | Track how VIX moves relative to index percentage changes to gauge fear response |
| Intermediate | Note volume at session lows versus opens to assess conviction behind the decline |
| Advanced | Observe whether support at 727 holds into the next session or yields on follow-through supply |
Risk-off regime with uniform index declines over 1% and a 12% VIX surge points to sustained downside pressure.
This is analysis, not financial advice. Always manage your risk.