Equity Index Performance
SPX closed at 7410.99 after dropping 150.68 points from the 7513.98 open which means sellers controlled the session and pushed prices to the 7400.15 low. QQQ fell 18.63 points to 661.26 which means the 2.74 percent decline extended the risk-off move across growth names. NDX posted the same 2.74 percent loss to 27177.64 because the uniform equity slide left no sector untouched. DIA declined 1.47 percent to 515.47 while IWM fell 1.88 percent to 2737.94 which means small-cap weakness reinforced the broad downside.
Volatility Expansion Details
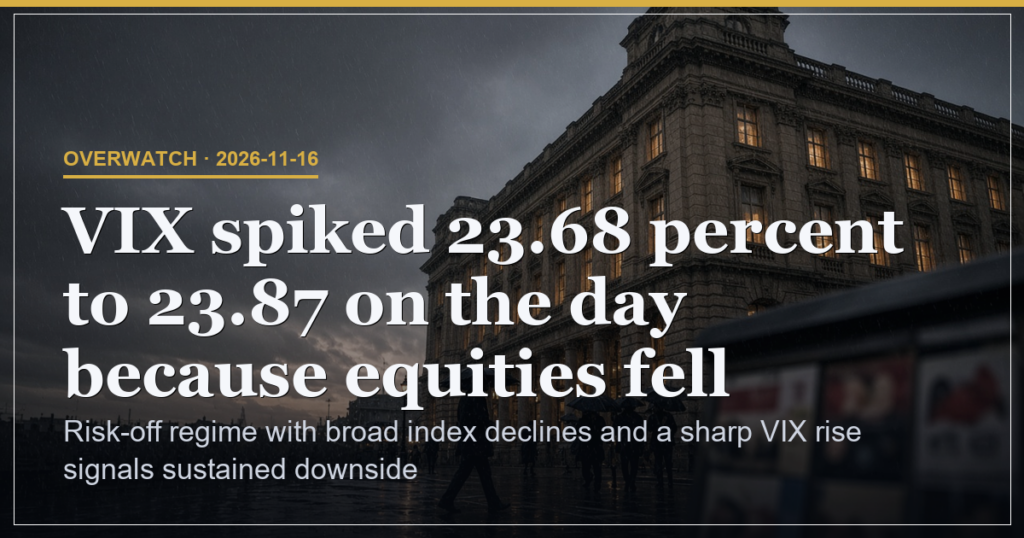
VIX jumped 4.57 points to 23.87 which means implied volatility rose 23.68 percent and lifted the cost of downside protection. The move came directly from the 1.99 percent SPX decline because equities fell across the board and drove fear pricing higher. VIX term structure shows VIX9D at 23.94 sitting above spot at 23.69 which means near-term protection remains expensive relative to the curve.
| Index | Close | Daily Change | Meaning |
|---|---|---|---|
| SPX | 7410.99 | -1.99 percent | Sellers set session low at 7400.15 |
| QQQ | 661.26 | -2.74 percent | Growth names led downside extension |
| VIX | 23.87 | +23.68 percent | Protection cost rose sharply |
Sentiment Readings
AAII bearish readings reached 51.4 percent against a 31.5 percent average which means individual sentiment has shifted sharply negative. Fear-greed score fell 8.8 points to 29.8 because the equity slide and VIX spike weighed on the index. The combination leaves sentiment at extremes that historically coincide with supply exhaustion only after further downside tests support.
Key Price Levels
SPX support rests at 7400.15 with resistance at 7515.60 because those marks defined the session range. QQQ low at 660.48 and high at 672.14 set the immediate bounds which means any close back above 672.14 would require buyers to reclaim intraday ground.
| Level Type | SPX | QQQ | Implication |
|---|---|---|---|
| Support / Low | 7400.15 | 660.48 | Session floor held by sellers |
| Resistance / High | 7515.60 | 672.14 | Reclaim needed to ease pressure |
Scenario Triggers and Weights
45 percent weight sits on a break below 7400.15 which would extend the risk-off regime because momentum stayed negative into the close. 30 percent weight attaches to a hold above 7400.15 with VIX easing toward 20.00 which means volatility contraction could slow the slide. 25 percent weight rests on a close back above 7515.60 which would flip short-term structure because that level marked the open high.
Risk stands at 24 percent because the VIX spike of 23.68 percent signals fear priced across the curve and raises the chance of further gap risk. Positioning Pressure shows bearish options sentiment and SPY below 753.00 max pain point to continued downside pressure because put call ratio at 1.025 and inverse ETF call flow reinforce the tilt.
What Each Experience Level Should Watch
| Level | Focus from Tape |
|---|---|
| Beginner | Track VIX moves above 23.00 and how they align with index closes |
| Intermediate | Watch whether 7400.15 holds on follow-through volume or gives way |
| Advanced | Monitor VIX term structure flattening and any intraday recovery above 7515.60 |
Risk-off regime with broad index declines and a sharp VIX rise signals sustained downside pressure.
This is analysis, not financial advice. Always manage your risk.