As of the 20 November 2026 close. A record of what our data showed that week, not a forecast. Educational only, not advice.
It was a rough week for almost everything. From the 13 November close to the 20 November close, SPY fell 8.6%, QQQ fell 10.5% and gold (through GLD) fell 9.2%. Stocks and gold dropped together, so there was nowhere obvious to hide.
We wanted to know one plain thing: did screening for ethics change how a portfolio behaved in a week like this? Here is what we measured, including the parts that do not flatter us.
Our composites against their benchmarks
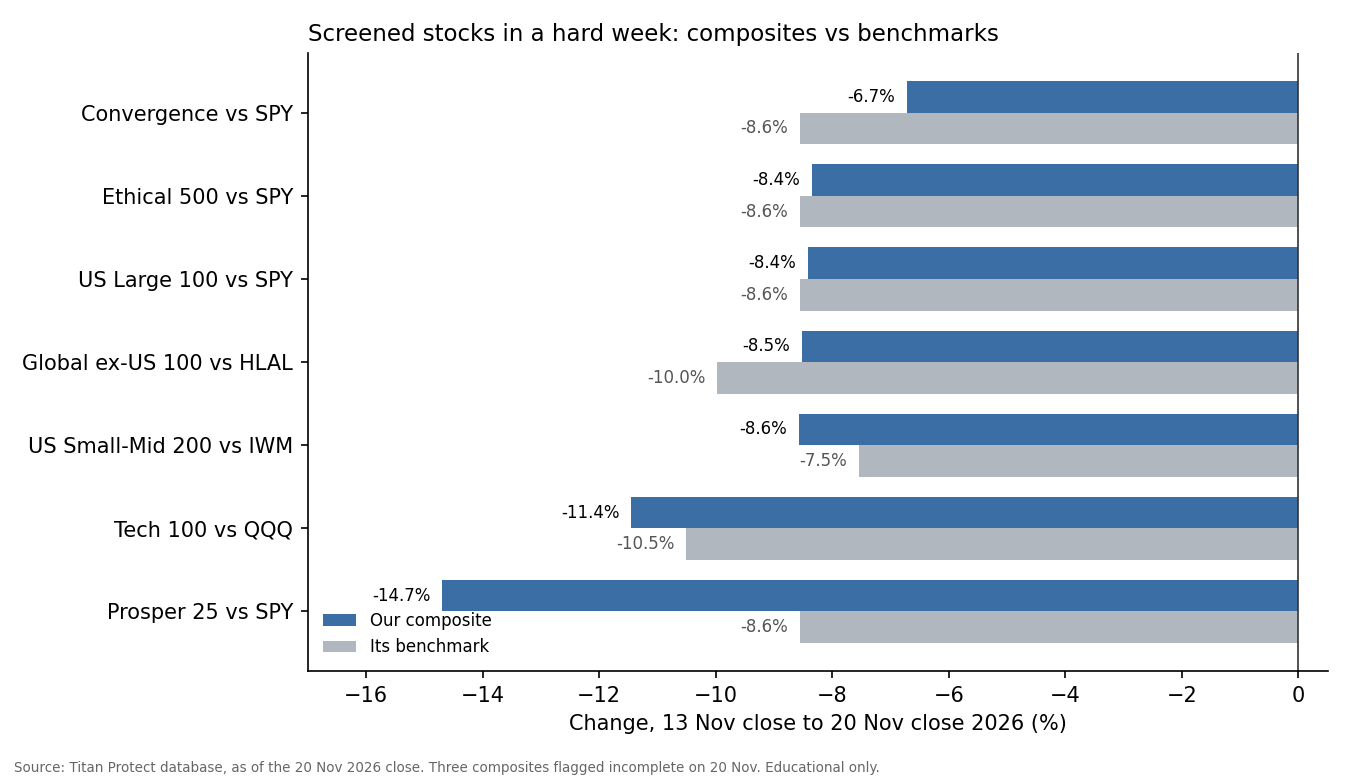
We track several baskets built from stocks that pass our screen, each compared with a plain index fund. Moves below are from the 13 November to the 20 November close.
- Ethical 500: down 8.35%. SPY was down 8.56%, so about 0.2 points better. Against HLAL, the popular faith-based fund, which fell 9.97%, it was about 1.6 points better.
- US Large 100: down 8.42%, against SPY at 8.56%, almost level.
- Convergence (50 names): down 6.72%, against SPY at 8.56%, about 1.8 points better.
- Global ex-US 100: down 8.52%, against HLAL at 9.97%.
- US Small-Mid 200: down 8.57%, against IWM at 7.54% and IJH at 7.00%, so it fell a little more.
- Tech 100: down 11.45%, against QQQ at 10.51%, so it fell about 0.9 points more.
- Prosper 25: down 14.70%, against SPY at 8.56%. This was the weakest result of the group by a wide margin.
So the honest summary is mixed. Some baskets cushioned the fall slightly, some fell a bit more, and one fell much more. A single week says very little about any approach, and we would not read a pattern into it.
Two caveats. First, we compared every composite on the dates where both the basket and the benchmark had values. No rows were skipped for a missing benchmark. Second, three of the baskets (Convergence, Ethical 500 and Global ex-US 100) were still marked provisional on 20 November, so treat those three numbers as provisional.
Passing names against failing names
Next we looked at the whole screened universe, split by our verdict. We used US-listed names only, and left out any stock priced under $2 or with a missing price on either date. We also set aside moves bigger than 50% in either direction as “under review”, since those are more likely to be data problems than real moves.
- Names that pass our screen: 1,075 usable names. The median fell 8.21%. Only 7.0% finished the week higher, and 39.4% fell more than 10%.
- Names that fail our screen: 8,472 usable names. The median fell 6.10%. 13.3% finished higher, and 23.6% fell more than 10%.
In this particular week, the passing group fell harder than the failing group. We want to say that plainly. We have not measured why. One thing worth testing is mix: the pass list holds a lot of technology and chip companies, and it leaves out most banks and insurers, which tend to move differently. That is a guess until we check it.
The comparison is not perfectly clean. Of the passing names, 31 had a missing price on one of the two dates, and 196 were under $2. On the failing side the numbers were 436 and 1,044. Six passing names moved more than 50% and were set aside until we have checked them.
The big names that held up, and the ones that did not
Among the 40 largest passing names we could price cleanly, the median move was minus 8.75%. We removed any company on our boycott list first. We also dropped about 15 foreign listings, such as several European ADRs, because their stored company size did not match price times share count. So this is the largest we could verify, not a strict top 40.
Held up best:
Fell hardest:
An important point on the “why”. Our written read for each of these names says why the company passes the screen, not why the price moved. For all six, the reason is the same: the business is in a permissible area, its debt is inside our limit of about 33%, and almost none of its income comes from interest. Passing the screen did not protect the chip names, and it did not cause the staples to hold. Those are separate questions.
What changed in the screen this week
Very little. Between 14 and 20 November, two names changed from passing to failing, both at the business-activity stage, which comes before any ratio is looked at:
- Ionic Digital (IOND) and OTC Markets Group (OTCM) operate in conventional financial services, which our screen treats as interest-based.
Nothing moved from failing to passing.
What to take from it
A screen does not make a portfolio fall less in a sharp drop, and one week is not evidence either way. We will revisit these numbers in a dated follow-up rather than quietly updating this one.
Figures as of the 20 November 2026 close. This is educational and is not investment advice. Past moves do not predict future results.