Options Market Sentiment
Average put call ratio stands at 1.143 which means more downside protection traded than upside and this ratio above 1 produces net negative skew across large cap names. Bearish options appear on SPY IWM AAPL and MSFT while the bullish options list remains empty which means the options market registers no offsetting bullish flow in those benchmarks. Dark pool top holdings sit empty with a count of zero which means no fresh dark pool prints alter the options driven read today.
Whale Options Activity
Eight whale options trades total 257.5M in premium which means selective hedging concentrated in tech and volatility products. NVDA recorded 175.76M mixed flow across 715111 contracts which means large size split between protection and upside without clear direction. SOXS printed 6.21M call heavy across 14081 contracts which means traders positioned for further volatility upside in semiconductor names.
| Contract | Premium | Flow Type | Implication |
|---|---|---|---|
| NVDA | 175.76M | mixed | hedging split across 715111 contracts |
| SPCX | 53.17M | mixed | additional mixed size in 263513 contracts |
| INTC | 21.43M | mixed | 199172 contracts add to tech hedging total |
| SOXS | 6.21M | call-heavy | 14081 contracts lean volatility long |
Price versus Max Pain Dynamics
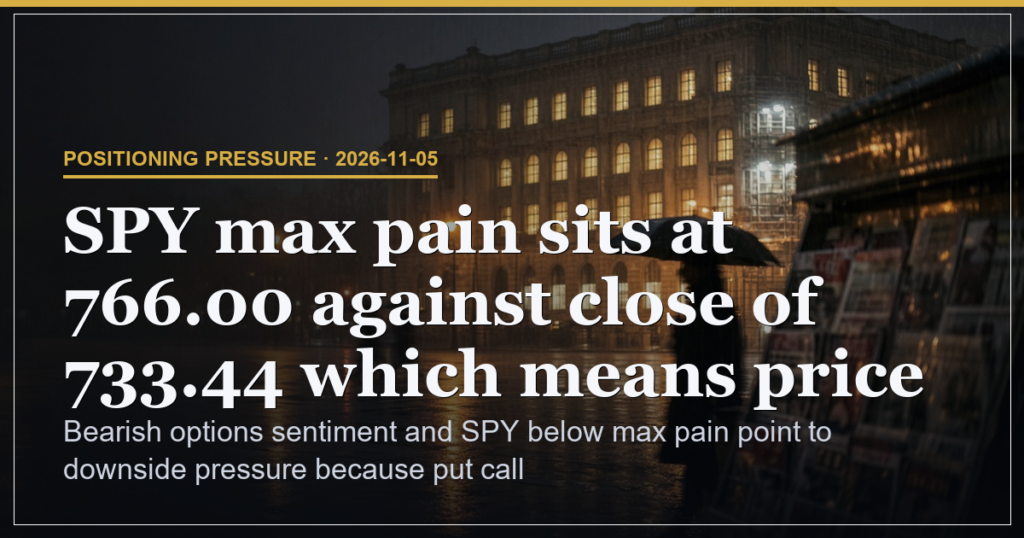
SPY max pain sits at 766.00 against the 731.84 close which means price trades 4.35 percent below the strike that maximises aggregate option pain. That dislocation of 34.16 points creates a magnet effect only if price reclaims the level yet current prints remain anchored lower which means gamma pressure stays tilted toward further downside. Near term support rests at 730 while resistance aligns with the 766.00 max pain print which means any close back above that resistance would require fresh bullish options flow not yet visible.
Sector Flags and Flow Concentration
Bearish options concentrate in SPY IWM AAPL and MSFT which means large cap equity names carry the heaviest put skew. Mixed whale flow in NVDA and INTC alongside call heavy prints in SOXS and TZA shows hedging focused on tech and small cap volatility rather than broad build-up which means crowd positioning leans defensive until new bullish names surface.
Forward Scenarios
45 percent weight attaches to continued downside if SPY holds below 730 because the put call ratio stays elevated and bearish names remain unoffset. 30 percent weight sits on a reclaim of 766 if fresh call flow appears in the bullish list which would close the max pain gap and ease negative skew. 25 percent weight ties to a volatility spike past 30 which would amplify the existing 1.143 put call ratio and widen the price to max pain dislocation further.
Risk Considerations
Risk stands at 35 percent driven by the 4.35 percent gap below max pain combined with zero offsetting bullish options names. Positioning Pressure shows bearish options sentiment and SPY below max pain point to downside pressure because put call ratio above 1 and multiple bearish names flagged.
| Experience Level | What to Watch on Tape |
|---|---|
| Beginner | Track daily put call ratio moves above 1.0 and note when it coincides with price below max pain. |
| Intermediate | Compare whale premium totals in NVDA and SOXS against the empty bullish options list to gauge skew persistence. |
| Advanced | Monitor open interest shifts around the 766 strike versus the 730 support zone for gamma wall changes. |
Bearish options sentiment and SPY below max pain point to downside pressure because put call ratio above 1 and multiple bearish names flagged.
This is analysis, not financial advice. Always manage your risk.