Options Market Sentiment Overview
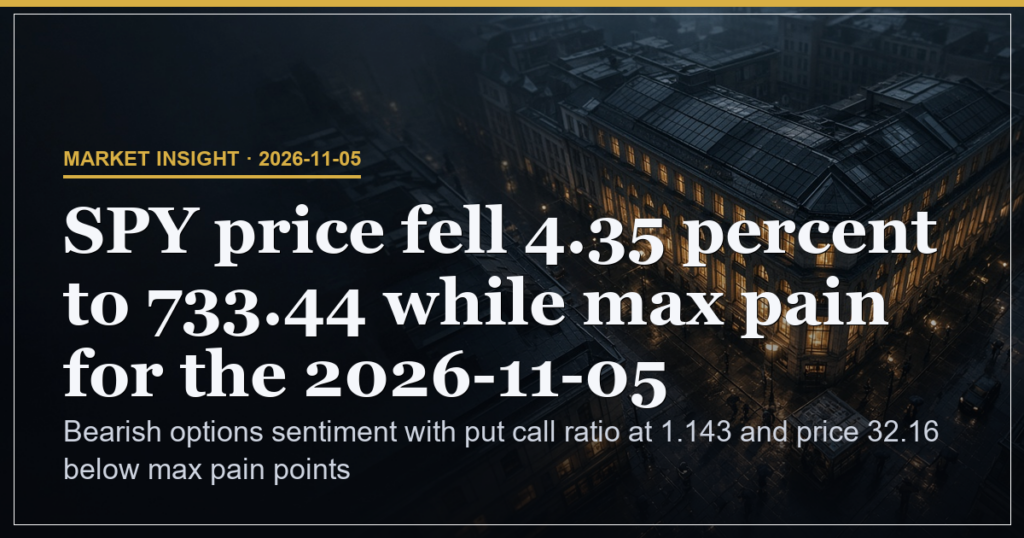
Options market sentiment registers bearish because the average put call ratio stands at 1.143 across eight whale trades which means put volume exceeds calls by 14.3 percent and produces net negative skew. Bearish options appear on SPY IWM AAPL and MSFT which means the flow registers no offsetting bullish names in those benchmarks. The ratio above 1.0 aligns with listed bearish sentiment and extends the downside read because whale activity shows no counterbalancing call dominance.
Whale Flow Breakdown
Whale options activity totals 257.5M in premium across eight trades which means selective hedging concentrated in technology and volatility products without clear directional lift. NVDA recorded 175.76M mixed flow across 715111 contracts which means large size split between protection and upside leaves the net effect neutral yet adds to overall bearish options tilt. INTC printed 21.43M mixed across 199172 contracts and SPCX added 53.17M mixed across 263513 contracts which means tech hedging volume dominates the session total.
| Contract | Premium | Flow Type | Implication |
|---|---|---|---|
| NVDA | 175.76M | mixed | hedging split across 715111 contracts which means no single direction |
| SPCX | 53.17M | mixed | additional mixed size in 263513 contracts which means incremental hedging weight |
| INTC | 21.43M | mixed | 199172 contracts add to tech hedging total which means pressure on semiconductor names |
| SOXS | 6.21M | call-heavy | 14081 contracts lean volatility long which means traders expect further moves |
Price Position Relative to Max Pain
SPY closed at 733.44 which means price sits 32.16 points or 4.35 percent below the 766.00 max pain level for the expiring weekly. That dislocation of 34.16 points from the prior session close creates a magnet effect only if upside volume returns because current price support rests at 731.84. The 4.35 percent decline occurred on the same session that max pain held at 766.00 which means the market finished well below the strike that maximises aggregate option pain.
Dark Pool and Volume Context
Dark pool data shows zero prints which means no visible large block activity offsets the bearish options market sentiment. The absence leaves the options driven read unaltered because no fresh prints appear to counter the 1.143 put call ratio or the four bearish names flagged.
Scenario Triggers and Risk Metrics
Downside continuation holds 55 percent odds if SPY stays below 731.84 because the 4.35 percent gap and put call ratio above 1 remain intact. Reclaim of 766.00 max pain carries 25 percent odds because that level would close the dislocation and reduce the negative skew. Volatility spike beyond 26.64 carries 20 percent odds because the current VIX reading already prices immediate fear and any further rise would reinforce the bearish options alignment. Risk sits at 4.35 percent driven by the SPY percentage decline which means downside exposure scales directly with that session move.
| Experience Level | What to Watch on Tape |
|---|---|
| Beginner | Track the gap between closing price and max pain strike because the 32.16 point distance signals sentiment skew |
| Intermediate | Monitor put call ratio movement around 1.143 because shifts above or below 1 alter the net options bias |
| Advanced | Observe whale premium totals in NVDA and INTC because 175.76M and 21.43M mixed flows show where hedging concentrates |
Bearish options sentiment with put call ratio at 1.143 and price 32.16 below max pain points to downside pressure because whale flows remain mixed yet sentiment lists multiple bearish names.
This is analysis, not financial advice. Always manage your risk.