Microsoft (MSFT) – Daily Read
3 November 2026 | Stock | Titan Macro Desk
$506.52
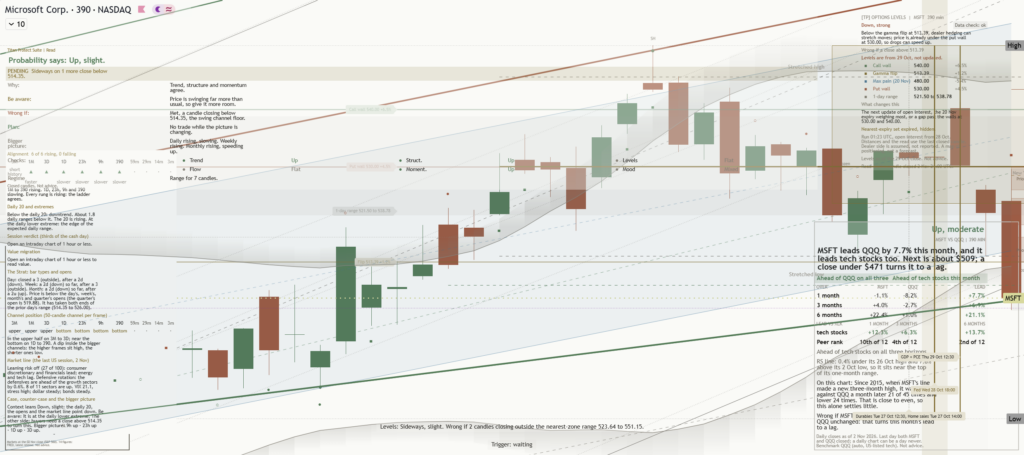
Microsoft at $506.52 is under clear near-term pressure after finishing the last session 2.9 percent lower, and the important point is that this weakness still looks like a pullback within a longer uptrend rather than a completed trend reversal. Conviction nevertheless needs restraint because momentum is roughly 5.1 percent down over the last two weeks, the stock is down near the floor of its one-month range, and repeated weakness at the lower boundary can turn an orderly reset into a more serious loss of confidence.
The immediate catalyst is a repricing of expectations after Microsoft failed to sustain the upper end of its recent range, which means valuation sensitivity and positioning are driving the stock more directly than a broad asset-class narrative. The one month average is $530.05, and price is below it, so the structure reads as a pullback, slipping under the one-month average while the longer trend still points up. The broader macro context matters only where shifts in risk appetite amplify that repricing, because a large growth stock can react sharply when investors demand stronger evidence before restoring a premium.
The first battle is around $510.00, which matters because recovering that nearer round number handle would show that pressure is being absorbed and would begin repairing the short-term structure. Beneath the market, the shelf of support at $504.96 sits about 0.3 percent below and is the key immediate defence because it is close enough to force a prompt decision between stabilization and continuation lower. The $500.00 handle is the next psychological line, but it cannot fully compensate for a confirmed loss of the shelf. Over the broader three month range of $380.65 to $551.15, the month swing high at $551.15 is about 8.8 percent above the current price, which means the distance back to the upper boundary is material and requires sustained recovery rather than a single strong session.
The bull path is straightforward: if $504.96 holds, then a recovery through $510.00 can draw the stock back toward $530.05 because that would indicate the recent pressure is fading and the longer rising structure is regaining control. If price then accepts above $530.05, the month swing high becomes relevant again; a decisive move above $551.15 opens the path toward $561.15 because clearing the established ceiling would confirm that demand has overcome the prior rejection. The bear path is equally clear: if $504.96 gives way and $500.00 fails to stabilize the stock, then downside pressure can accelerate because the market would have lost both the defined shelf and the nearest round number defence. Losing $504.96 exposes $380.65, though that outcome would represent a broad structural deterioration rather than an automatic straight-line move.
The main risk to the constructive interpretation is persistent trade below $504.96, especially if attempts to regain $510.00 repeatedly fail, because that would invalidate the idea that this is merely a contained pullback. Conversely, sustained recovery above $530.05 would weaken the bearish case, while a decisive move above $551.15 would invalidate it. The net take at $506.52 is cautiously constructive but tactically defensive because support is close, momentum is negative, and the stock must prove that the lower boundary can hold before the longer uptrend deserves renewed confidence.
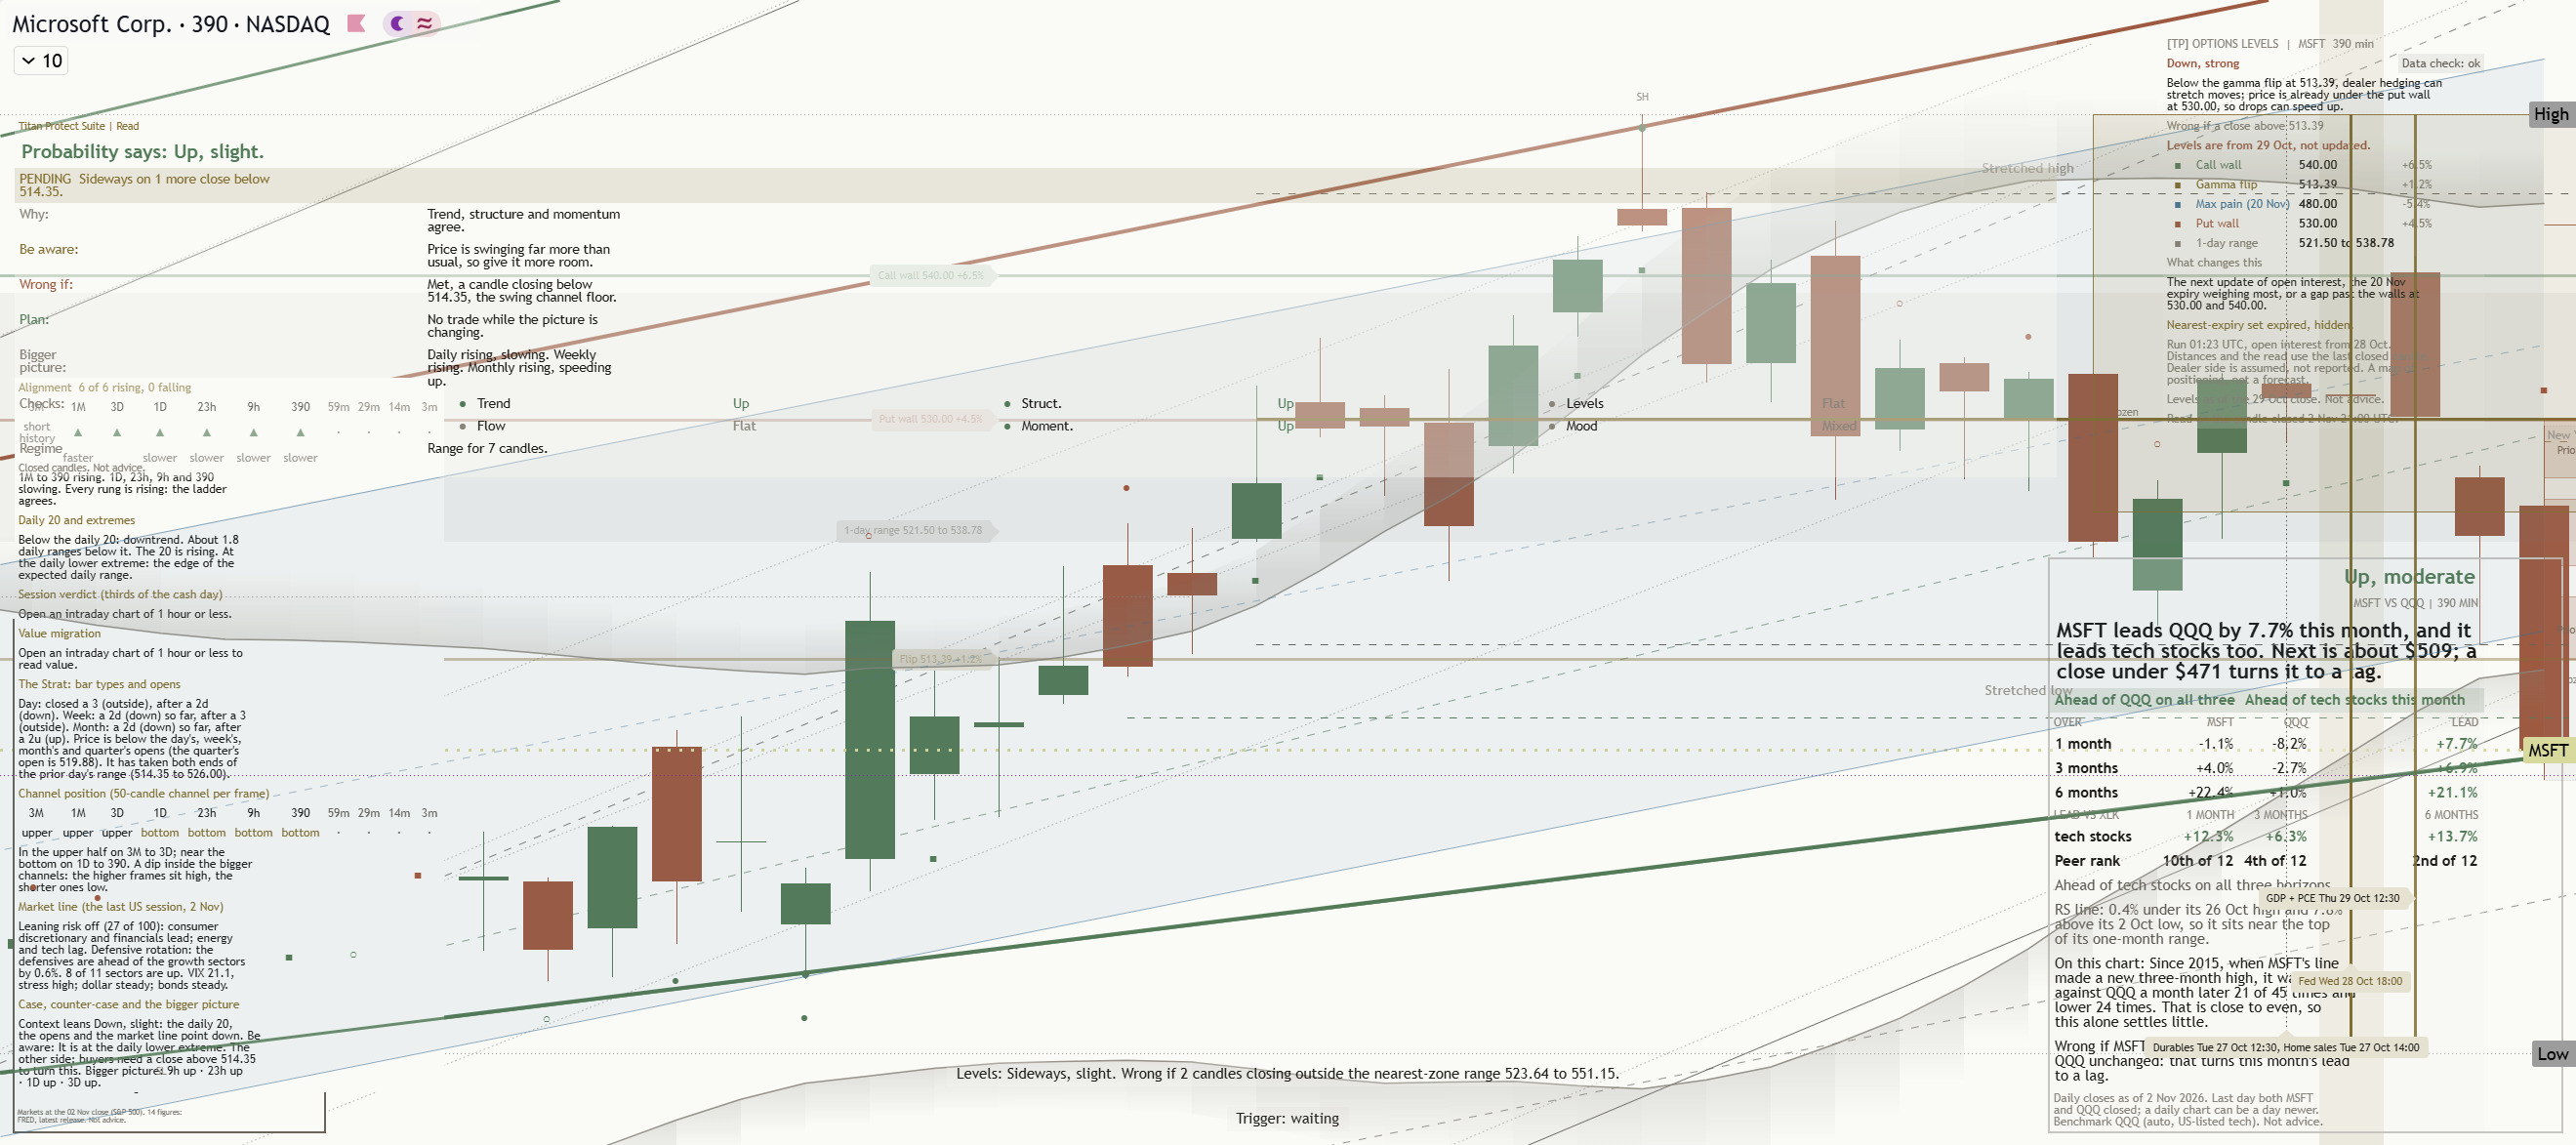
Key levels: support $504.96 (0.3% below), resistance $551.15 (8.8% above), one-month average $530.05, three-month range $380.65 to $551.15.
This is analysis, not financial advice. Always do your own research and manage your risk.