Microsoft (MSFT) – Daily Read
30 October 2026 | Stock | Titan Macro Desk
$530.14
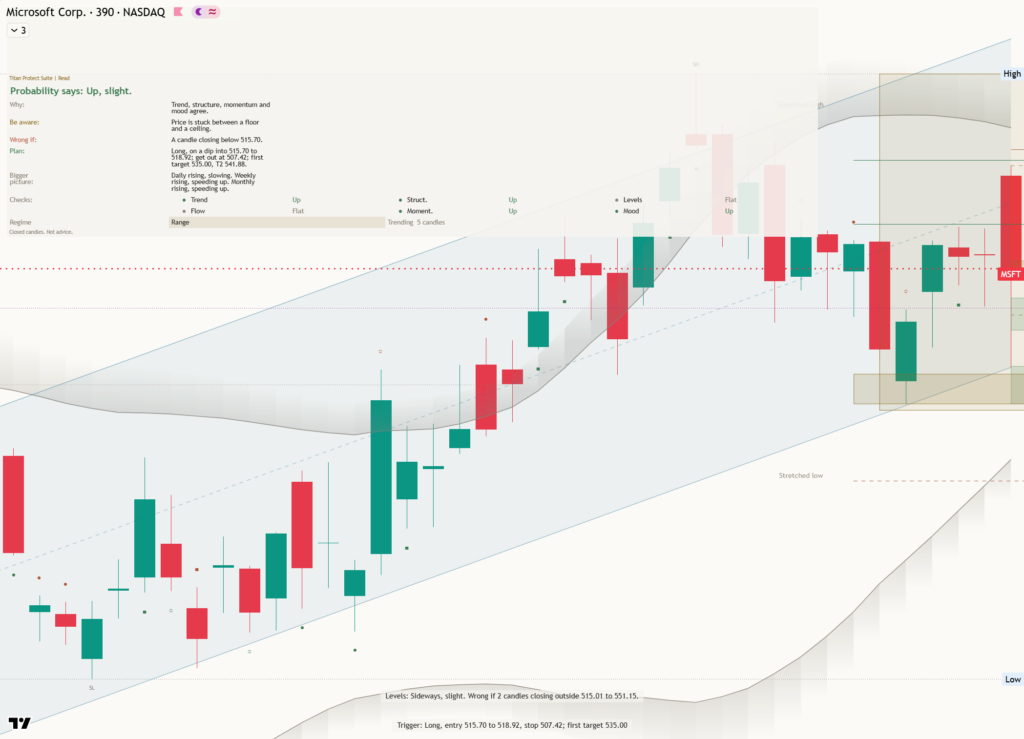
Microsoft is consolidating rather than breaking trend, with the last price at $530.14 after finishing the last session 0.2 percent lower. It is sitting mid-range over the past month, which means neither side has established control after the recent advance. The structure reads as a pullback because price has slipped below the one month average of $530.76 while the longer trend still points up. That distinction matters: weakness inside an intact advance calls for patience, but continued failure to recover the average would make the pullback progressively less benign.
The immediate catalyst is whether large-cap technology can regain leadership as the market weighs growth expectations against valuation sensitivity, because Microsoft needs renewed demand for durable earnings exposure to restart its advance. Momentum is roughly 1.7 percent down over the last two weeks, which means the stock enters this test with fading short-term force rather than accelerating pressure. That loss of pace explains why the current area feels balanced. It also makes the next directional move more informative, since a recovery would show that recent weakness was mainly position clearing, while further erosion would suggest a broader reassessment within the asset class.
The nearer round number handles at $540.00 and $530.00 define the first contest. Holding around $530.00 matters because it keeps price anchored near the current balance area and within reach of the one month average at $530.76. A sustained recovery through $540.00 would signal improving control and refocus attention on the month swing high at $551.15, about 4.0 percent above the current price. That high is the principal resistance because it marks the limit of the latest advance. Below, a shelf of support at $510.33, about 3.7 percent below, is the key defense separating an orderly pullback from material structural damage.
The wider map reinforces that asymmetry because the three month range is $377.40 to $551.15. Microsoft is therefore much closer to the upper boundary than the lower one, which means the stock retains the benefit of its longer advance but also faces a demanding test near prior supply. A decisive move above $551.15 opens the path toward $561.15 because clearing the range ceiling would remove the most visible barrier and confirm that demand has absorbed resistance. That would turn consolidation into continuation, especially if $551.15 then holds when tested from above.
The bull path is straightforward: if Microsoft stabilizes above $530.00, reclaims $530.76, and then clears $540.00, the pressure on $551.15 should build because each step would show progressively stronger control. If $551.15 gives way decisively, then $561.15 becomes the next path. The bear path begins if $530.00 fails to hold and rebounds cannot regain $530.76, because that would keep the pullback active. If weakness then reaches and loses $510.33, it exposes $377.40, which means the market would be questioning the entire three month advance rather than merely correcting its latest leg.
The main risk to the constructive view is persistent acceptance below $510.33 because that would invalidate the idea that the decline is contained within an upward structure. Conversely, the bear case is invalidated by firm acceptance above $551.15 and continuation toward $561.15. Net, $530.00 is the immediate balance point, $510.33 is the structural line, and $551.15 is the confirmation gate, which means the read remains cautiously constructive while support holds but demands proof before conviction increases.
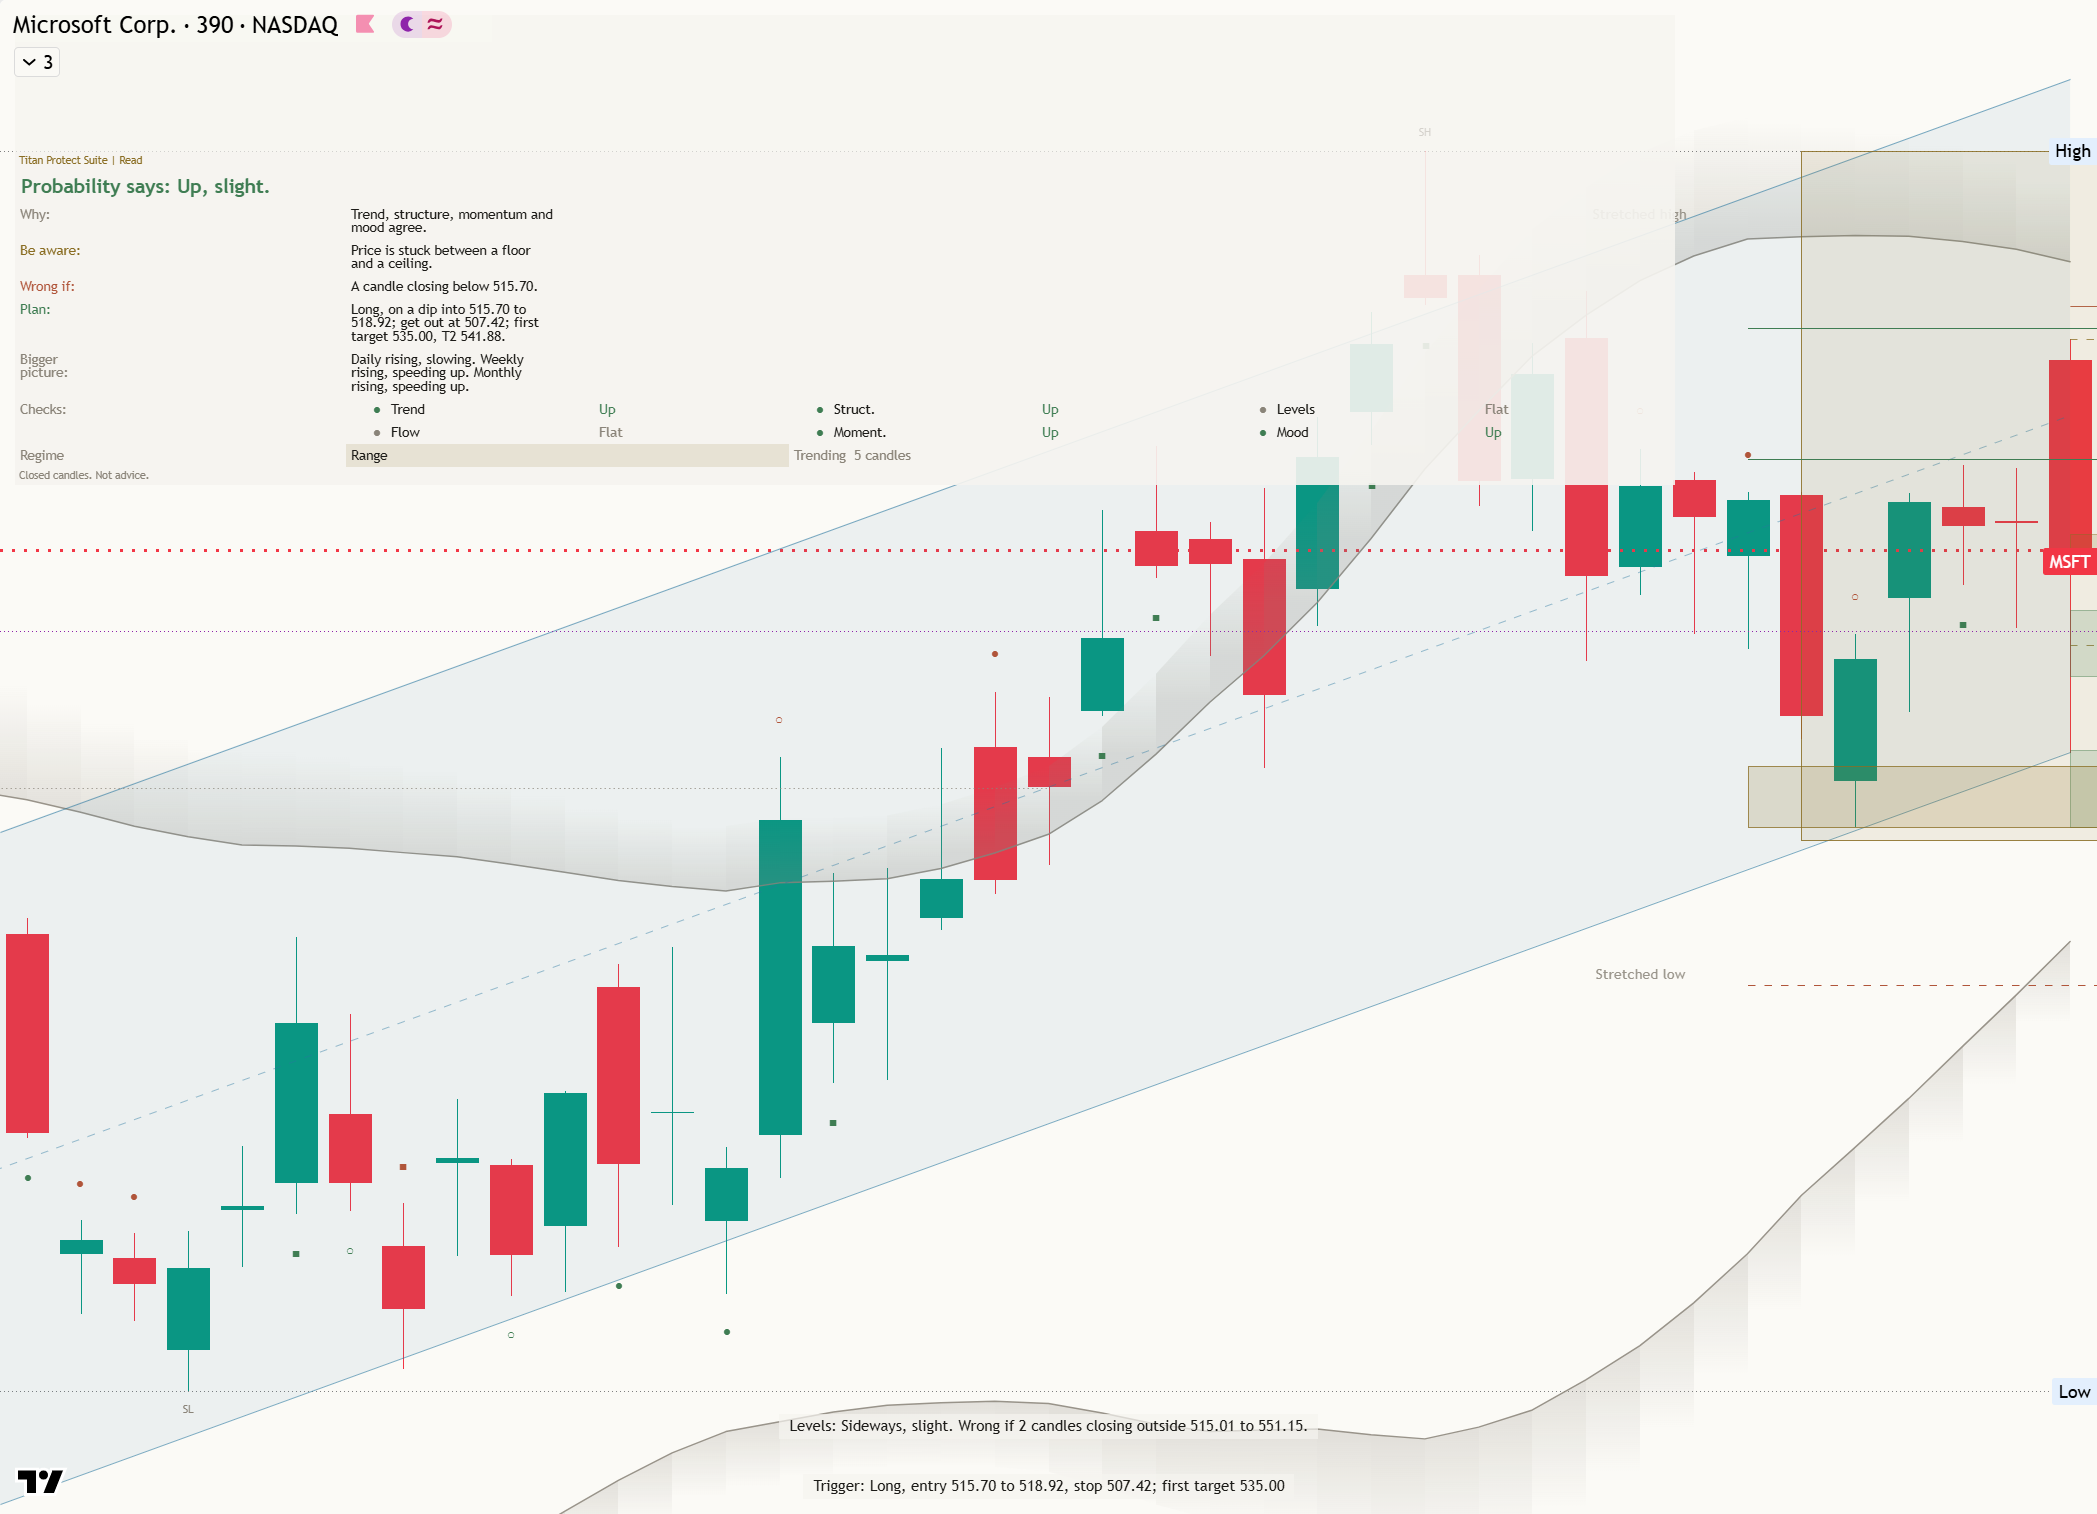
Key levels: support $510.33 (3.7% below), resistance $551.15 (4.0% above), one-month average $530.76, three-month range $377.40 to $551.15.
This is analysis, not financial advice. Always do your own research and manage your risk.