Meta (META) – Daily Read
30 October 2026 | Stock | Titan Macro Desk
$624.52
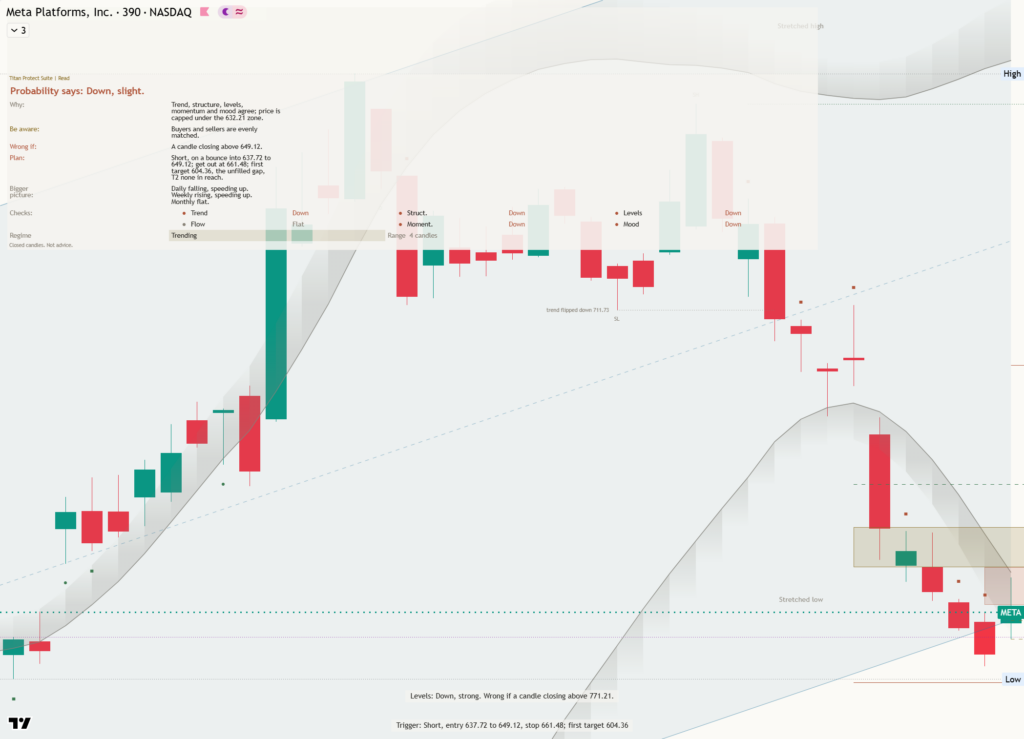
Meta at $624.52 is attempting to stabilize after finishing the last session 2.0 percent higher, but the dominant message remains corrective rather than fully repaired because the stock is still down near the floor of its one-month range. The clear view is cautiously constructive over the longer horizon and defensive in the near term. Momentum roughly 15.2 percent down over the last two weeks shows how aggressively expectations have reset, which means one positive session is evidence of demand returning, not yet proof that control has shifted back to the bulls.
The one month average at $696.76 is the key reference for that tension because price is below it, and the structure reads as a pullback, slipping under the one-month average while the longer trend still points up. The macro backdrop matters mainly through the market’s tolerance for long-duration growth valuations, which means Meta remains sensitive to changes in risk appetite even when company-specific execution is steady. For this stock, the more direct catalyst is whether confidence in advertising durability, spending discipline, and returns from artificial intelligence investment can overcome concern about the scale and timing of those expenditures. That debate matters because the current weakness reflects a valuation and expectations adjustment as much as a simple loss of operational confidence.
The nearer round number handles at $630.00 and $620.00 define the immediate contest because they bracket the current price and reveal whether the latest rebound can attract follow-through. Holding $620.00 would keep stabilization credible, while sustained acceptance above $630.00 would suggest that pressure is easing and attention can return toward $696.76. The more important shelf of support sits at $609.00, about 2.5 percent below, because that is the last nearby area capable of preserving the pullback interpretation. The three month range of $524.52 to $779.82 provides the wider map, while the month swing high at $771.27, about 23.5 percent above the current price, remains major resistance because it marks the point where prior supply overwhelmed demand.
The bull path is straightforward: if Meta holds $620.00, defends $609.00 during weakness, then reclaims $630.00 and $696.76, the pullback should mature into a broader recovery because successive resistance would be turning into support. A decisive move above $771.27 opens the path toward $779.82, which means the stock would be challenging the ceiling of its three month range rather than merely retracing damage. The bear path is equally clear: if rebounds fail beneath $630.00 and pressure forces a sustained break of $609.00, then losing $609.00 exposes $524.52 because the nearby shelf would no longer separate current price from the bottom of the wider range.
The principal risk to the constructive longer view is that company-specific spending concerns or weaker confidence in monetization keep Meta below $696.76, because repeated failures there would make the decline look less like a contained pullback and more like a deeper repricing. The read is invalidated on the downside by a decisive loss of $609.00 and strengthened materially only through recovery of $696.76. Net, Meta remains a longer-trend leader under near-term pressure, with $609.00 defining whether patience is warranted and $696.76 defining whether genuine control has returned.
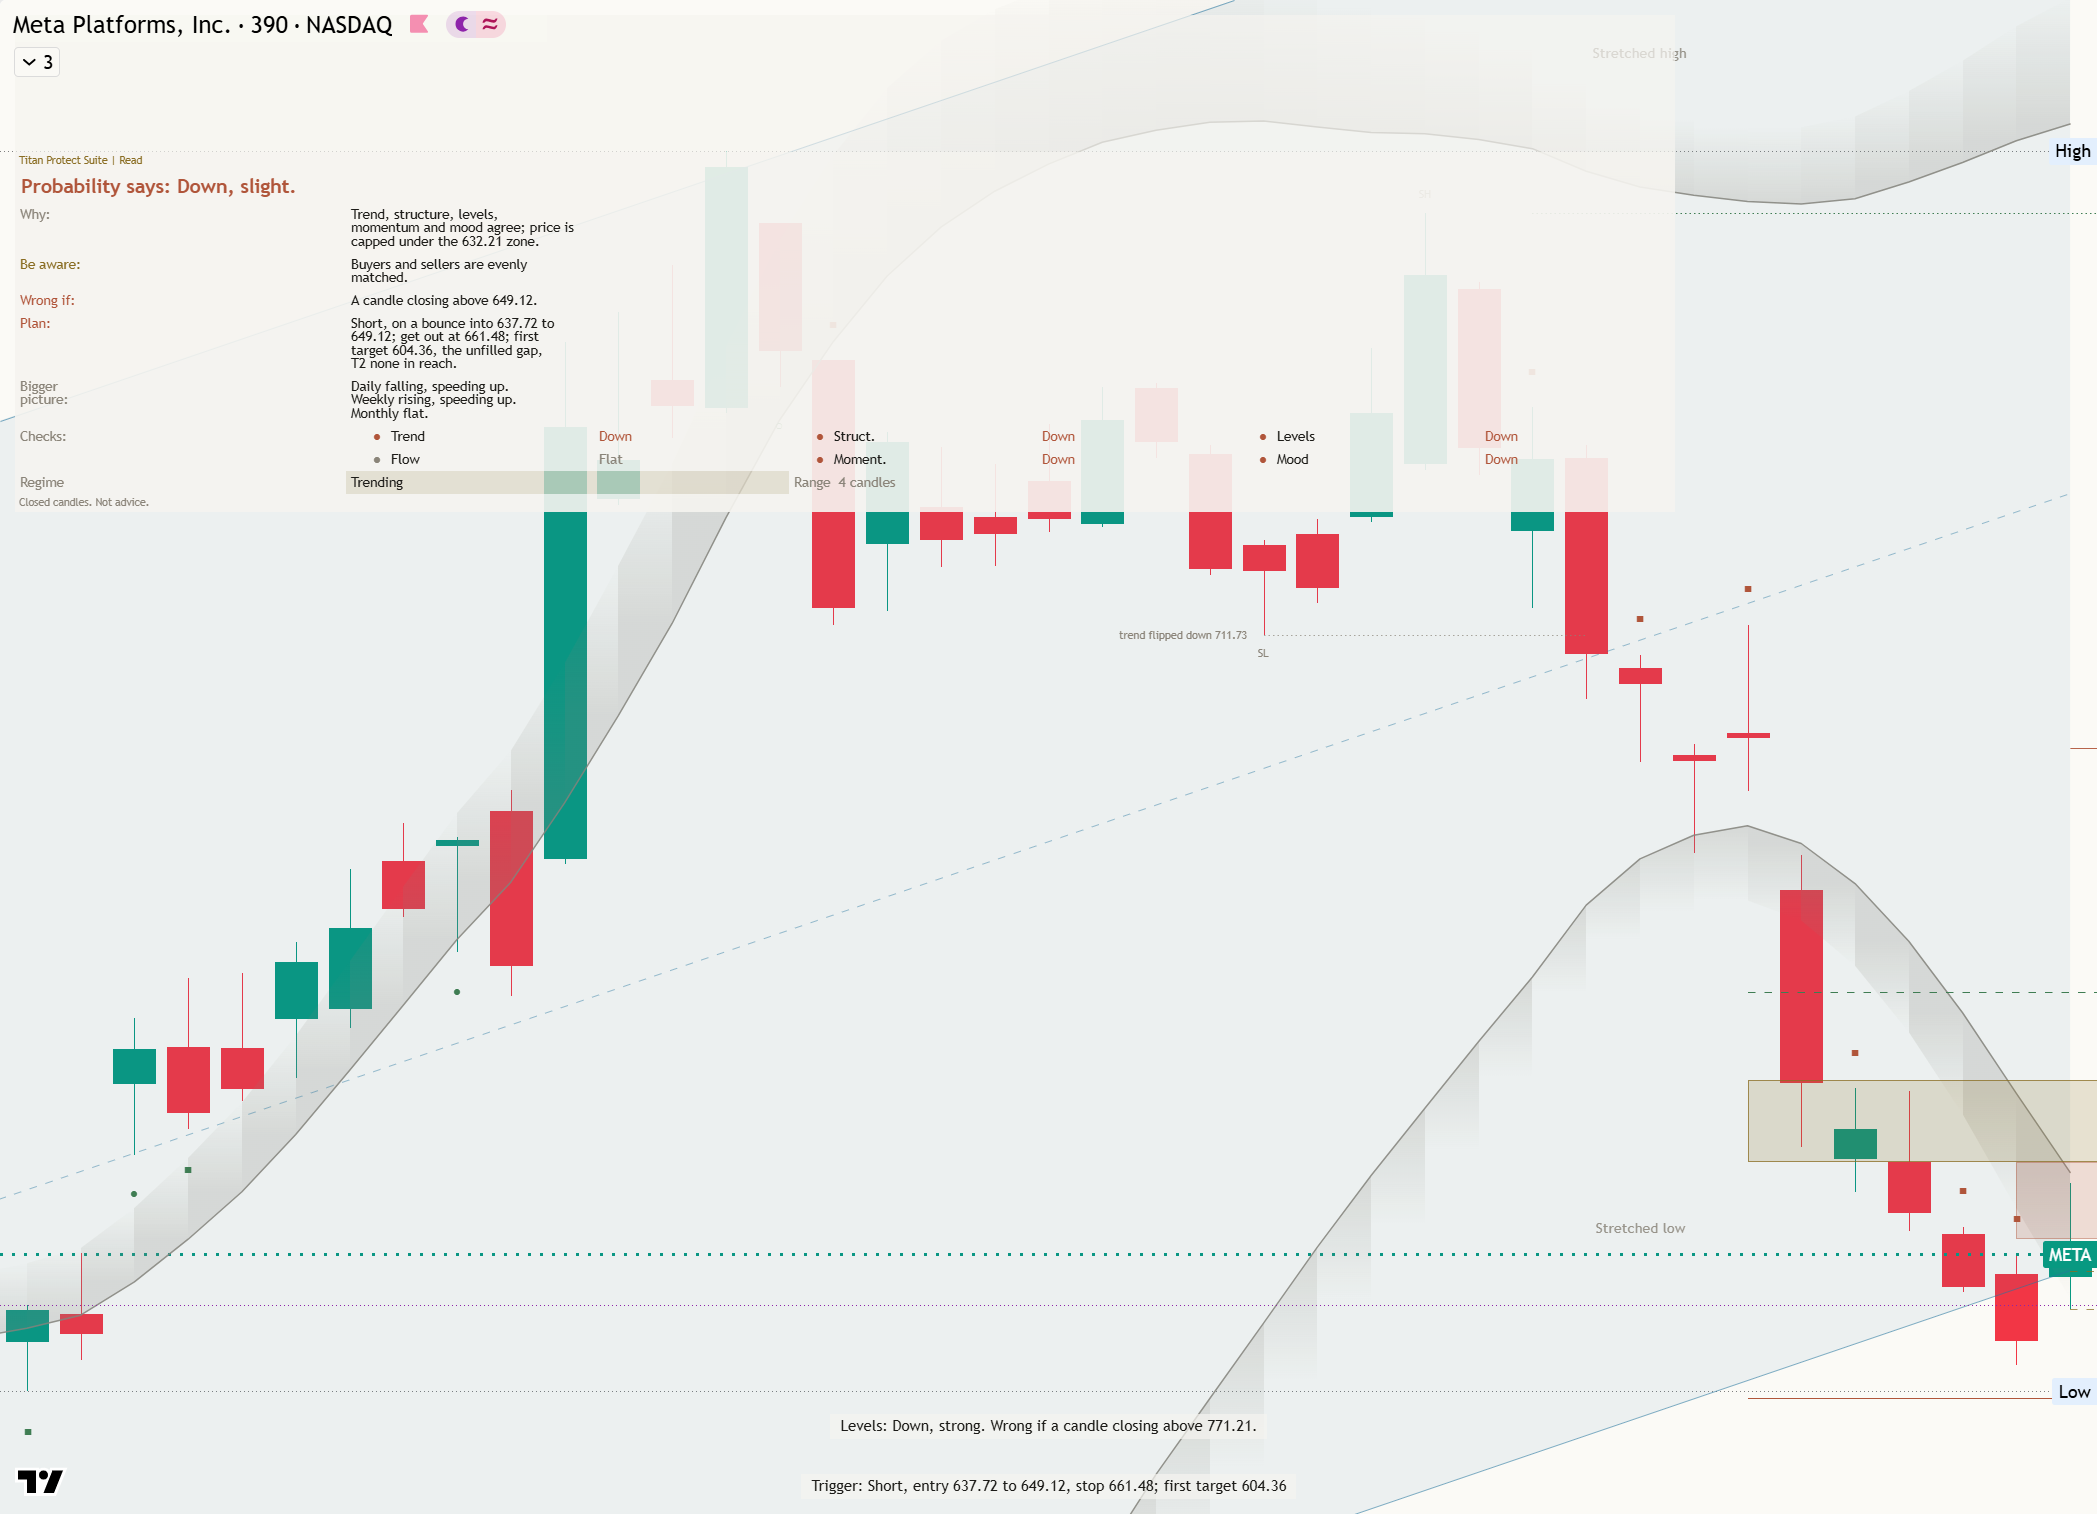
Key levels: support $609.00 (2.5% below), resistance $771.27 (23.5% above), one-month average $696.76, three-month range $524.52 to $779.82.
This is analysis, not financial advice. Always do your own research and manage your risk.