S&P 500 (SPX) – Daily Read
3 November 2026 | Index | Titan Macro Desk
7,541.4
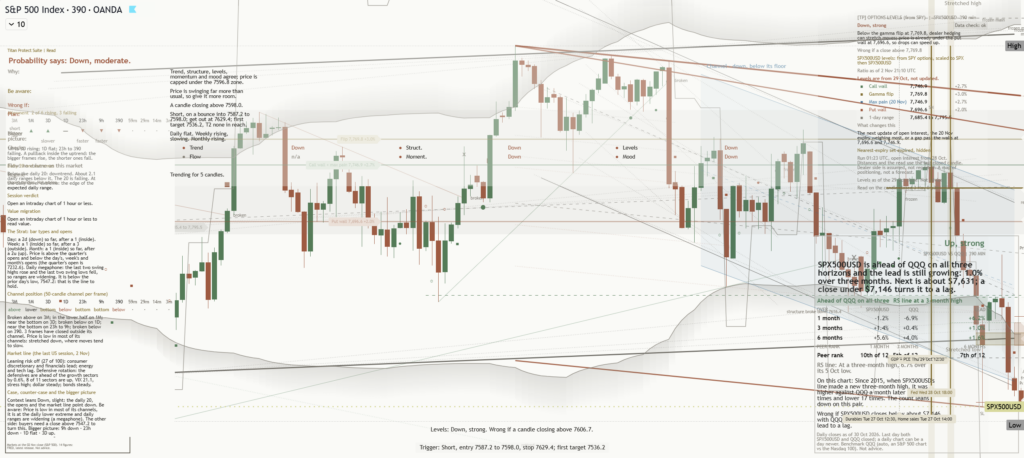
The S&P 500 at 7,541 is testing whether an orderly pullback can remain contained or is becoming a deeper correction. It was little changed on the session, under 0.05%, but that surface calm matters because the index is down near the floor of its one-month range after losing momentum. The longer trend still points up, yet the immediate balance has shifted toward defense. This is not a confirmed trend reversal, but it is a market that must prove demand remains present before confidence can rebuild.
The key context is the loss of the one month average at 7,704, because price is below it and the structure reads as a pullback, slipping under the one-month average while the longer trend still points up. Momentum is roughly 2.2 percent down over the last two weeks, which means the pressure is persistent enough to matter even without a dramatic latest-session decline. For an index, that combination often reflects fading participation and caution across its major components rather than a single shock. The month swing high at 7,845, about 4.0 percent above the current price, now defines the distance between stabilization and a renewed advance.
The immediate shelf of support at 7,528, about 0.2 percent below, is critical because it is close enough to be tested without requiring a major change in sentiment. Holding it would show that demand still defends the lower edge of the recent range. The nearer round number handle at 7,500 provides a visible psychological reference beneath that shelf, while 7,750 is the first meaningful overhead handle that would signal stronger recovery traction. The broader three month range of 7,314 to 7,845 matters because its boundaries separate ordinary consolidation from a more consequential directional break.
The bull path is straightforward: if 7,528 continues to hold and the index reclaims 7,704, then the pullback begins to look repaired rather than merely paused. A push through 7,750 would strengthen that interpretation, while a decisive move above 7,845 opens the path toward 8,000 because the index would have cleared the range ceiling and removed the most obvious overhead resistance. The bear path is equally clear: if support fails, then losing 7,528 exposes 7,314. A sustained move beneath 7,500 would reinforce that downside sequence, which means the market would be accepting lower prices rather than briefly probing support.
The main risk to the bullish read is that apparent stability at 7,541 masks continued erosion beneath the surface, because a quiet session does not reverse the roughly 2.2 percent decline. Conversely, the bearish read is invalidated if support holds and price recovers 7,704, then proves that strength above 7,750. Net, the longer trend still favors eventual recovery, but the near-term burden of proof sits with the bulls while 7,528 remains under pressure and 7,845 remains resistance.
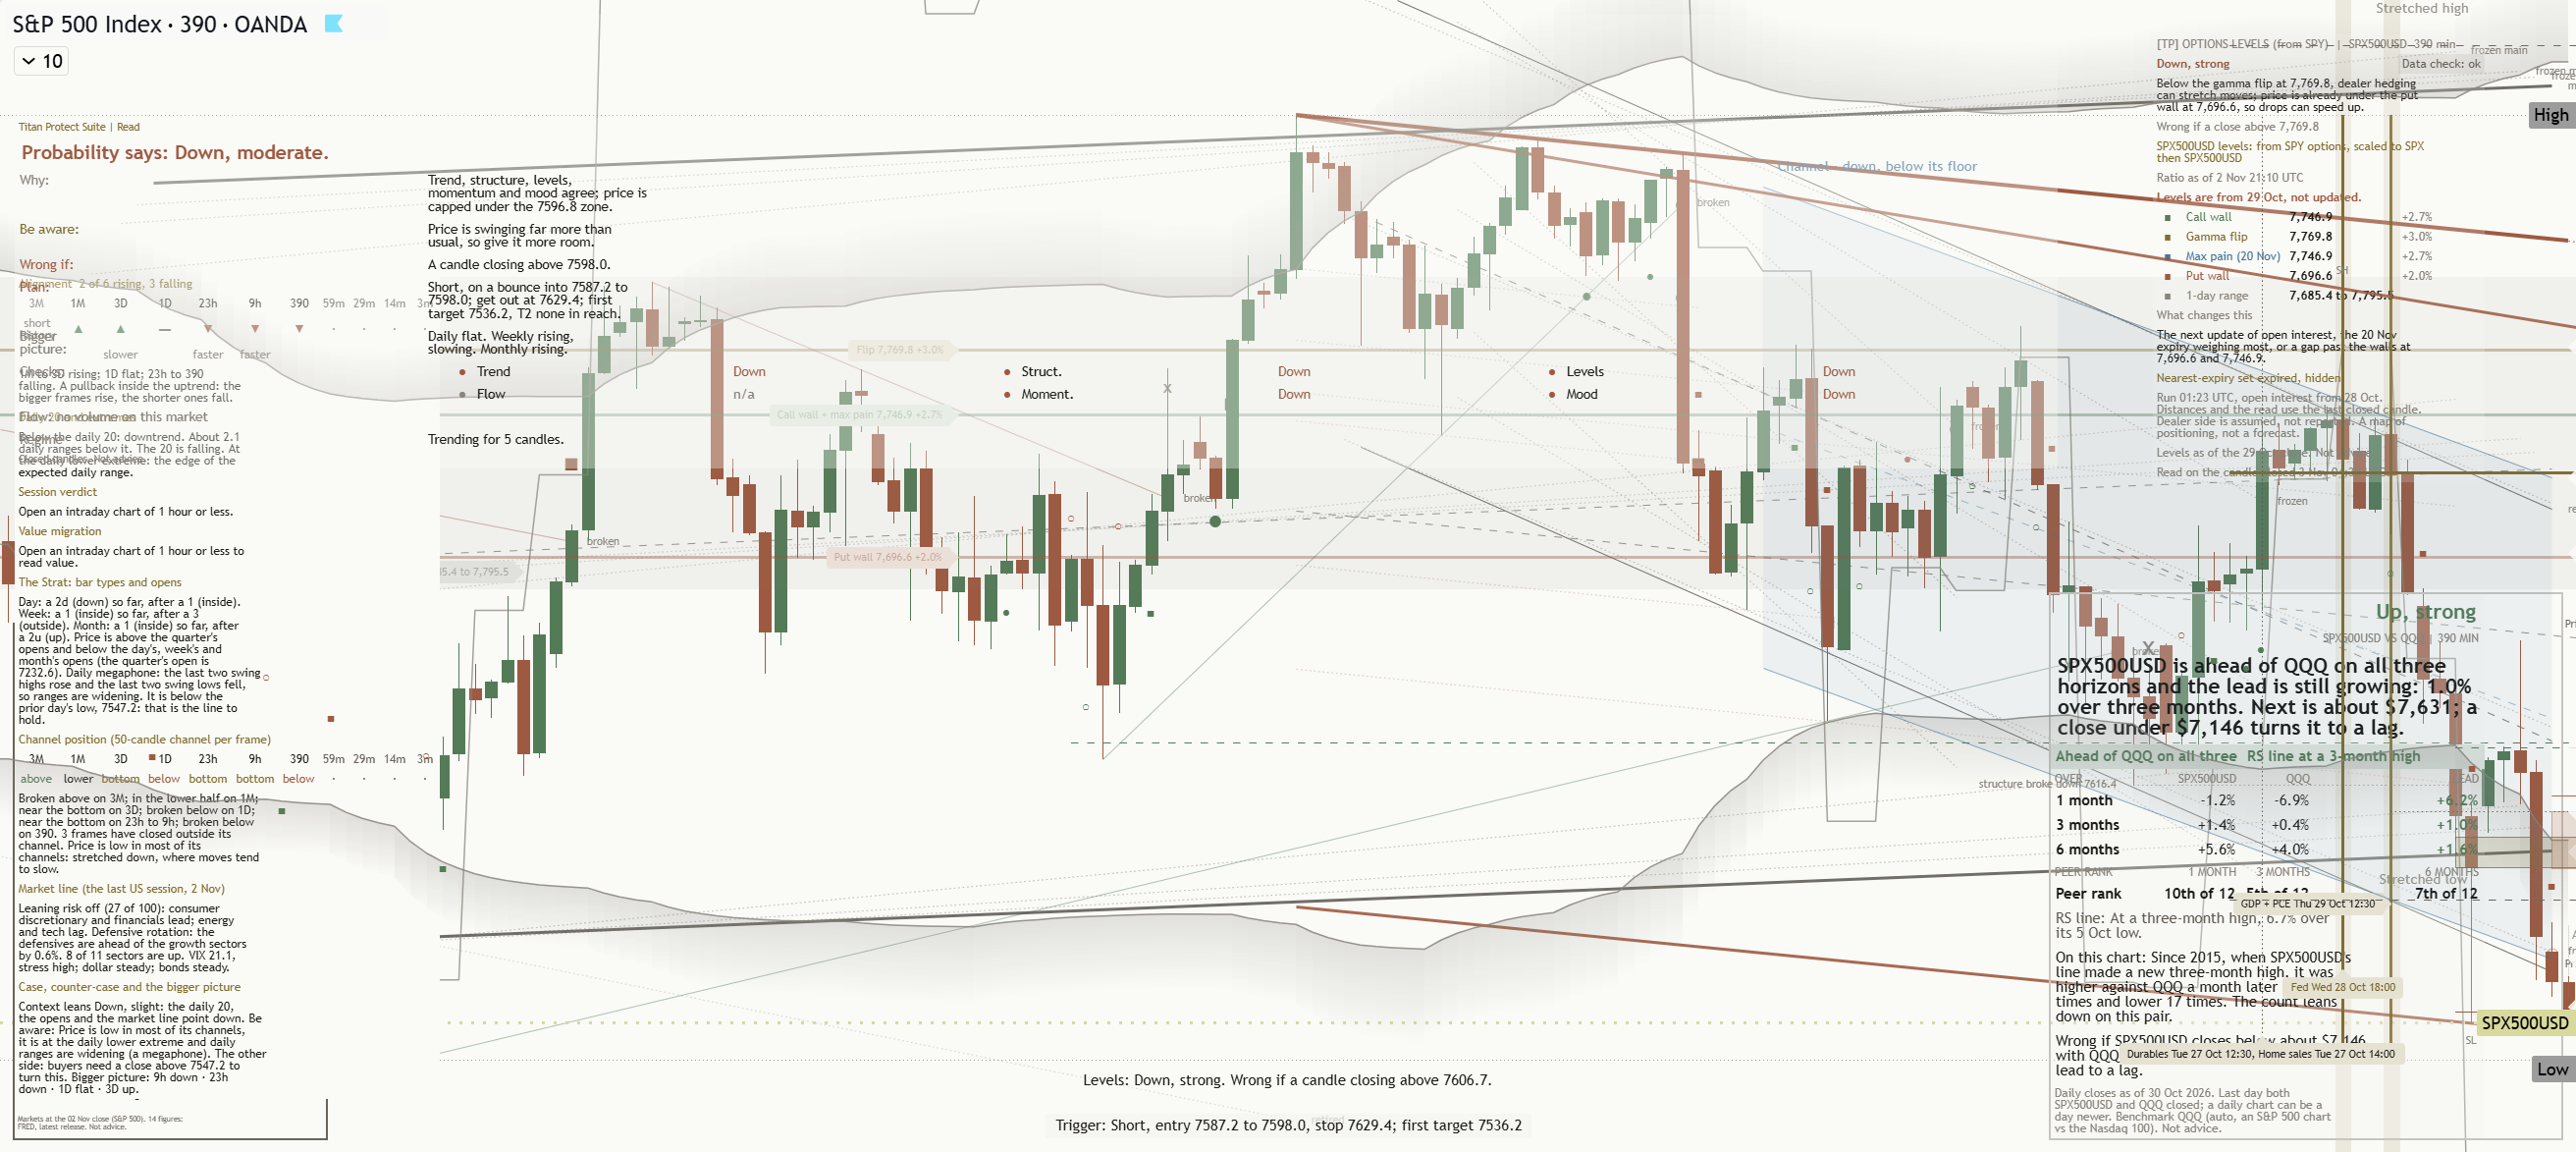
Key levels: support 7,528 (0.2% below), resistance 7,845 (4.0% above), one-month average 7,704, three-month range 7,314 to 7,845.
This is analysis, not financial advice. Always do your own research and manage your risk.