Equity Index Snapshot
Nasdaq rose 1.27 percent to 26967.56 because small caps and tech led gains which means rotation into growth names pulled the broader tape higher on 1.28 billion shares. Dow fell 0.46 percent to 51284.04 while QQQ added 1.38 percent to 655.95 which means blue chips lagged defensives and created a clear style split. SPX closed at 7374.87 after a 0.29 percent gain because the session low of 7369.55 held early support which means downside attempts failed to extend. IWM rose 0.93 percent to 273.51 on 22.4 million shares which means small cap participation added breadth confirmation to the growth move.
| Index | Close | Change | Implication |
|---|---|---|---|
| NDX | 26967.56 | +1.27% | Tech volume drove selective advance |
| DIA | 512.13 | -0.42% | Blue chip lag widened style gap |
| SPY | 735.22 | +0.30% | Modest net gain despite high print |
Style and Sector Rotation Detail
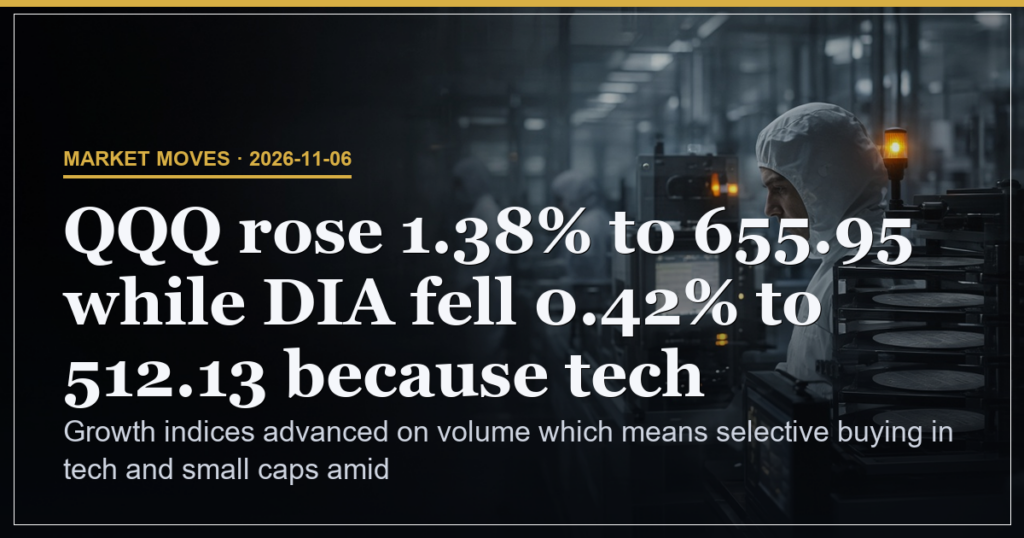
QQQ rose 1.38 percent to 655.95 while DIA fell 0.42 percent to 512.13 because tech outperformed blue chips which means capital concentrated in growth benchmarks rather than broad equity exposure. Russell 2000 gained 1.13 percent to 2760.68 because small cap outperformance aligned with Nasdaq leadership which means the tape reflected risk appetite in higher beta names. Volume on NDX reached 1.28 billion shares which means the advance carried conviction rather than thin participation.
Futures and Overnight Indicators
ES futures printed at 7404.75 up 0.29 percent because cash SPX closed at 7374.87 and carried modest momentum into the next session which means overnight positioning aligned with the equity close. NQ futures rose 1.30 percent to 27098.50 which means tech futures extended the cash outperformance seen in QQQ. YM futures fell 0.42 percent to 51399 which means Dow weakness persisted after hours and reinforced the style divergence.
| Future | Price | Change | Implication |
|---|---|---|---|
| NQ=F | 27098.5 | +1.30% | Tech momentum carried forward |
| YM=F | 51399 | -0.42% | Blue chip pressure unchanged |
| RTY=F | 2762.3 | +0.98% | Small cap futures confirmed rotation |
Commodity and Safe Haven Moves
Gold dropped 0.94 percent to 4074.90 because equity gains lifted risk appetite which means lower safe haven demand reduced bullion bids. Silver fell 0.47 percent to 51.99 while copper rose 0.27 percent to 6.266 which means base metals showed modest growth linkage against precious metal weakness. Crude held near 90.83 up 0.34 percent which means energy stayed steady without adding to the risk off tone elsewhere.
Key Levels and Scenario Weights
SPX support sits at 7369 low and resistance at 7444 high while Nasdaq support rests at 26887 low which means these prints define the immediate range. 45 percent weight to upside extension above 7444 because sustained volume would confirm rotation continuation. 35 percent weight to range bound trade between 7369 and 7444 because mixed blue chip action limits follow through. 20 percent weight to breakdown below 7369 because failure at the low would shift focus to defensives. Risk sits at 15 percent because the 1.27 percent Nasdaq gain versus 0.46 percent Dow decline leaves the tape exposed to reversal on any volume spike.
What Each Experience Level Should Watch
| Level | Focus from Tape |
|---|---|
| Beginner | Track Nasdaq versus Dow spread to see style leadership |
| Intermediate | Watch 7369 SPX low for continuation or reversal signals |
| Advanced | Monitor futures basis and gold correlation for rotation durability |
Growth indices advanced on volume which means selective demand in tech and small caps amid mixed blue chip action.
This is analysis, not financial advice. Always manage your risk.