Microsoft (MSFT) – Daily Read
25 October 2026 | Stock | Titan Macro Desk
$524.51
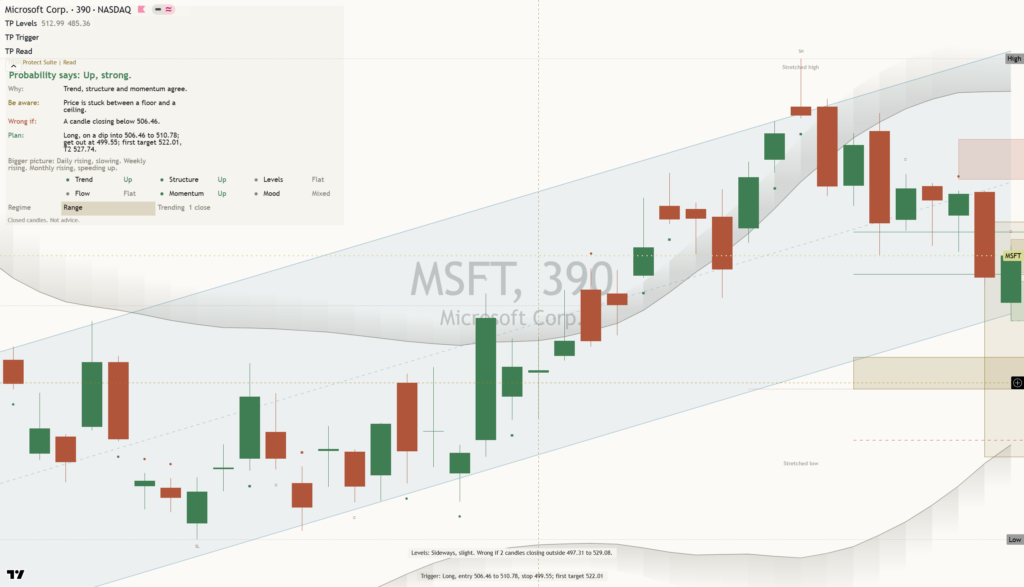
Microsoft at $524.51, after finishing the last session 0.7 percent higher, is consolidating rather than reversing, because the stock is sitting mid-range over the past month while its longer trend still points up. The clear view is cautiously constructive, but conviction should remain conditional: the recent loss of pace shows that leadership is being tested, and the next meaningful move must come from reclaiming nearby overhead ground. That matters because a durable recovery would restore trend participation, while continued hesitation would turn an orderly pullback into a deeper reset.
The immediate context is a stock digesting prior strength, with momentum roughly 2.0 percent down over the last two weeks and the one month average at $526.70 above price. The structure reads as a pullback, slipping under the one-month average while the longer trend still points up, which means weakness has not yet displaced the broader advance. For this asset class, the key catalyst is whether Microsoft-specific confidence in durable growth and execution can overcome valuation sensitivity in the wider market. Macro conditions matter only insofar as shifts in growth expectations and risk appetite affect the premium investors will sustain for large technology companies, because Microsoft’s scale makes that premium central to how quickly the pullback can repair.
The nearer round number handles at $530.00 and $520.00 define the first contest, because they bracket current price and should reveal whether demand is strengthening or merely stabilizing. Holding $520.00 keeps the consolidation contained, while acceptance above $530.00 would put the one month average back beneath price and improve the tone. The month swing high at $551.15, about 5.1 percent above the current price, is the decisive resistance because it marks where the latest advance stopped. Below, a shelf of support at $491.22, about 6.3 percent below, is the major defense because failure there would break the pullback’s orderly shape. The three month range of $373.35 to $551.15 shows the breadth of the prior move, which means the lower boundary is not a routine reference but the next major downside marker if support gives way.
The bull path is straightforward: if $520.00 continues to hold, price recovers $530.00, and then clears $551.15 decisively, the path opens toward $561.15 because the market would have absorbed the pullback and removed the visible range ceiling. The bear path begins if rebounds fail beneath $530.00 and pressure pushes through $520.00. If $491.22 is then lost, $373.35 becomes exposed because the nearest established shelf would no longer contain supply. The sequence matters more than any single intraday probe, which means follow-through around these levels should carry more weight than a brief touch.
The main risk to the constructive read is that weakness beneath $526.70 persists and turns the current 2.0 percent two-week decline into sustained deterioration, because that would contradict the idea of a contained pause. A decisive loss of $491.22 invalidates the pullback thesis and shifts the balance toward $373.35, while a decisive move above $551.15 invalidates the cautious stance and confirms renewed expansion toward $561.15. Net, Microsoft remains constructive above major support but unproven beneath resistance, which means patience is warranted until either $530.00 is reclaimed with persistence or $491.22 fails with confirmation.
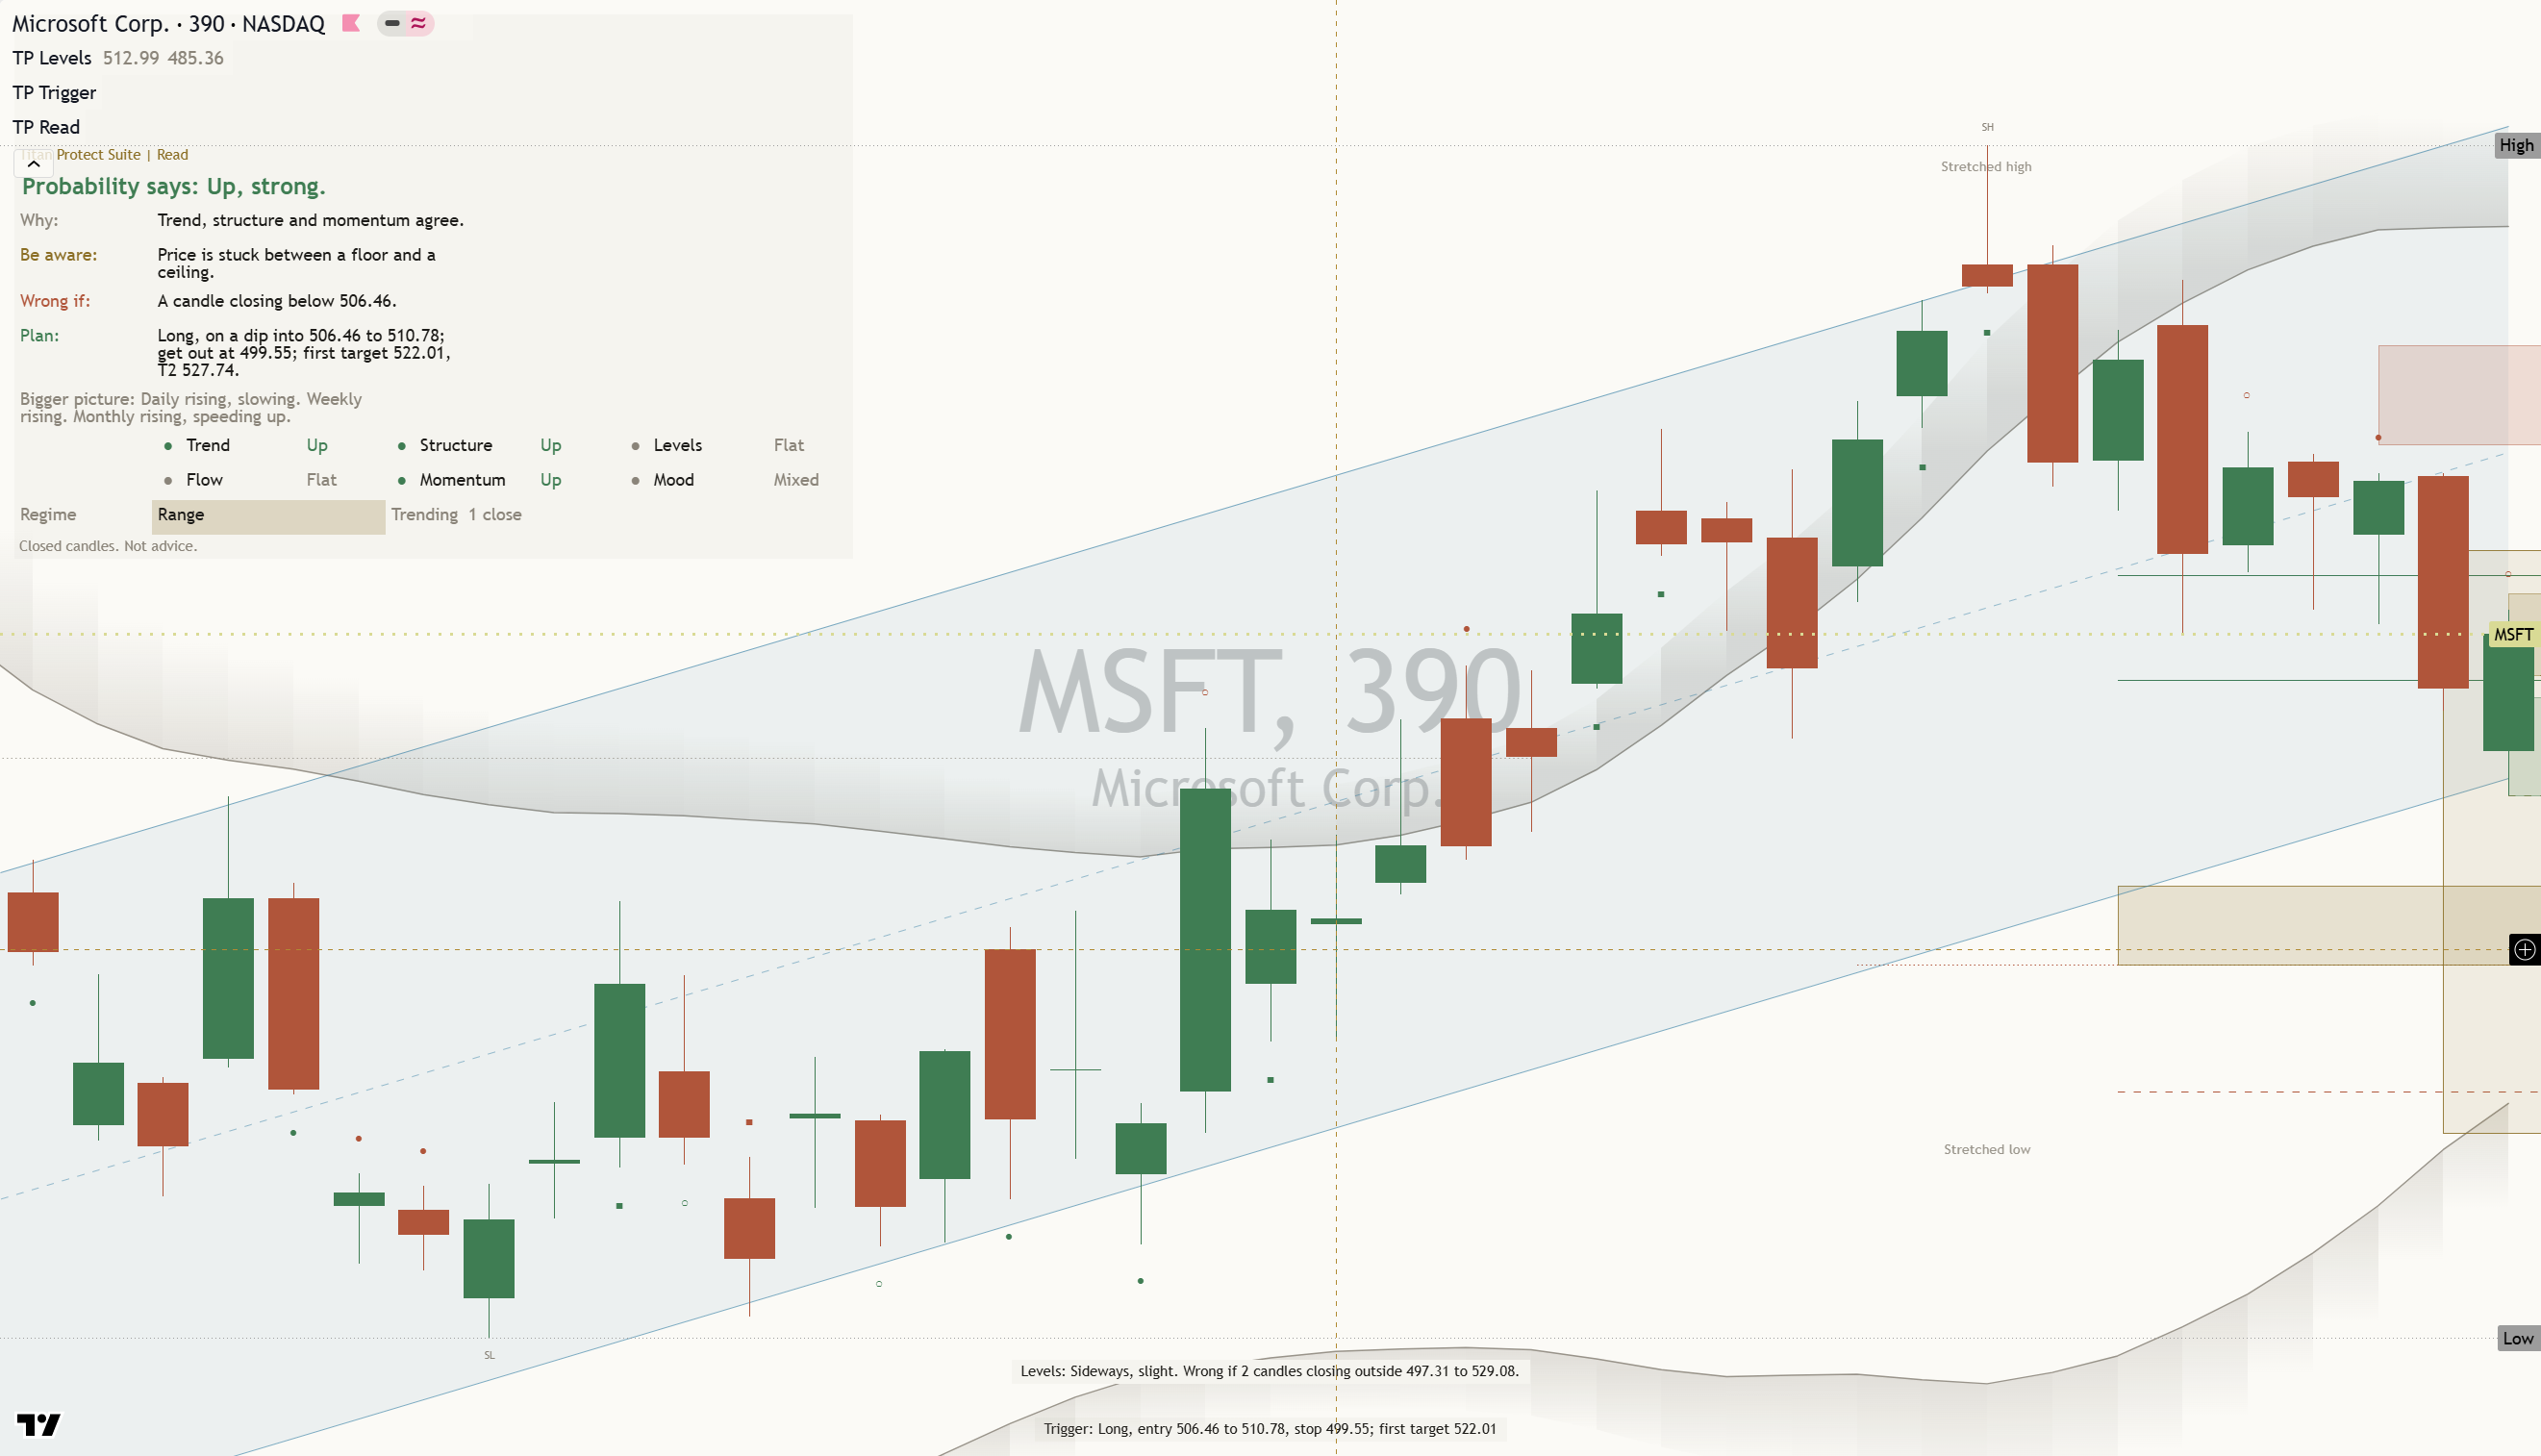
Key levels: support $491.22 (6.3% below), resistance $551.15 (5.1% above), one-month average $526.70, three-month range $373.35 to $551.15.
This is analysis, not financial advice. Always do your own research and manage your risk.