FTSE 100 (UKX) – Daily Read
10 October 2026 | Index | Titan Macro Desk
10,570.4
As of 10 October 2026, the FTSE 100 is attempting a meaningful rebound without yet escaping its broader corrective structure. Last price 10,570, 1.2 percent higher on the day, shows that buyers have regained near-term control, but the index remains below the levels needed to confirm a durable turn. The clear view is cautiously bearish beneath resistance: the bounce matters because it eases immediate pressure, yet it does not overturn a market still struggling to rebuild sustained demand.
The wider macro backdrop is defined by uncertainty around growth, policy expectations, currencies, and the earnings resilience of large international companies. That mix can support the FTSE 100 when investors favor established cash-generative businesses, but it can also leave the index vulnerable when global risk appetite weakens. Instrument-specific positioning remains conflicted. It is sitting mid-range over the past month, while momentum roughly 1.1 percent down over the last two weeks shows that the latest advance follows a period of persistent softness. The one month average 10,616 is still overhead; price is below it, and the structure reads as a downtrend, price under both its one-month and longer averages. Buyers therefore have more to prove than one strong session.
The nearer round number handles at 10,750 and 10,500 frame the immediate contest. Holding above 10,500 would suggest that buyers are absorbing supply and establishing a firmer base, while a move through 10,750 would show that the recovery is gaining credibility. The month swing high 10,823, about 2.4 percent above the current price, is the more important ceiling because it marks where the recent advance previously failed. A decisive move above 10,823 opens the path toward 10,990, the upper boundary of the three month range 10,367 to 10,990. On the downside, a shelf of support at 10,367, about 1.9 percent below, is the key defensive line. It is reinforced by being the lower boundary of that broader range, so failure there would signal that balance has broken in favor of sellers. Losing 10,367 exposes 10,250.
The bull path is straightforward: if 10,500 continues to hold, then buyers can press into 10,750; if that supply is absorbed, then 10,823 becomes the confirmation test. A decisive break there would shift the structure from rebound toward recovery and bring 10,990 into view. The bear path begins if the index cannot sustain trade above 10,500. If rejection below the one month average 10,616 restores selling pressure, then the market can rotate back toward 10,367. If that shelf gives way, then 10,250 becomes the logical downside destination as the range resolves lower.
The principal risk to the cautious stance is a clean recovery through 10,823, which would invalidate the idea that the current strength is merely corrective. Conversely, repeated failure around 10,616 or 10,750 would undermine the bounce, especially if accompanied by a loss of 10,500. Net, the FTSE 100 has improved tactically but remains structurally fragile. Respect the rebound, but conviction belongs with buyers only above 10,823; beneath it, the burden of proof remains on the upside.
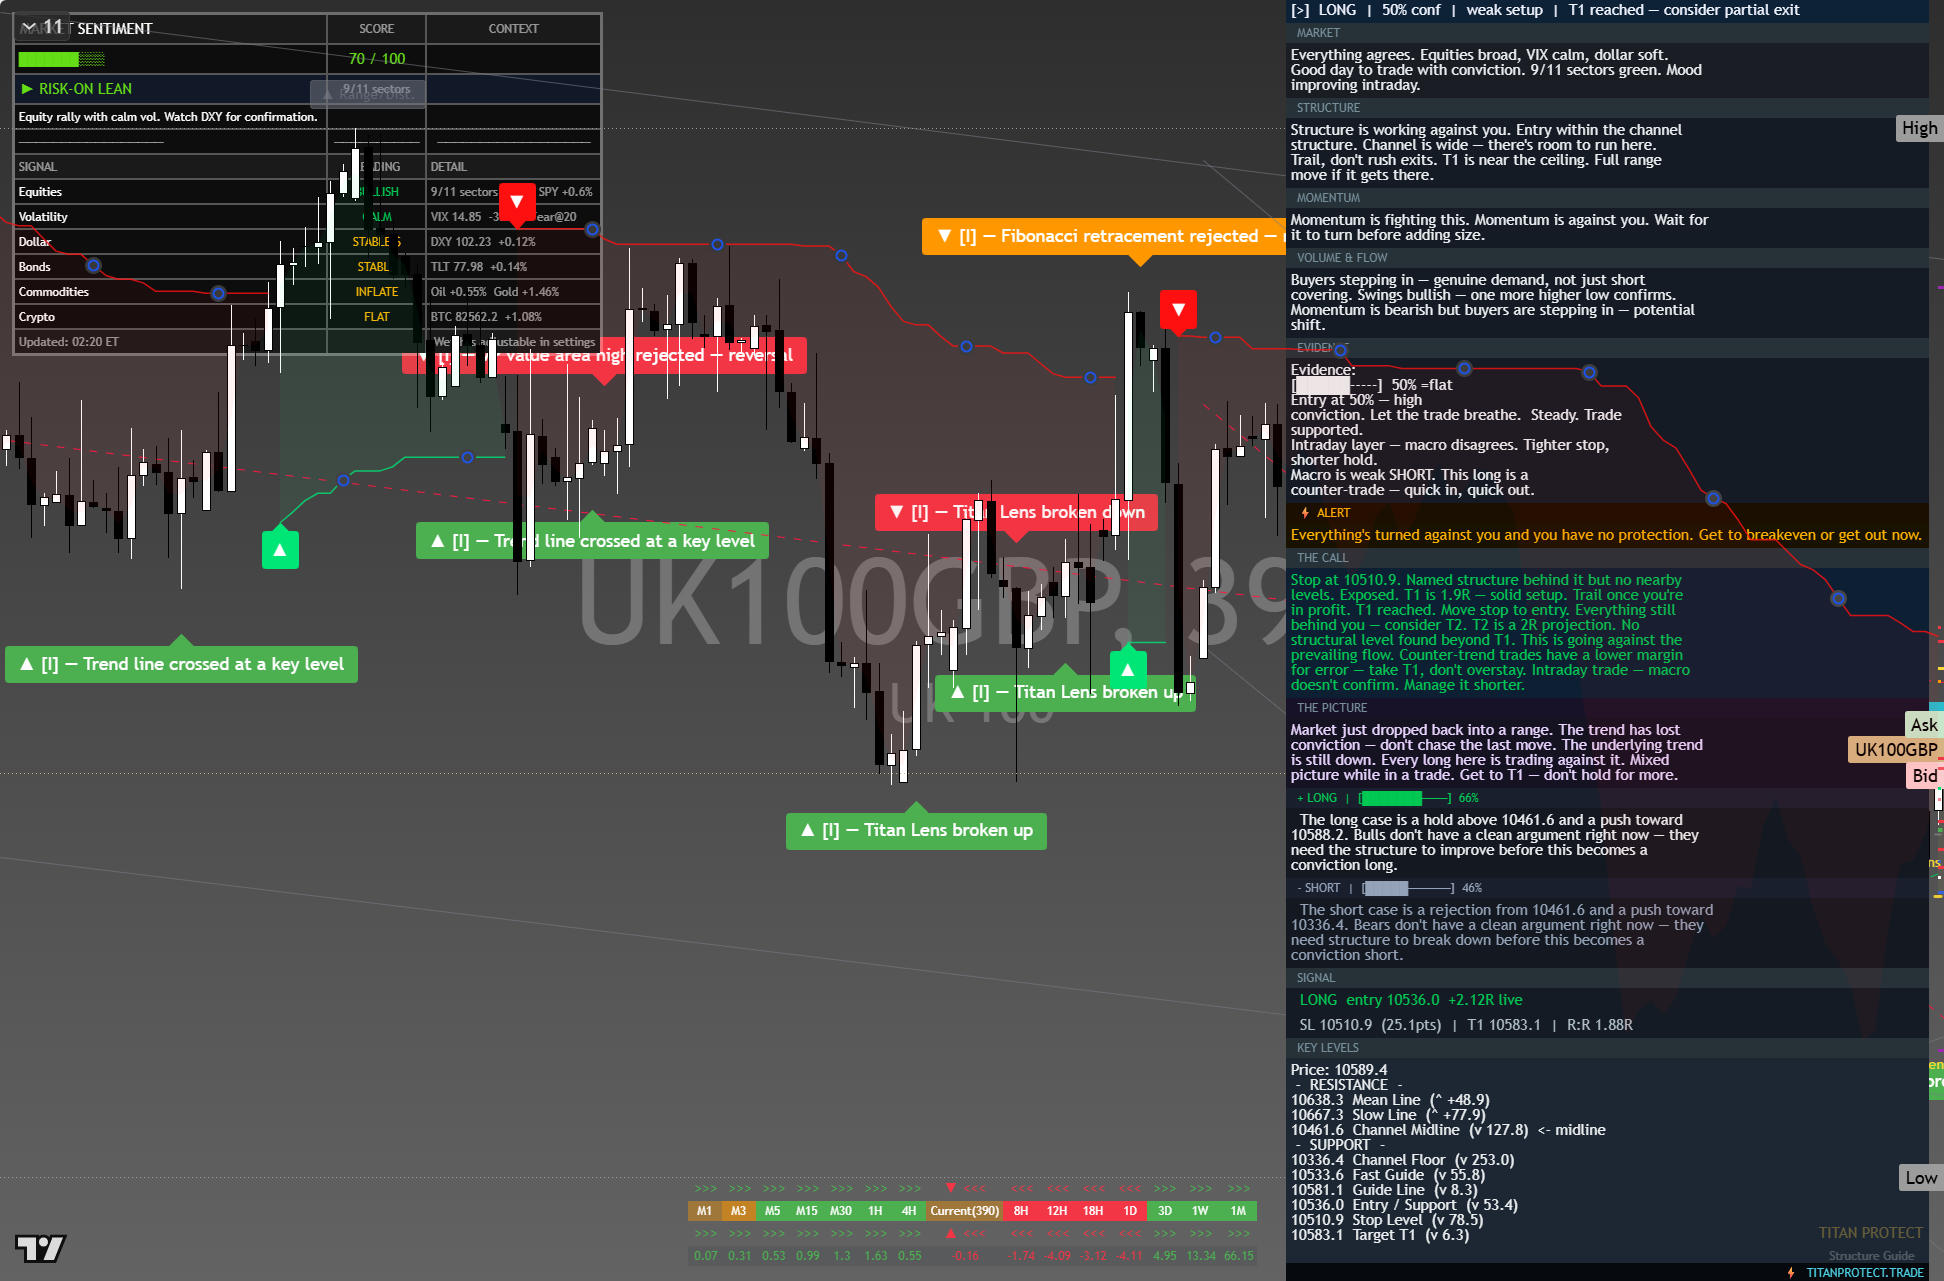
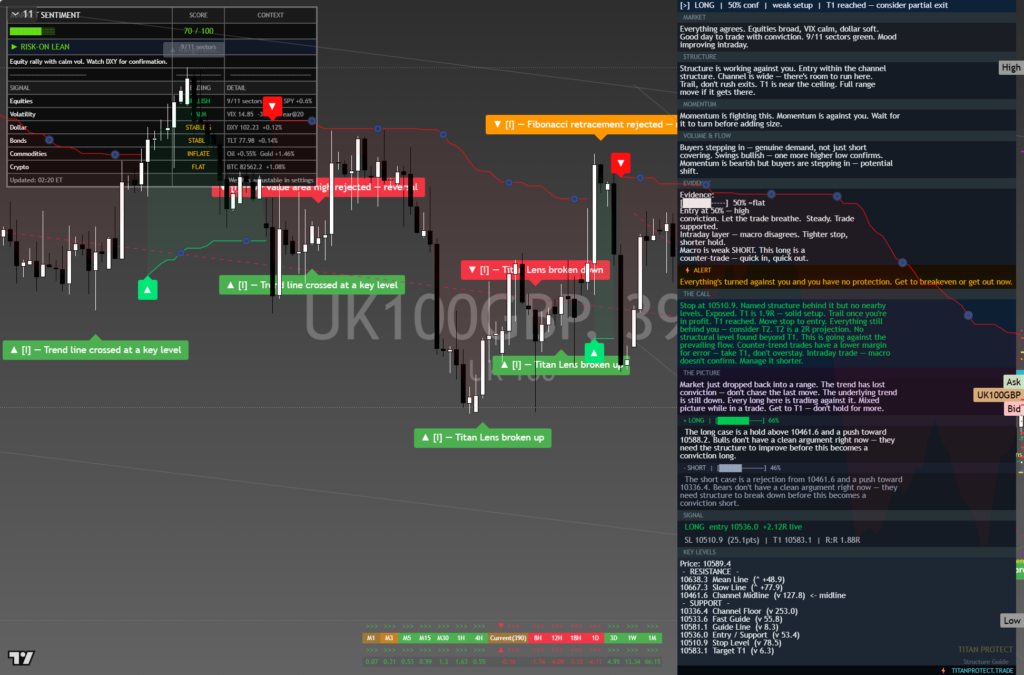
The chart above is the full daily read: structure, momentum, the levels that matter, and where the current price sits against them. Read it top to bottom for the complete picture, and pair it with our session briefs for the wider market context.
This is analysis, not financial advice. It reflects our multi-factor framework and is not a recommendation to buy or sell. Always do your own research and manage your risk.