Copper – Daily Read
27 October 2026 | Commodity | Titan Macro Desk
$6.40
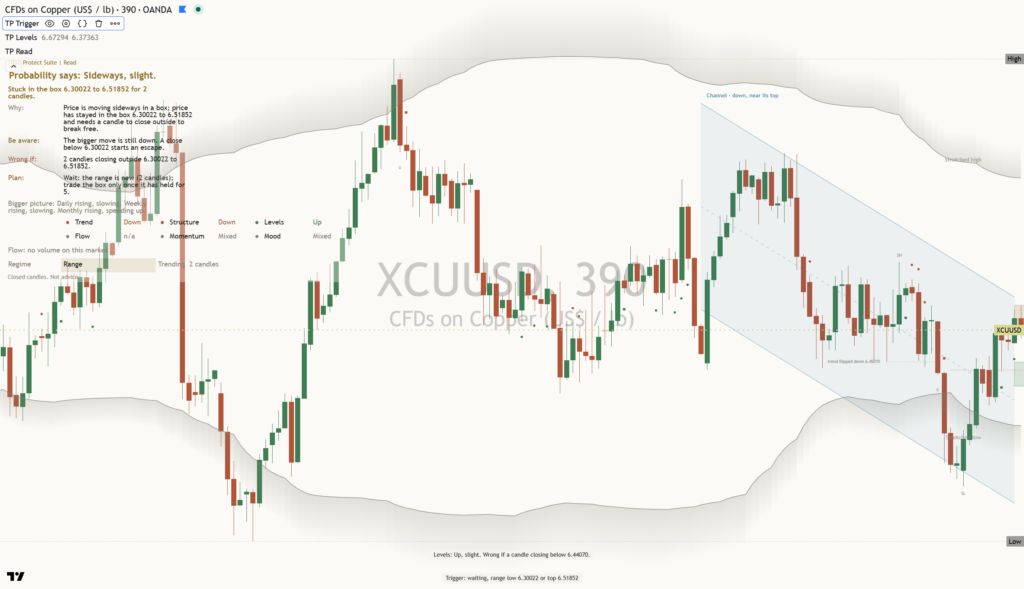
Copper at $6.40 is undergoing a sharp pullback rather than a confirmed trend reversal, with the last session 2.7 percent lower and price down near the floor of its one-month range. That distinction matters because the longer trend still points up, but immediate control has shifted toward the bears. The market is now testing whether underlying demand can absorb pressure at a well-defined support shelf or whether the decline is beginning a deeper reset.
The pressure is visible across recent price action: copper is roughly 2.8 percent down over the last two weeks and sits below its one month average of $6.62. The structure reads as a pullback, slipping under the one-month average while the longer trend still points up, which means the broader advance remains intact but has lost short-term traction. The macro backdrop matters only insofar as uncertainty around global growth and industrial demand is encouraging traders to reduce exposure to economically sensitive commodities.
The immediate contest is around the round number handles at $6.60 and $6.40. The former is resistance because it sits close to the one month average of $6.62, creating a compact area where trapped positioning and renewed supply may emerge. The latter is the current psychological pivot, which means sustained trade below it would keep pressure focused on the shelf of support at $6.38, about 0.3 percent below. That shelf is defended by its proximity to the range floor and by the broader upward structure. Losing it would expose the bottom of the three month range at $5.97 and change the move from a contained retracement into a materially deeper correction.
On the bull path, if $6.38 holds and copper reclaims $6.40, then acceptance above $6.60 and the one month average of $6.62 would show that the pullback has been absorbed. The month swing high at $6.93, about 8.3 percent above the current price, would then become the decisive test because it marks both the top of the three month range of $5.97 to $6.93 and the point where overhead supply has previously halted progress. A decisive move above $6.93 opens the path toward $7.13, which means the longer uptrend would be reasserting itself through fresh range expansion.
On the bear path, if repeated attempts to recover $6.40 fail and resistance between $6.60 and $6.62 remains firm, then pressure should continue toward $6.38. Losing $6.38 exposes $5.97 because there is no provided intermediate shelf strong enough to anchor the read. The principal risk to the bearish case is a rapid recovery through $6.62 followed by sustained strength above $6.93; the principal invalidation of the bullish case is acceptance below $6.38. Net, copper retains a constructive longer-term bias, but at $6.40 the burden is on the bulls to defend support and rebuild control.
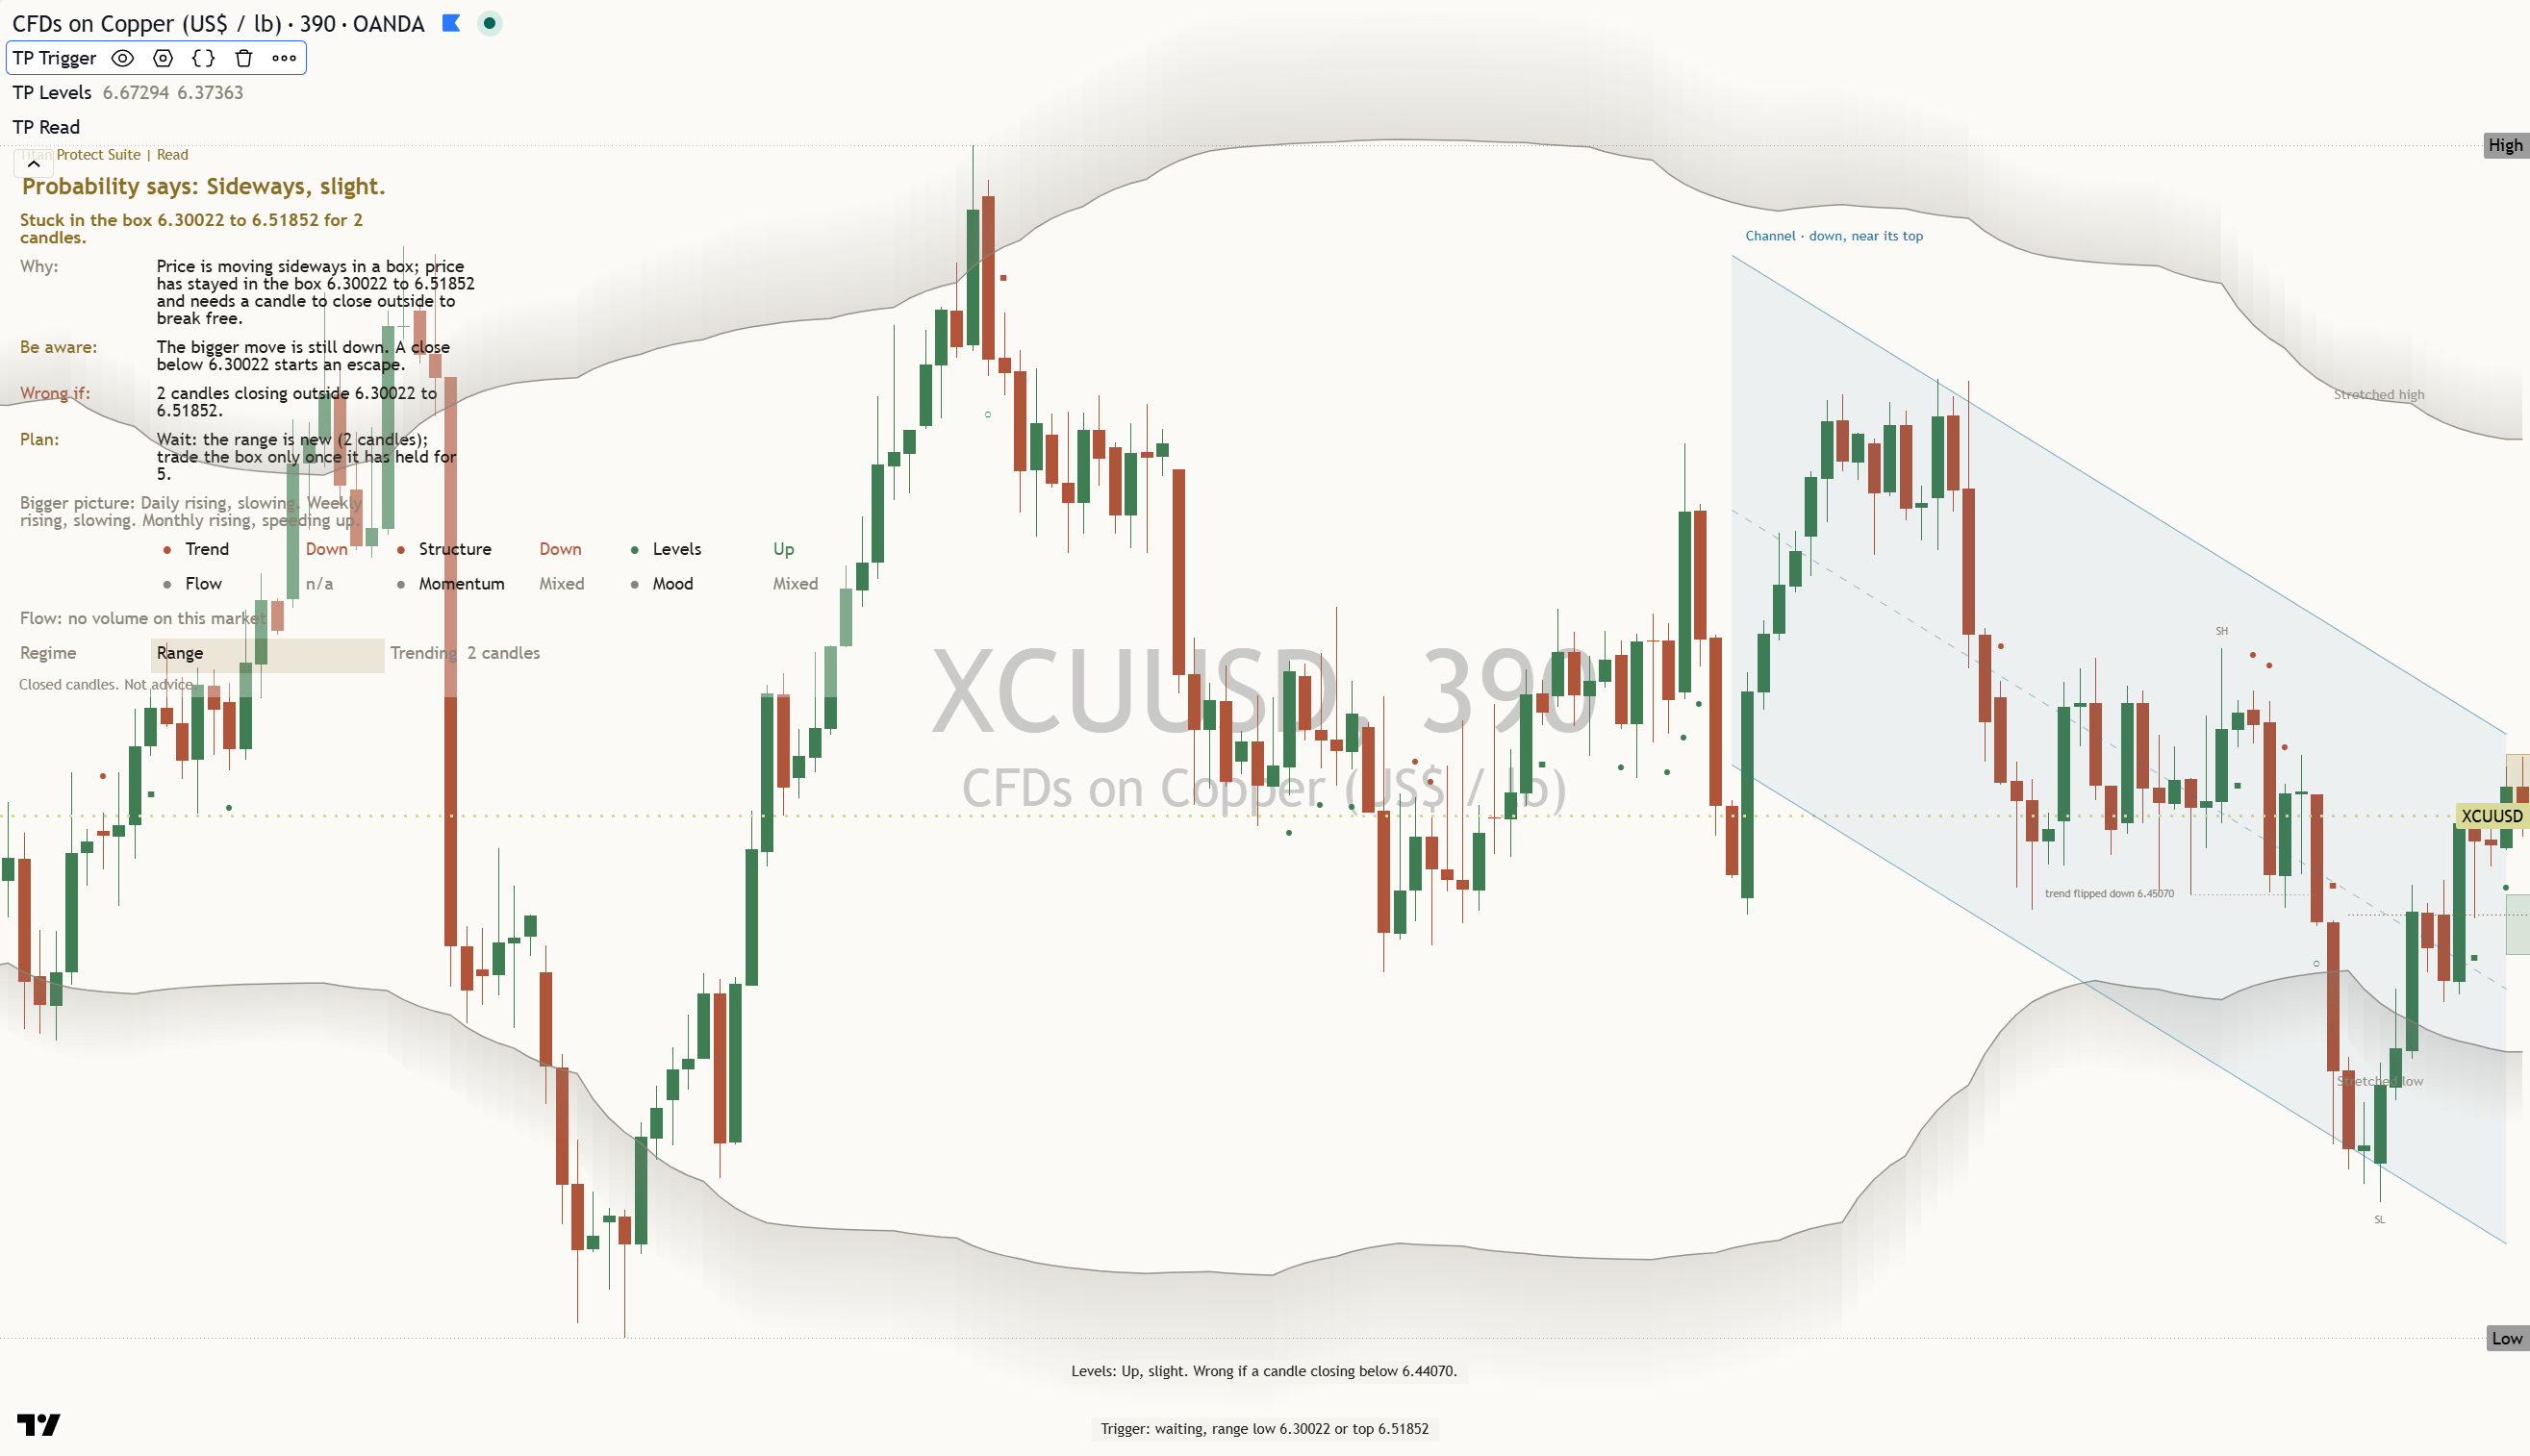
Key levels: support $6.38 (0.3% below), resistance $6.93 (8.3% above), one-month average $6.62, three-month range $5.97 to $6.93.
This is analysis, not financial advice. Always do your own research and manage your risk.