Bitcoin (BTC) – Daily Read
29 October 2026 | Crypto | Titan Macro Desk
$80,313.26
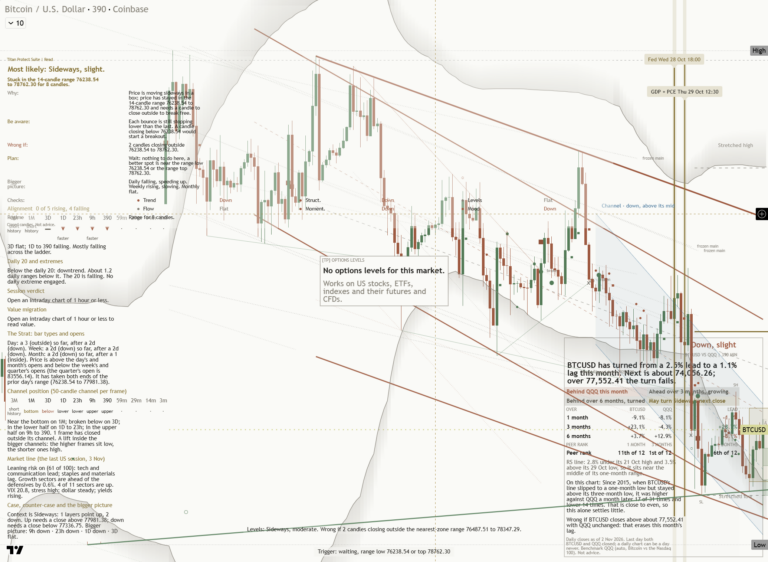
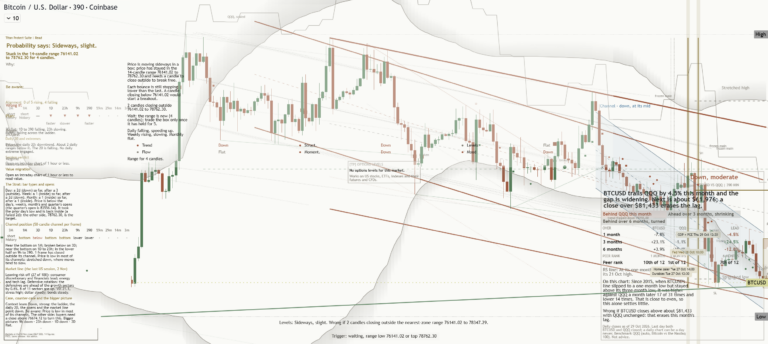
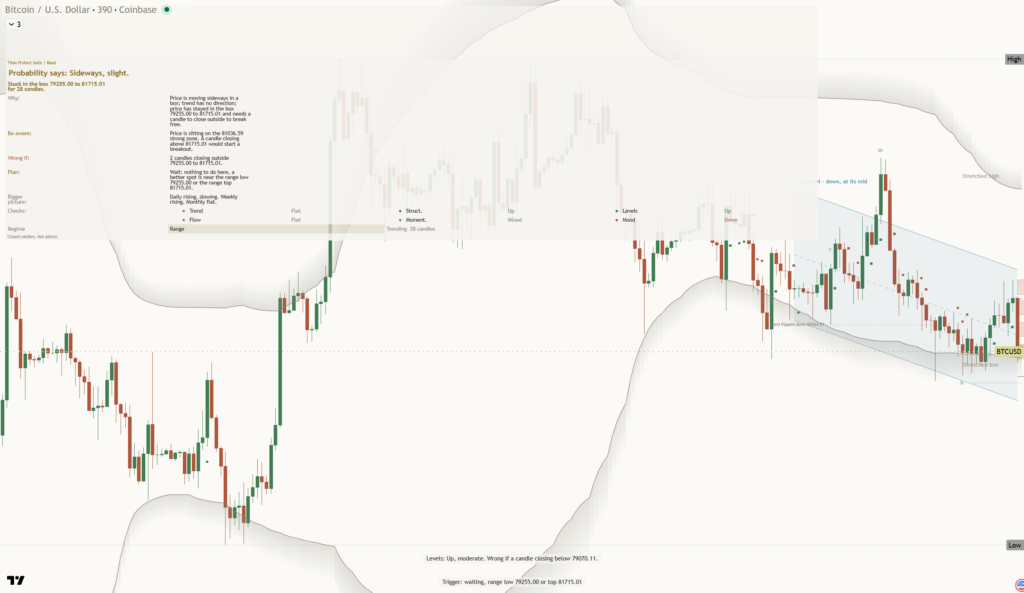
Bitcoin is testing whether a routine pullback is becoming a deeper correction. Last price is $80,313, with the last session 1.1 percent lower, because sellers have pushed it down near the floor of its one-month range. The near-term tape is fragile, but the larger advance is not yet broken, which means the decisive question is whether nearby support absorbs pressure before the retreat damages the longer trend.
The immediate catalyst is persistent crypto-specific de-risking after repeated failure to sustain the upper end of the recent range. Performance is roughly 2.4 percent down over the last two weeks, while the one month average is $82,447 and price is below it, because the structure reads as a pullback, slipping under the one-month average while the longer trend still points up. Broader risk appetite matters mainly through liquidity and positioning, which means Bitcoin needs renewed participation rather than a generic macro narrative to regain control.
The first important handle is $80,000, because it is the nearest round-number reference and a natural battleground for confidence. Just beneath it, a shelf of support at $79,344, about 1.2 percent below, is the more consequential defense because holding there would show that supply is being absorbed near the range floor. Above spot, $82,500 is resistance because reclaiming that handle would also place Bitcoin back around the one-month mean and weaken the pullback narrative. The month swing high at $87,075, about 8.4 percent above the current price, marks the point where recovery becomes renewed expansion rather than repair.
The bull path is straightforward: if $79,344 holds and Bitcoin reclaims $80,000, then acceptance above $82,500 would indicate that near-term pressure has exhausted itself because price would have recovered the central reference area. If that strength extends into a decisive move above $87,075, it opens the path toward $89,575, which means the recent ceiling has given way and the longer upward trend has resumed control. The bear path begins if $80,000 repeatedly rejects recovery attempts and $79,344 fails, because losing $79,344 exposes $62,235 and turns a contained pullback into a materially broader retracement.
The wider map is the three month range of $62,235 to $87,281, which means current weakness is occurring near the upper portion of a still-substantial advance rather than after a complete structural collapse. The bullish read would be invalidated by sustained trade below $79,344 because support would no longer be defending the one-month floor, while the bearish read would be invalidated by firm acceptance above $87,075. Net, Bitcoin remains tactically vulnerable below $82,447, but the larger trend retains credibility while $79,344 holds.
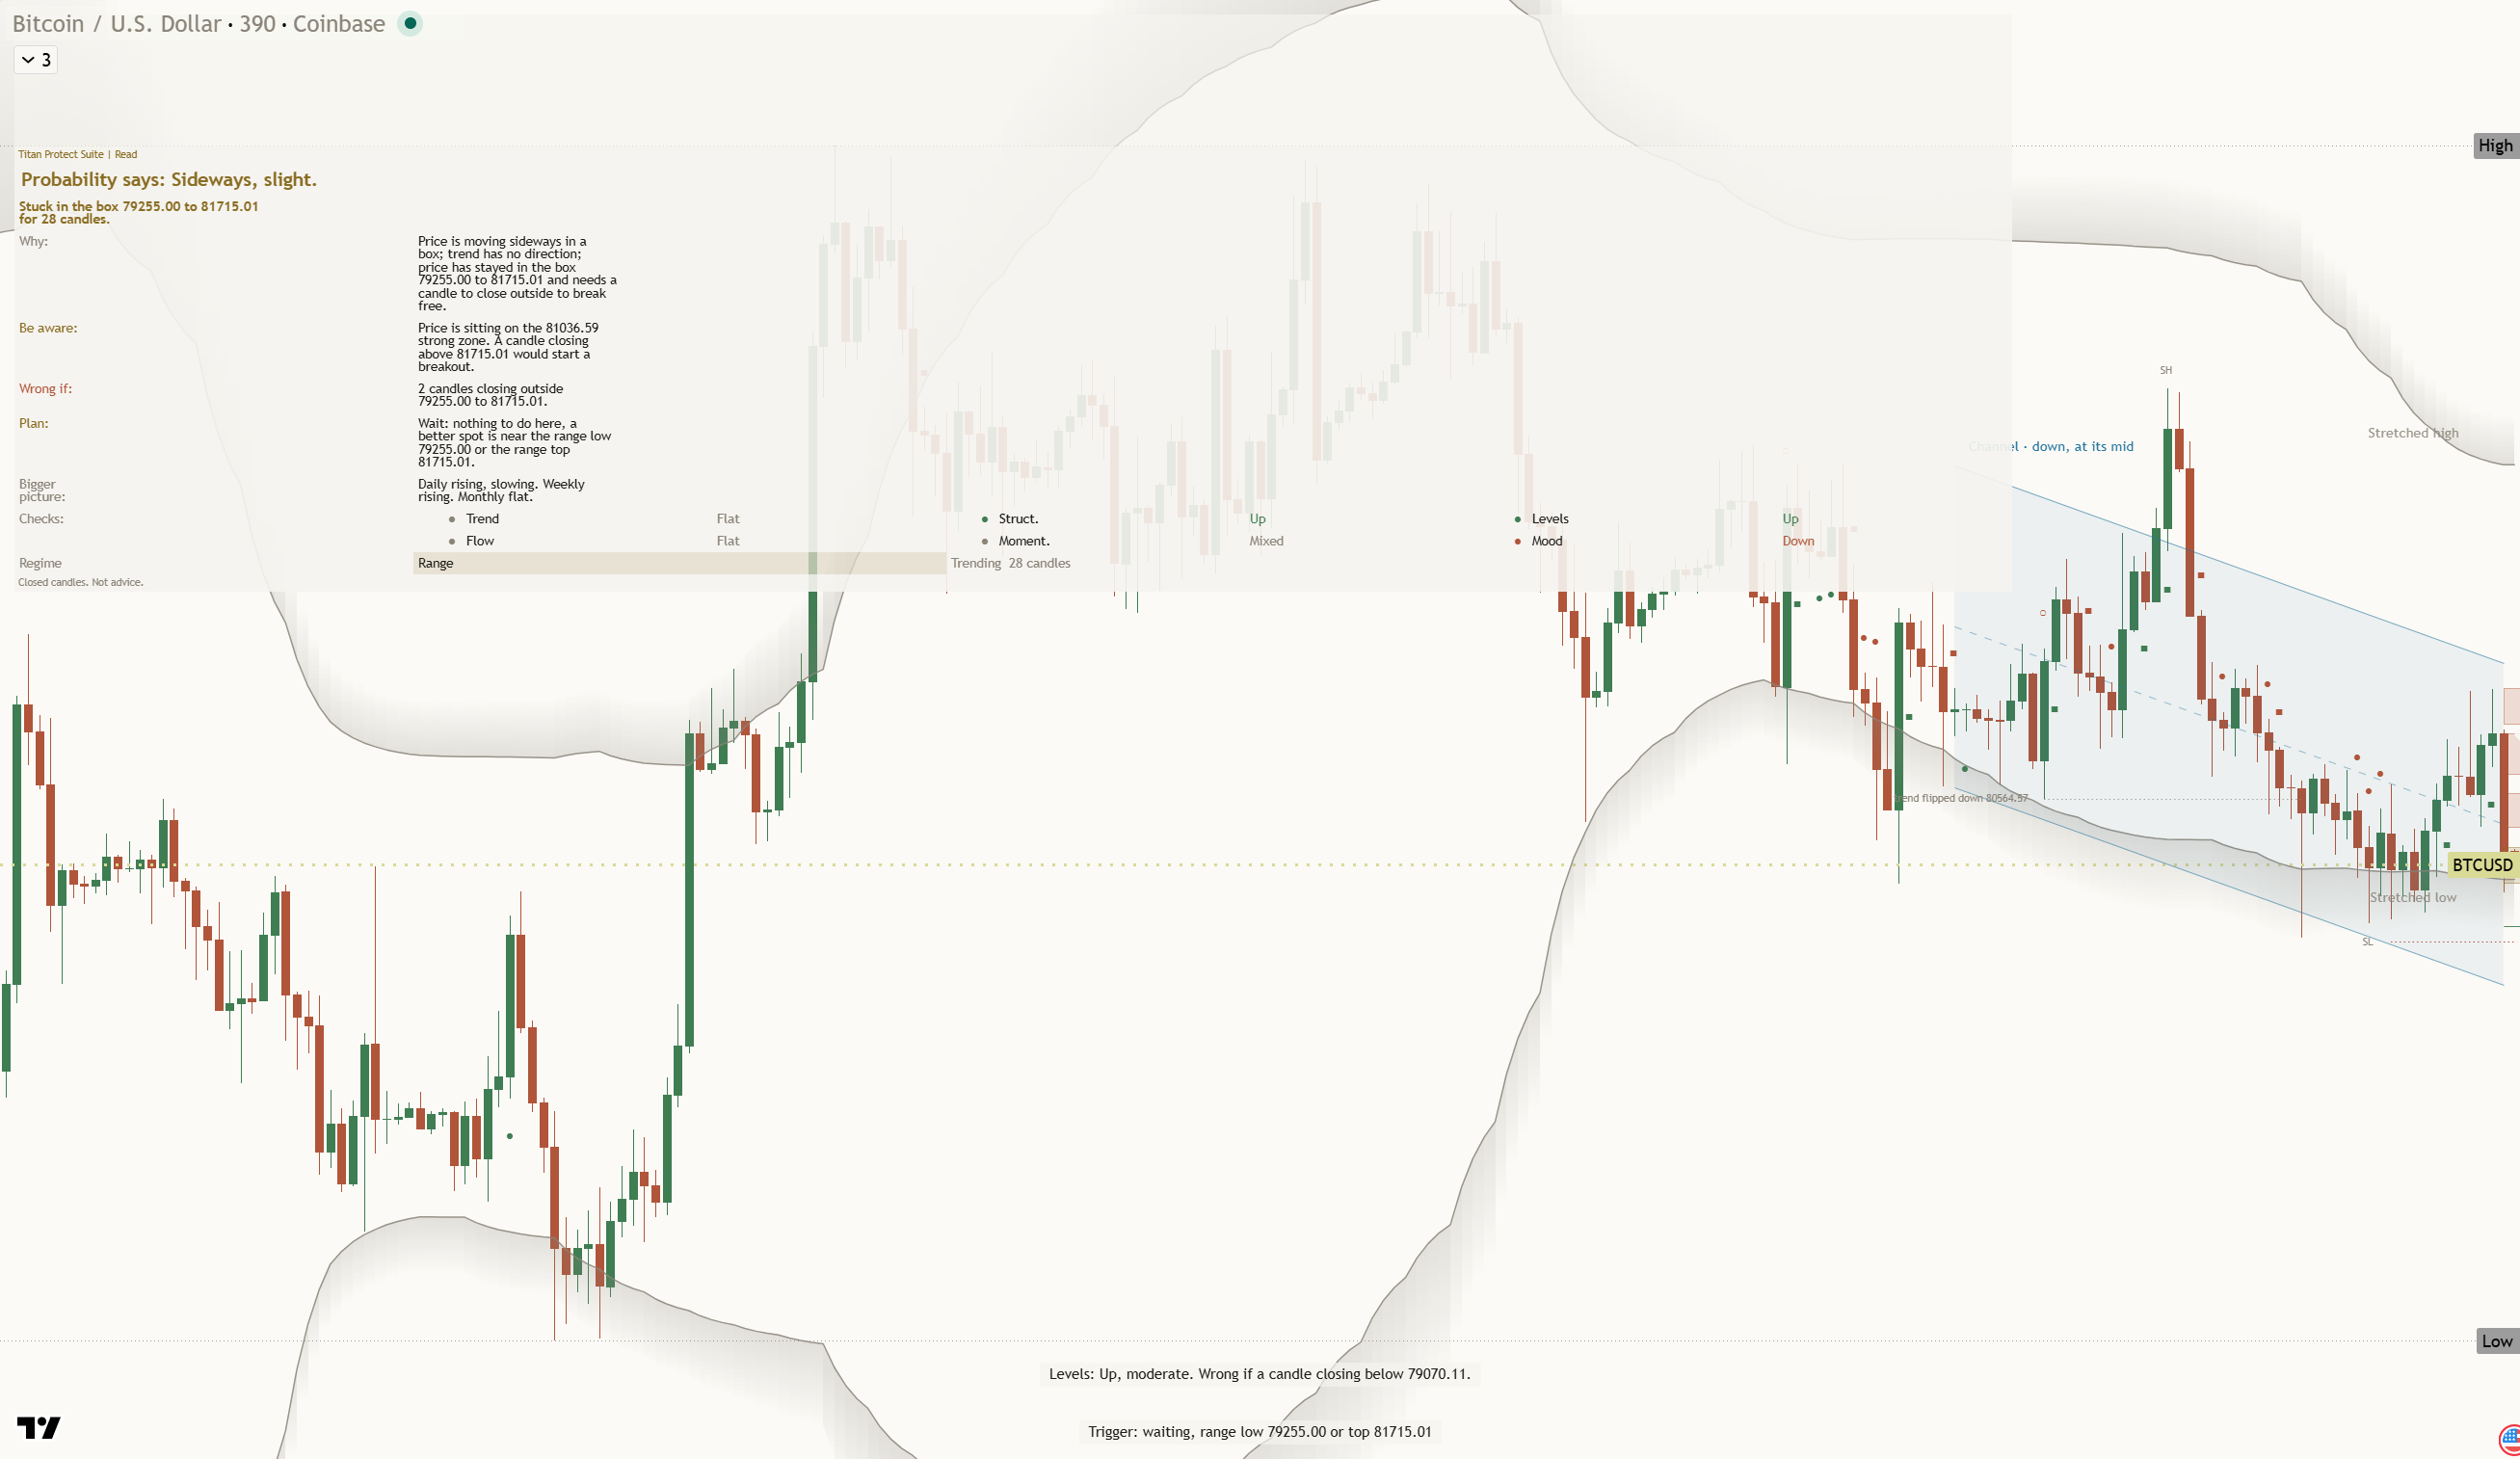
Key levels: support $79,344 (1.2% below), resistance $87,075 (8.4% above), one-month average $82,447, three-month range $62,235 to $87,281.
This is analysis, not financial advice. Always do your own research and manage your risk.