AMD – Daily Read
30 October 2026 | Stock | Titan Macro Desk
$566.42
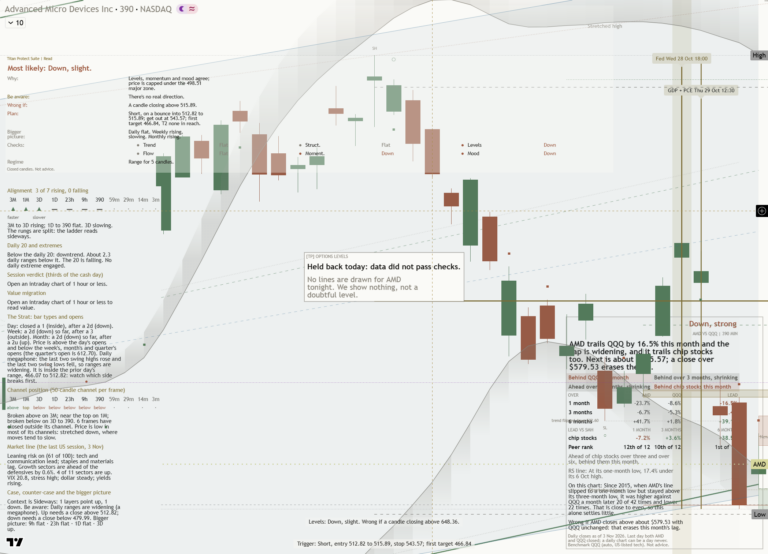
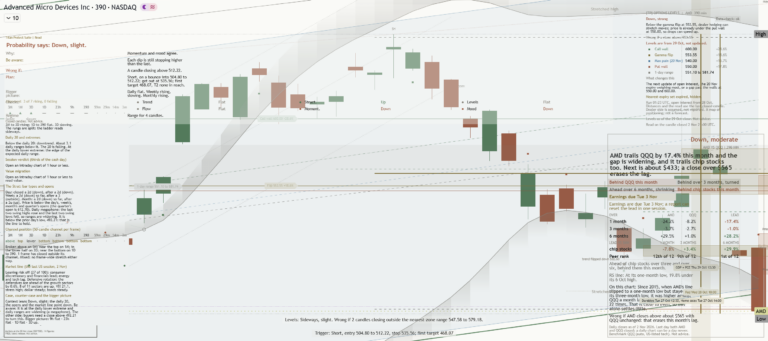
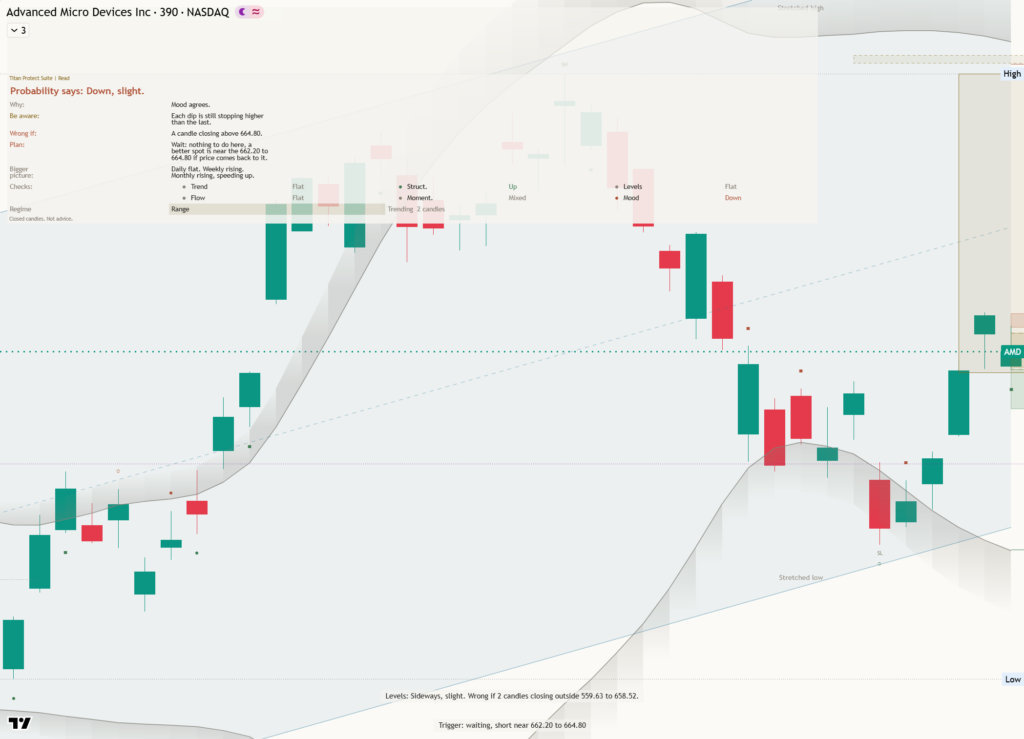
AMD is correcting within an intact longer-term advance, not yet reversing it. The last price is $566.42 after the last session finished 2.1 percent lower, leaving the stock below its one month average of $576.90 and sitting mid-range over the past month. That matters because the structure reads as a pullback, slipping under the one-month average while the longer trend still points up. The clear view is cautiously constructive, but AMD must recover nearby resistance before the market can treat this weakness as fully absorbed.
The broader macro backdrop matters mainly through risk appetite for semiconductor shares, which can amplify moves when expectations around growth and capital spending shift. AMD-specific positioning is currently caught between a strong longer trend and softer near-term demand, because price has lost the one month average even while momentum remains roughly 0.7 percent up over the last two weeks. That modest resilience suggests participation has weakened rather than collapsed, but it does not yet provide enough force to challenge the month swing high at $658.52, about 16.3 percent above the current price.
The immediate contest is around the nearer round number handles at $570.00 and $560.00. The upper handle matters because reclaiming and holding it would place AMD back above the current price zone and begin repairing the break beneath the one month average. The lower handle is the first line of defense because sustained trade beneath it would show that weakness is extending rather than stabilizing. Below there, a shelf of support at $502.60, about 11.3 percent below, is the more important structural boundary. It is defended by its position inside the three month range of $424.03 to $658.52, where prior demand can plausibly reappear. The upper end is major resistance because clearing the range high would confirm that the broader advance has resumed.
The bull path is straightforward: if AMD regains $570.00, then recovers $576.90 and holds above it, the pullback begins to look complete because price would have repaired both nearby resistance and the lost average. If strength then carries through $658.52 decisively, it opens the path toward $668.52, which means the market has accepted prices beyond the recent range. The bear path begins if $560.00 fails and cannot be recovered. If pressure then reaches and breaks $502.60, losing that shelf exposes $424.03 because the range would no longer contain a meaningful support layer before its lower boundary.
The principal risk to the constructive view is persistent weakness below $560.00, especially if attempted recoveries stall beneath $576.90. The read is invalidated by a decisive loss of $502.60 because that would turn an orderly pullback into a material structural deterioration. Conversely, bearish pressure loses credibility if AMD establishes itself above $658.52. Net, the longer trend still deserves respect, but the stock remains in repair mode until nearby resistance is reclaimed and defended.
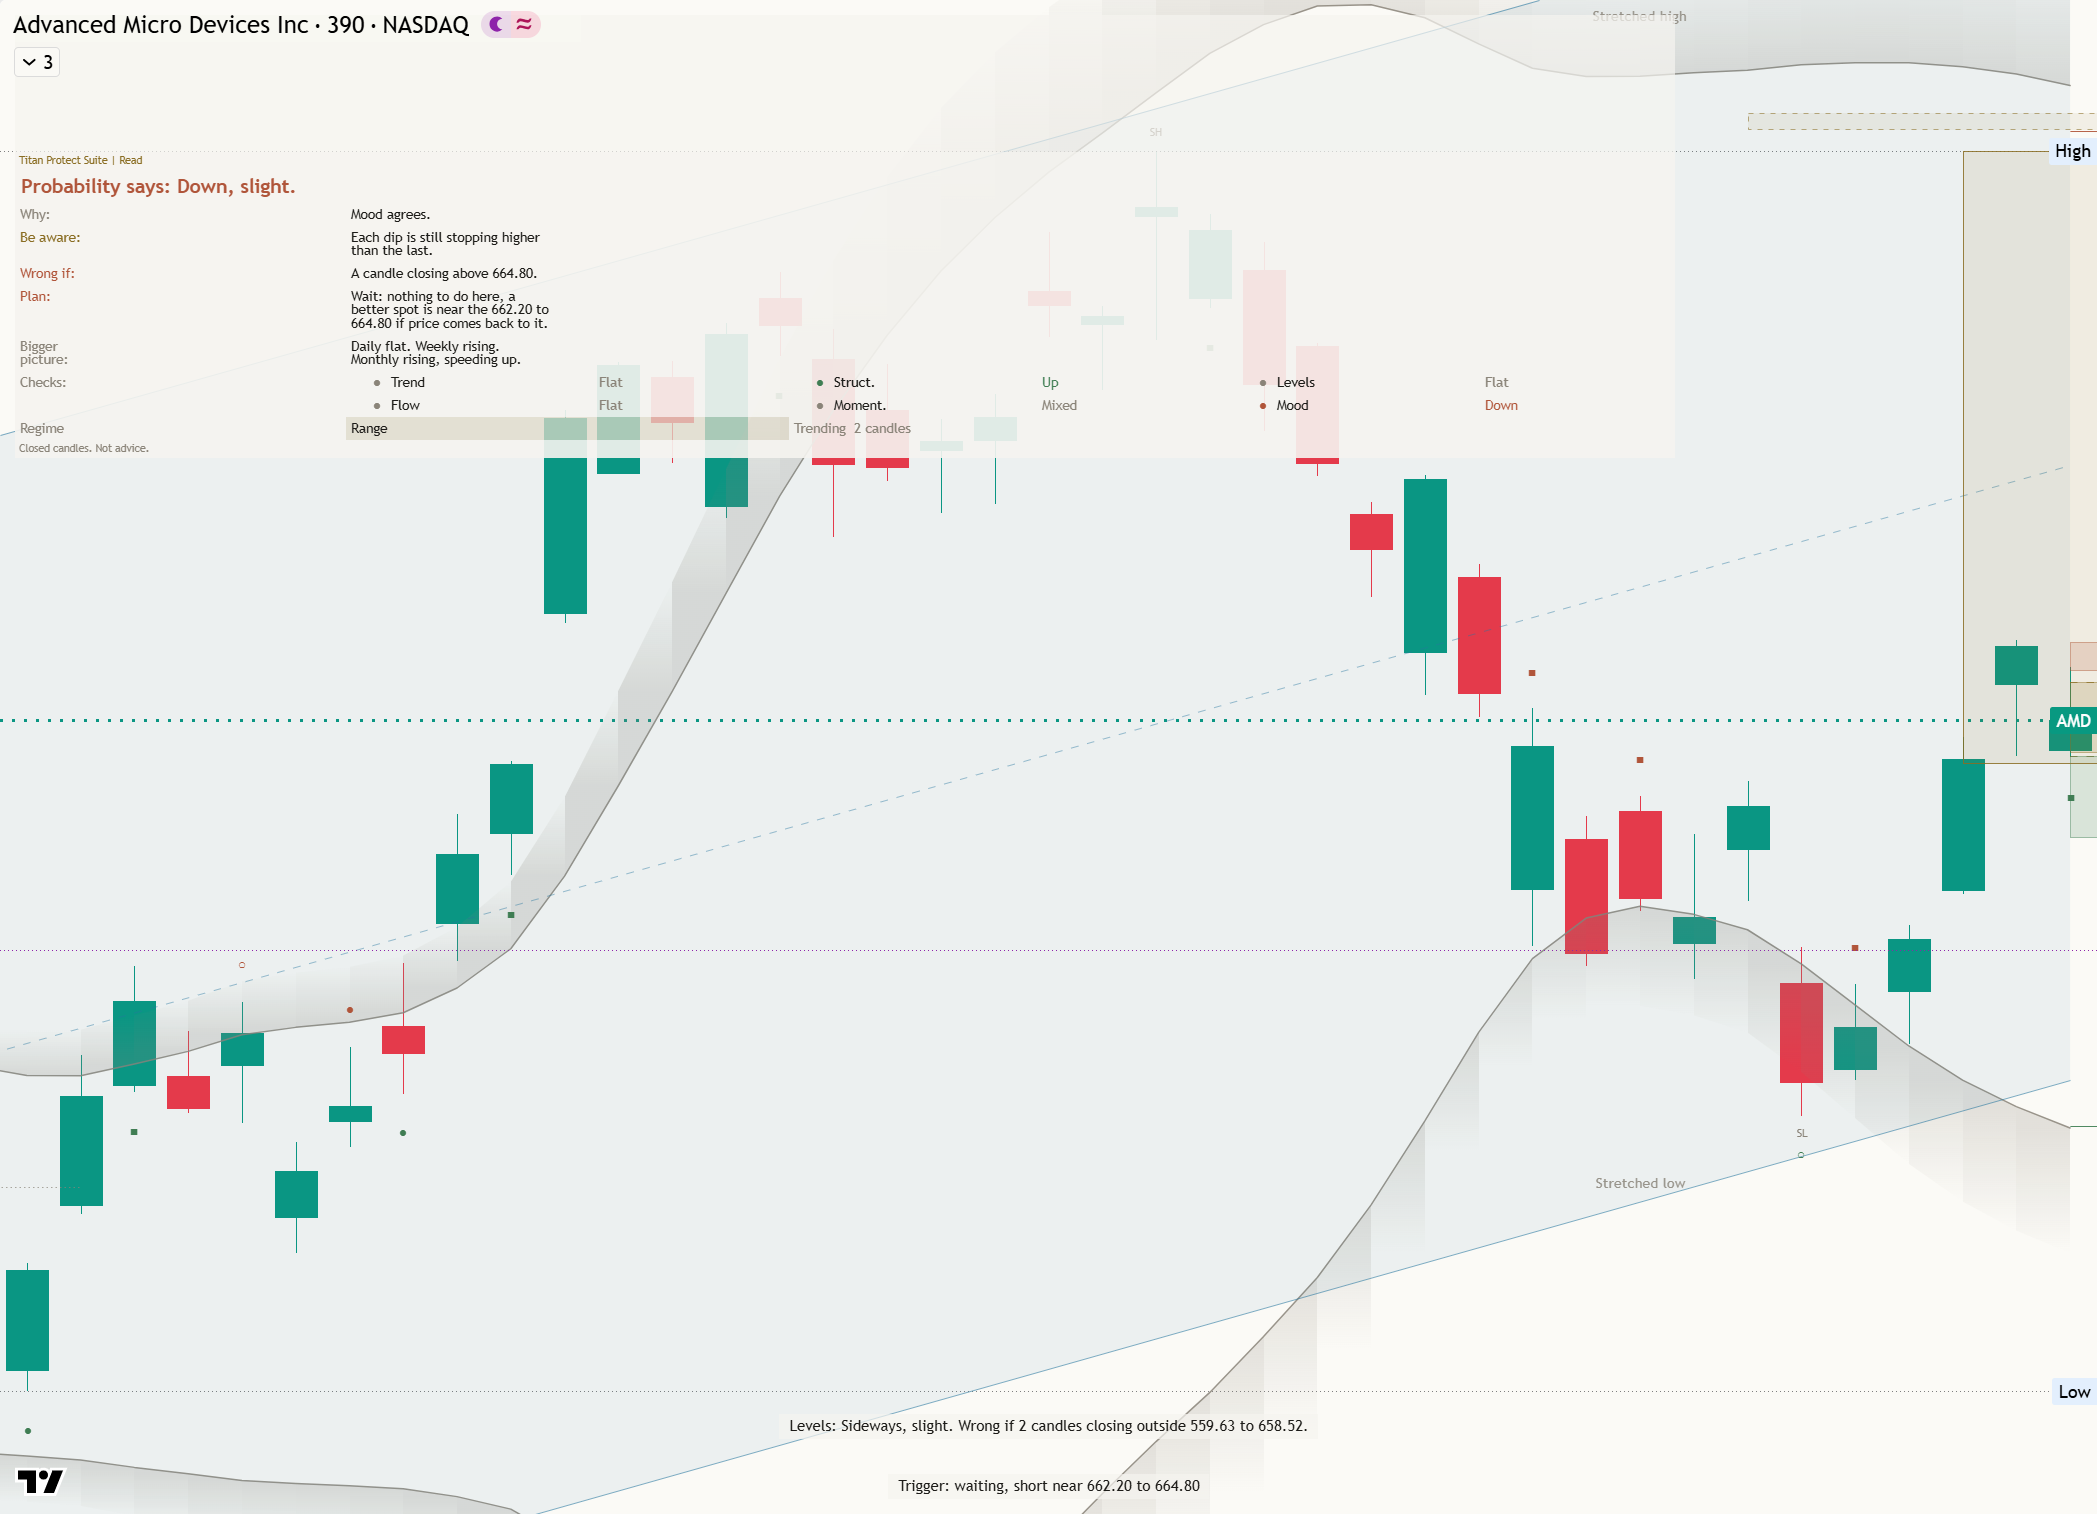
Key levels: support $502.60 (11.3% below), resistance $658.52 (16.3% above), one-month average $576.90, three-month range $424.03 to $658.52.
This is analysis, not financial advice. Always do your own research and manage your risk.