Amazon (AMZN) – Daily Read
7 October 2026 | Stock | Titan Macro Desk
$256.29
Amazon is trying to turn stabilization into a durable recovery. The last price is $256.29, 1.9 percent higher on the day, and it is holding in the upper half of its one-month range. That matters because buyers are no longer merely defending weakness. They are pressing the stock toward the top of its recent range. The constructive view is that Amazon can extend higher, but confirmation still requires the market to absorb supply clustered around the nearby highs.
The macro backdrop remains important because large growth stocks are sensitive to changing expectations for demand, corporate spending, consumer resilience, and the cost of capital. Amazon also carries its own mix of retail, cloud, advertising, and margin expectations, so the stock needs both a supportive broader tape and confidence in company execution. The one month average is $251.26; price is above it, and the structure reads as a recovery attempt, back above the one-month average but still under the longer one. Momentum is roughly 0.5 percent up over the last two weeks. That is positive, though still measured rather than forceful.
The nearer round number handles at $260.00 and $255.00 define the immediate contest. Holding $255.00 would show that buyers are willing to defend strength instead of waiting for a deeper pullback. Reclaiming and sustaining trade above $260.00 would place pressure directly on the month swing high at $261.12, about 1.9 percent above the current price. That high matters because it is the clearest recent boundary between recovery and breakout. A shelf of support sits at $244.30, about 4.7 percent below. It is the more important defensive line because losing it would damage the pattern of improving price acceptance. The three month range is $226.12 to $287.16, which frames both the upside opportunity and the downside consequence.
The bull path is straightforward: if Amazon holds $255.00, establishes acceptance above $260.00, and then delivers a decisive move above $261.12, the recovery becomes a breakout and opens the path toward $287.16. That sequence would suggest that overhead supply has been absorbed and that buyers are prepared to pursue the upper boundary of the broader range. The bear path begins if $255.00 fails and the stock cannot quickly regain the one month average at $251.26. If selling then pushes through $244.30, the recovery thesis loses its foundation, and losing $244.30 exposes $226.12.
The main risk is a broader retreat in growth stocks or a company-specific reassessment of demand, spending, or profitability that overwhelms the improving structure. The bullish read would be invalidated by sustained trade below $244.30, while the bearish case would be invalidated by firm acceptance above $261.12. Net, Amazon has a constructive near-term bias, but it remains a recovery attempt until buyers prove they can clear the recent high and hold the breakout.
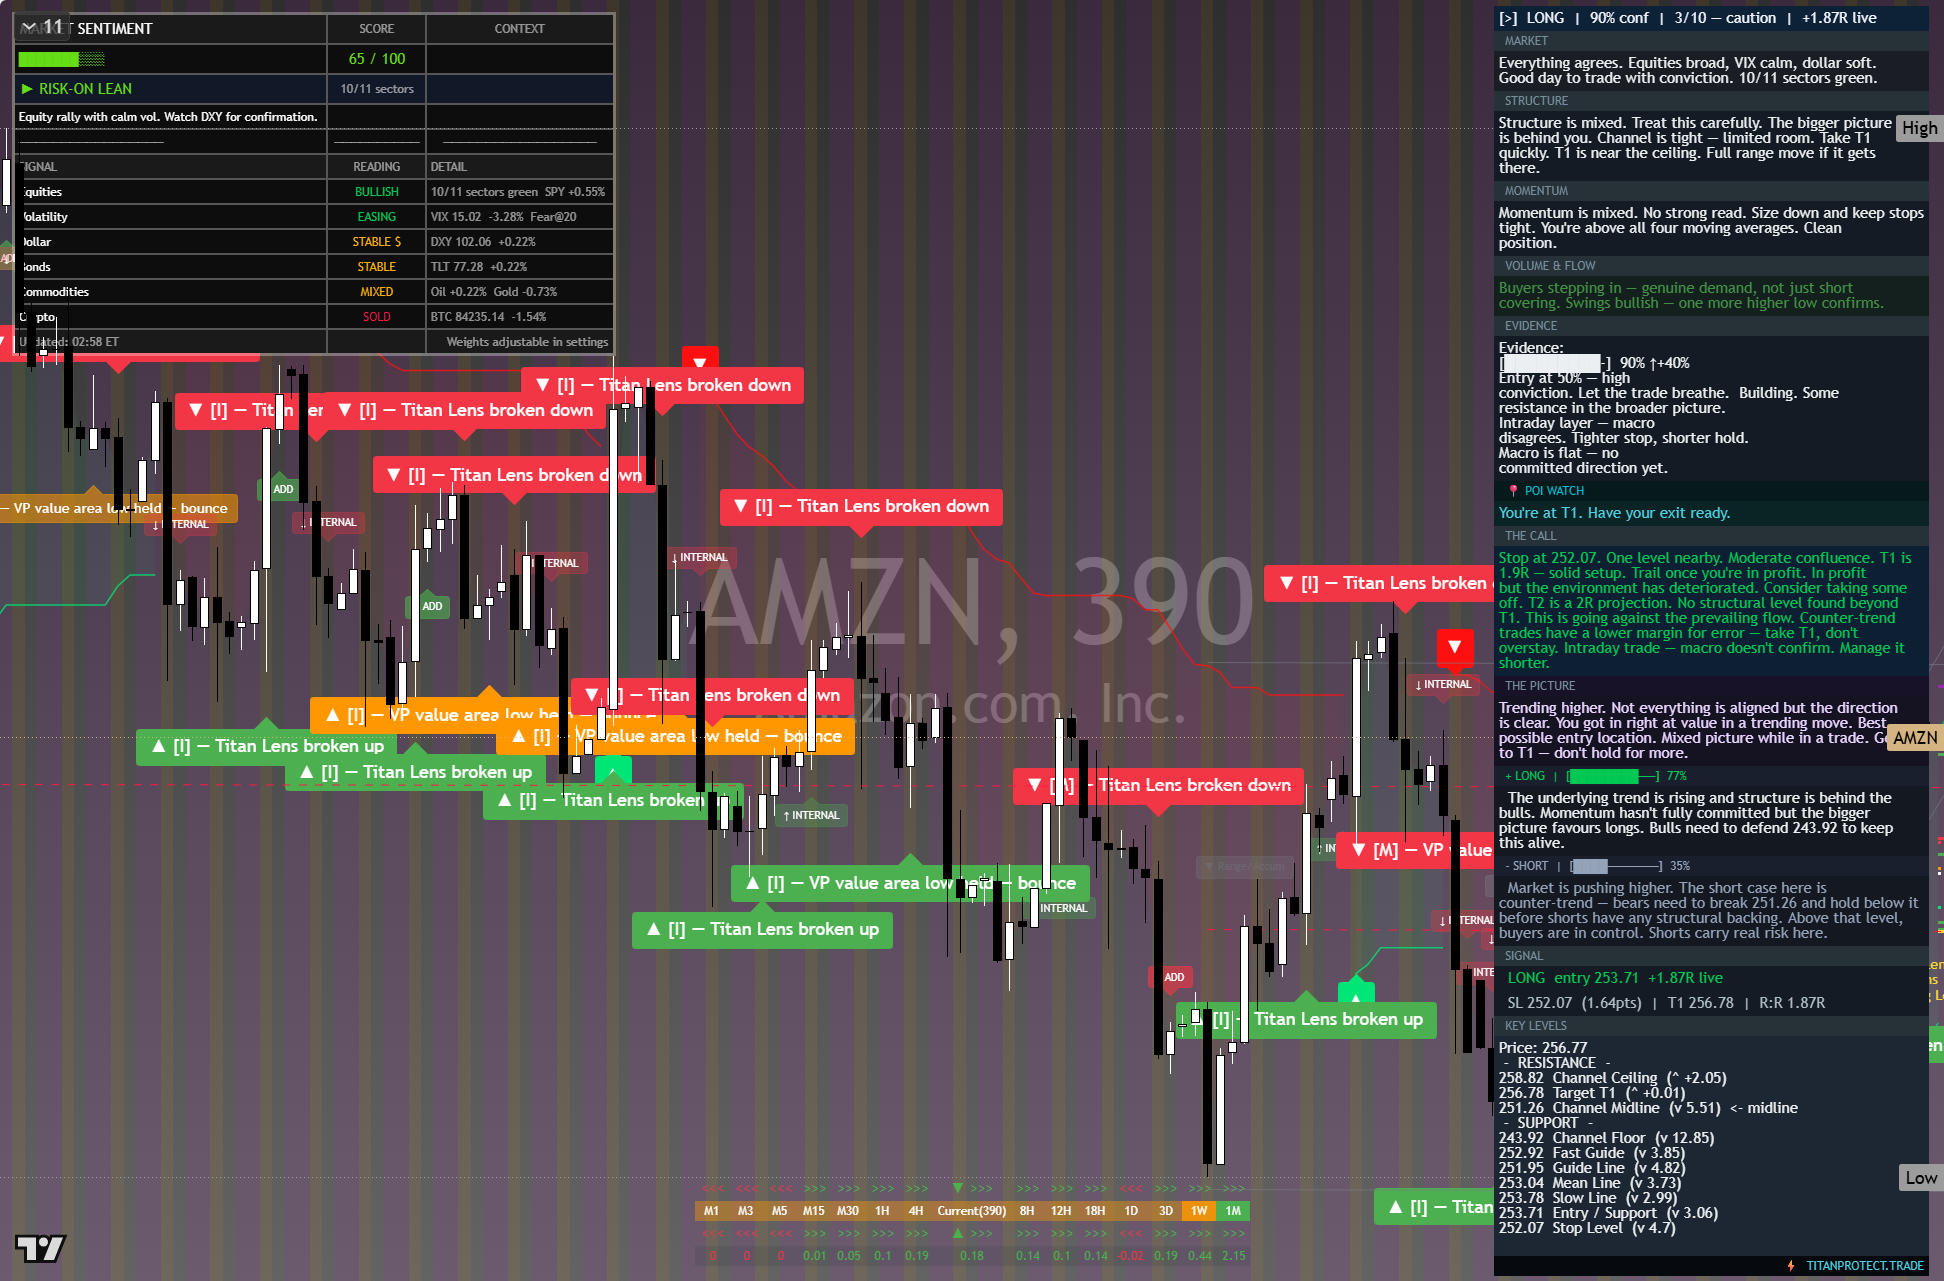
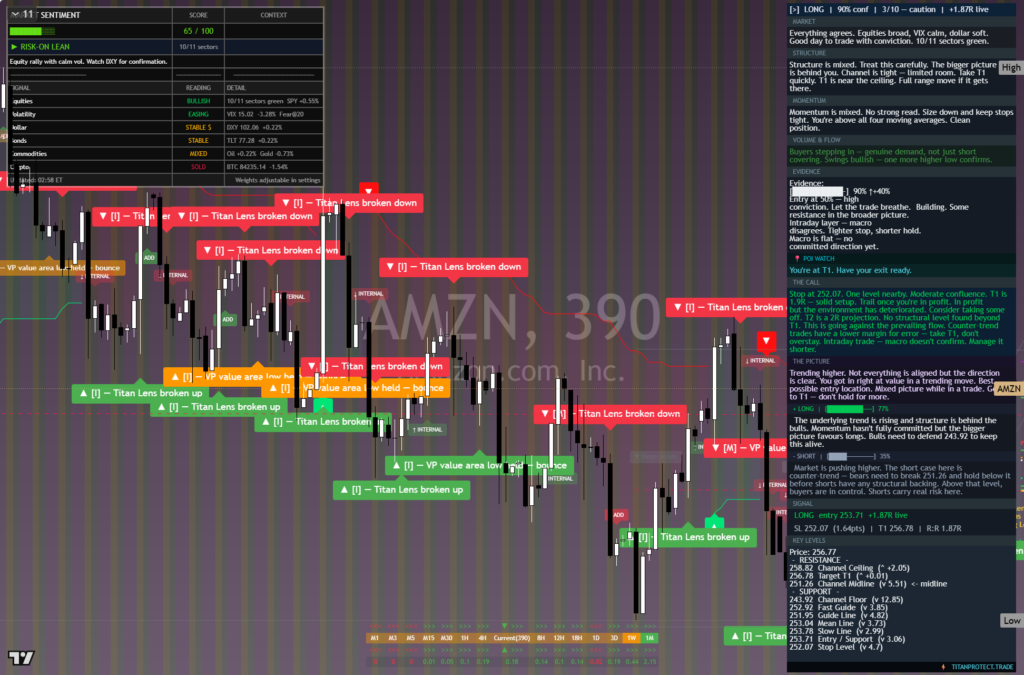
The chart above is the full daily read: structure, momentum, the levels that matter, and where the current price sits against them. Read it top to bottom for the complete picture, and pair it with our session briefs for the wider market context.
This is analysis, not financial advice. It reflects our multi-factor framework and is not a recommendation to buy or sell. Always do your own research and manage your risk.