AMD – Daily Read
7 October 2026 | Stock | Titan Macro Desk
$649.42
AMD is trading like a leadership stock, with buyers pressing an established advance rather than merely covering weakness. Last price $649.42, 2.8 percent higher on the day. It is pressing the top of its one-month range, so the immediate question is whether demand can convert strength into a durable breakout. The view remains constructive while price holds the nearby handles, but the proximity of major resistance makes confirmation more important than chasing the latest move.
The macro backdrop matters because AMD sits at the intersection of growth equity sentiment, semiconductor demand, artificial intelligence investment, and expectations for corporate technology spending. When investors are comfortable owning long-duration growth and believe data-center expenditure will remain resilient, the stock can command an expanding premium. When rates, risk appetite, or spending expectations deteriorate, that same premium can unwind quickly. Company-specific enthusiasm is being reinforced by price behavior: the one month average is $584.70; price is above it, and the structure reads as a clean uptrend, price above both its one-month and longer averages. The stock is roughly 4.1 percent up over the last two weeks, showing that the advance has persistence rather than depending solely on the latest session.
The first decision area is the nearer round number handles at $650.00 and $640.00. Holding around $650.00 would show that buyers can accept elevated prices and keep pressure on the range ceiling. If that handle cannot be retained, $640.00 becomes the nearer defense, where buyers need to prove that a pullback is consolidation rather than rejection. The month swing high is $658.52, about 1.4 percent above the current price, making it the defining resistance. The three month range is $424.03 to $658.52, so clearing its upper boundary would carry more meaning than an ordinary intraday push. Far below, a shelf of support at $458.00, about 29.5 percent below, marks the structural line separating a deep correction from a broader breakdown.
The bull path is clear: if AMD holds $650.00, absorbs selling near the range high, and delivers a decisive move above $658.52, then that breakout opens the path toward $660.00. Acceptance there would confirm that prior resistance has been overcome and keep the trend pointed higher. The bear path begins if price fails around the high and then loses $640.00. That would signal fading breakout demand and raise the risk of a deeper retracement toward the average zone. If weakness ultimately reaches and loses $458.00, then the bullish structure is invalidated and $424.03 is exposed.
The principal risk is false acceptance above resistance, especially if the wider semiconductor group or growth market loses sponsorship. A brief move through the high followed by a retreat below the nearby handles would undermine the breakout case. Net, AMD remains bullish in structure, but it is at a location where execution matters: strength above $658.52 confirms continuation, while failure to defend $650.00 and $640.00 shifts the desk from pressing upside to protecting against mean reversion.
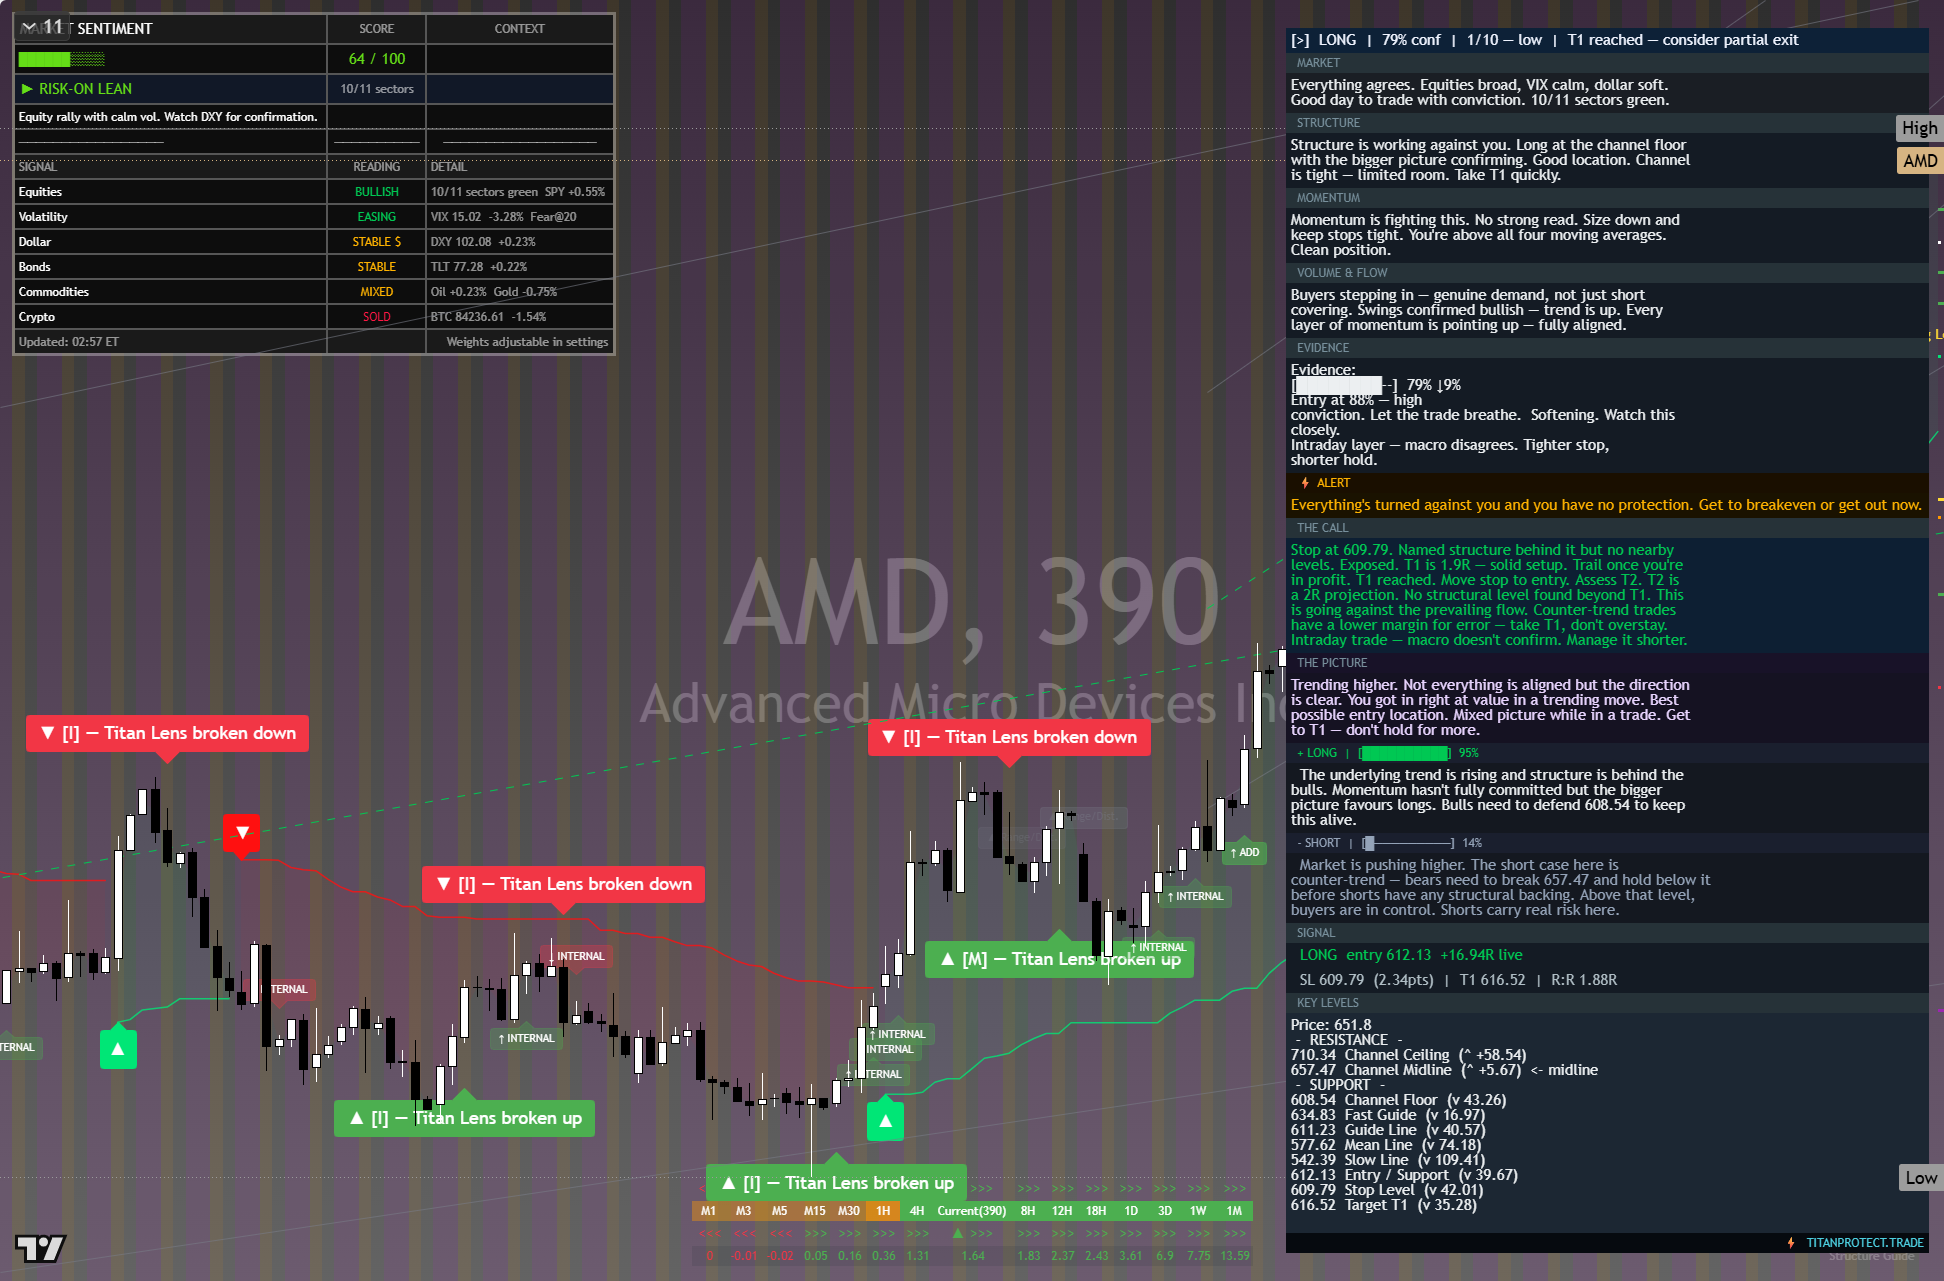
The chart above is the full daily read: structure, momentum, the levels that matter, and where the current price sits against them. Read it top to bottom for the complete picture, and pair it with our session briefs for the wider market context.
This is analysis, not financial advice. It reflects our multi-factor framework and is not a recommendation to buy or sell. Always do your own research and manage your risk.