STOXX 600 (SXXP) – Daily Read
29 October 2026 | Index | Titan Macro Desk
644.1
As of 29 October 2026, the STOXX 600 is pressing the top of its one-month range at 644.1 after finishing the last session 0.1 percent higher. The clear view is cautiously constructive because price is holding near the upper boundary rather than retreating sharply from it. That matters for SXXP because this is the broad index of 600 European companies, not the Euro Stoxx 50, so strength here reflects wide participation across European sectors and markets. The recovery is credible, but it has not yet become a clean breakout.
The immediate context is improving price persistence. SXXP is above its one month average of 637.1, which means the structure reads as a recovery attempt, back above the one-month average but still under the longer one. It is roughly 1.0 percent up over the last two weeks, enough to show advancing pressure without suggesting an exhausted move. The asset-class message is that broad European equities are rebuilding confidence, but confirmation remains important because the index is approaching overhead supply rather than advancing through open space.
The first test is the month swing high at 645.6, about 0.2 percent above the current price. That level matters because it marks where the recent advance previously stopped, so a decisive move above 645.6 would show that available supply has been absorbed. The nearer round number handles at 650.0 and 640.0 provide the practical battleground: 640.0 should act as initial support because holding it keeps price close to the range ceiling, while 650.0 is the next resistance where hesitation could emerge. The broader three month range is 622.9 to 663.4, which means the index is already trading in its upper half but still has unfinished work before challenging the full range high.
The bull path is straightforward: if SXXP clears 645.6 decisively and then holds above 650.0, the path opens toward 663.4 because the prior one-month ceiling would have changed from resistance into support and the upper boundary of the three month range would become the natural next test. The bear path begins if price slips beneath 640.0 and cannot recover it, which means the current pressure at the top of the one-month range has failed. A deeper retreat would then focus attention on the shelf of support at 622.9, about 3.3 percent below, where the three month floor should attract the strongest defence.
The principal risk is a false break above 645.6 that quickly returns below 640.0, because that would reveal insufficient follow-through and weaken the recovery case. The read is fully invalidated if 622.9 is lost on a decisive basis, which means the three month range floor has failed and exposes 612.9. Until either boundary gives way, the net take is constructive but disciplined: broad European participation, a position above 637.1, and sustained two-week progress favour an eventual upside resolution, while 645.6 remains the proof point and 622.9 remains the line that preserves the recovery.
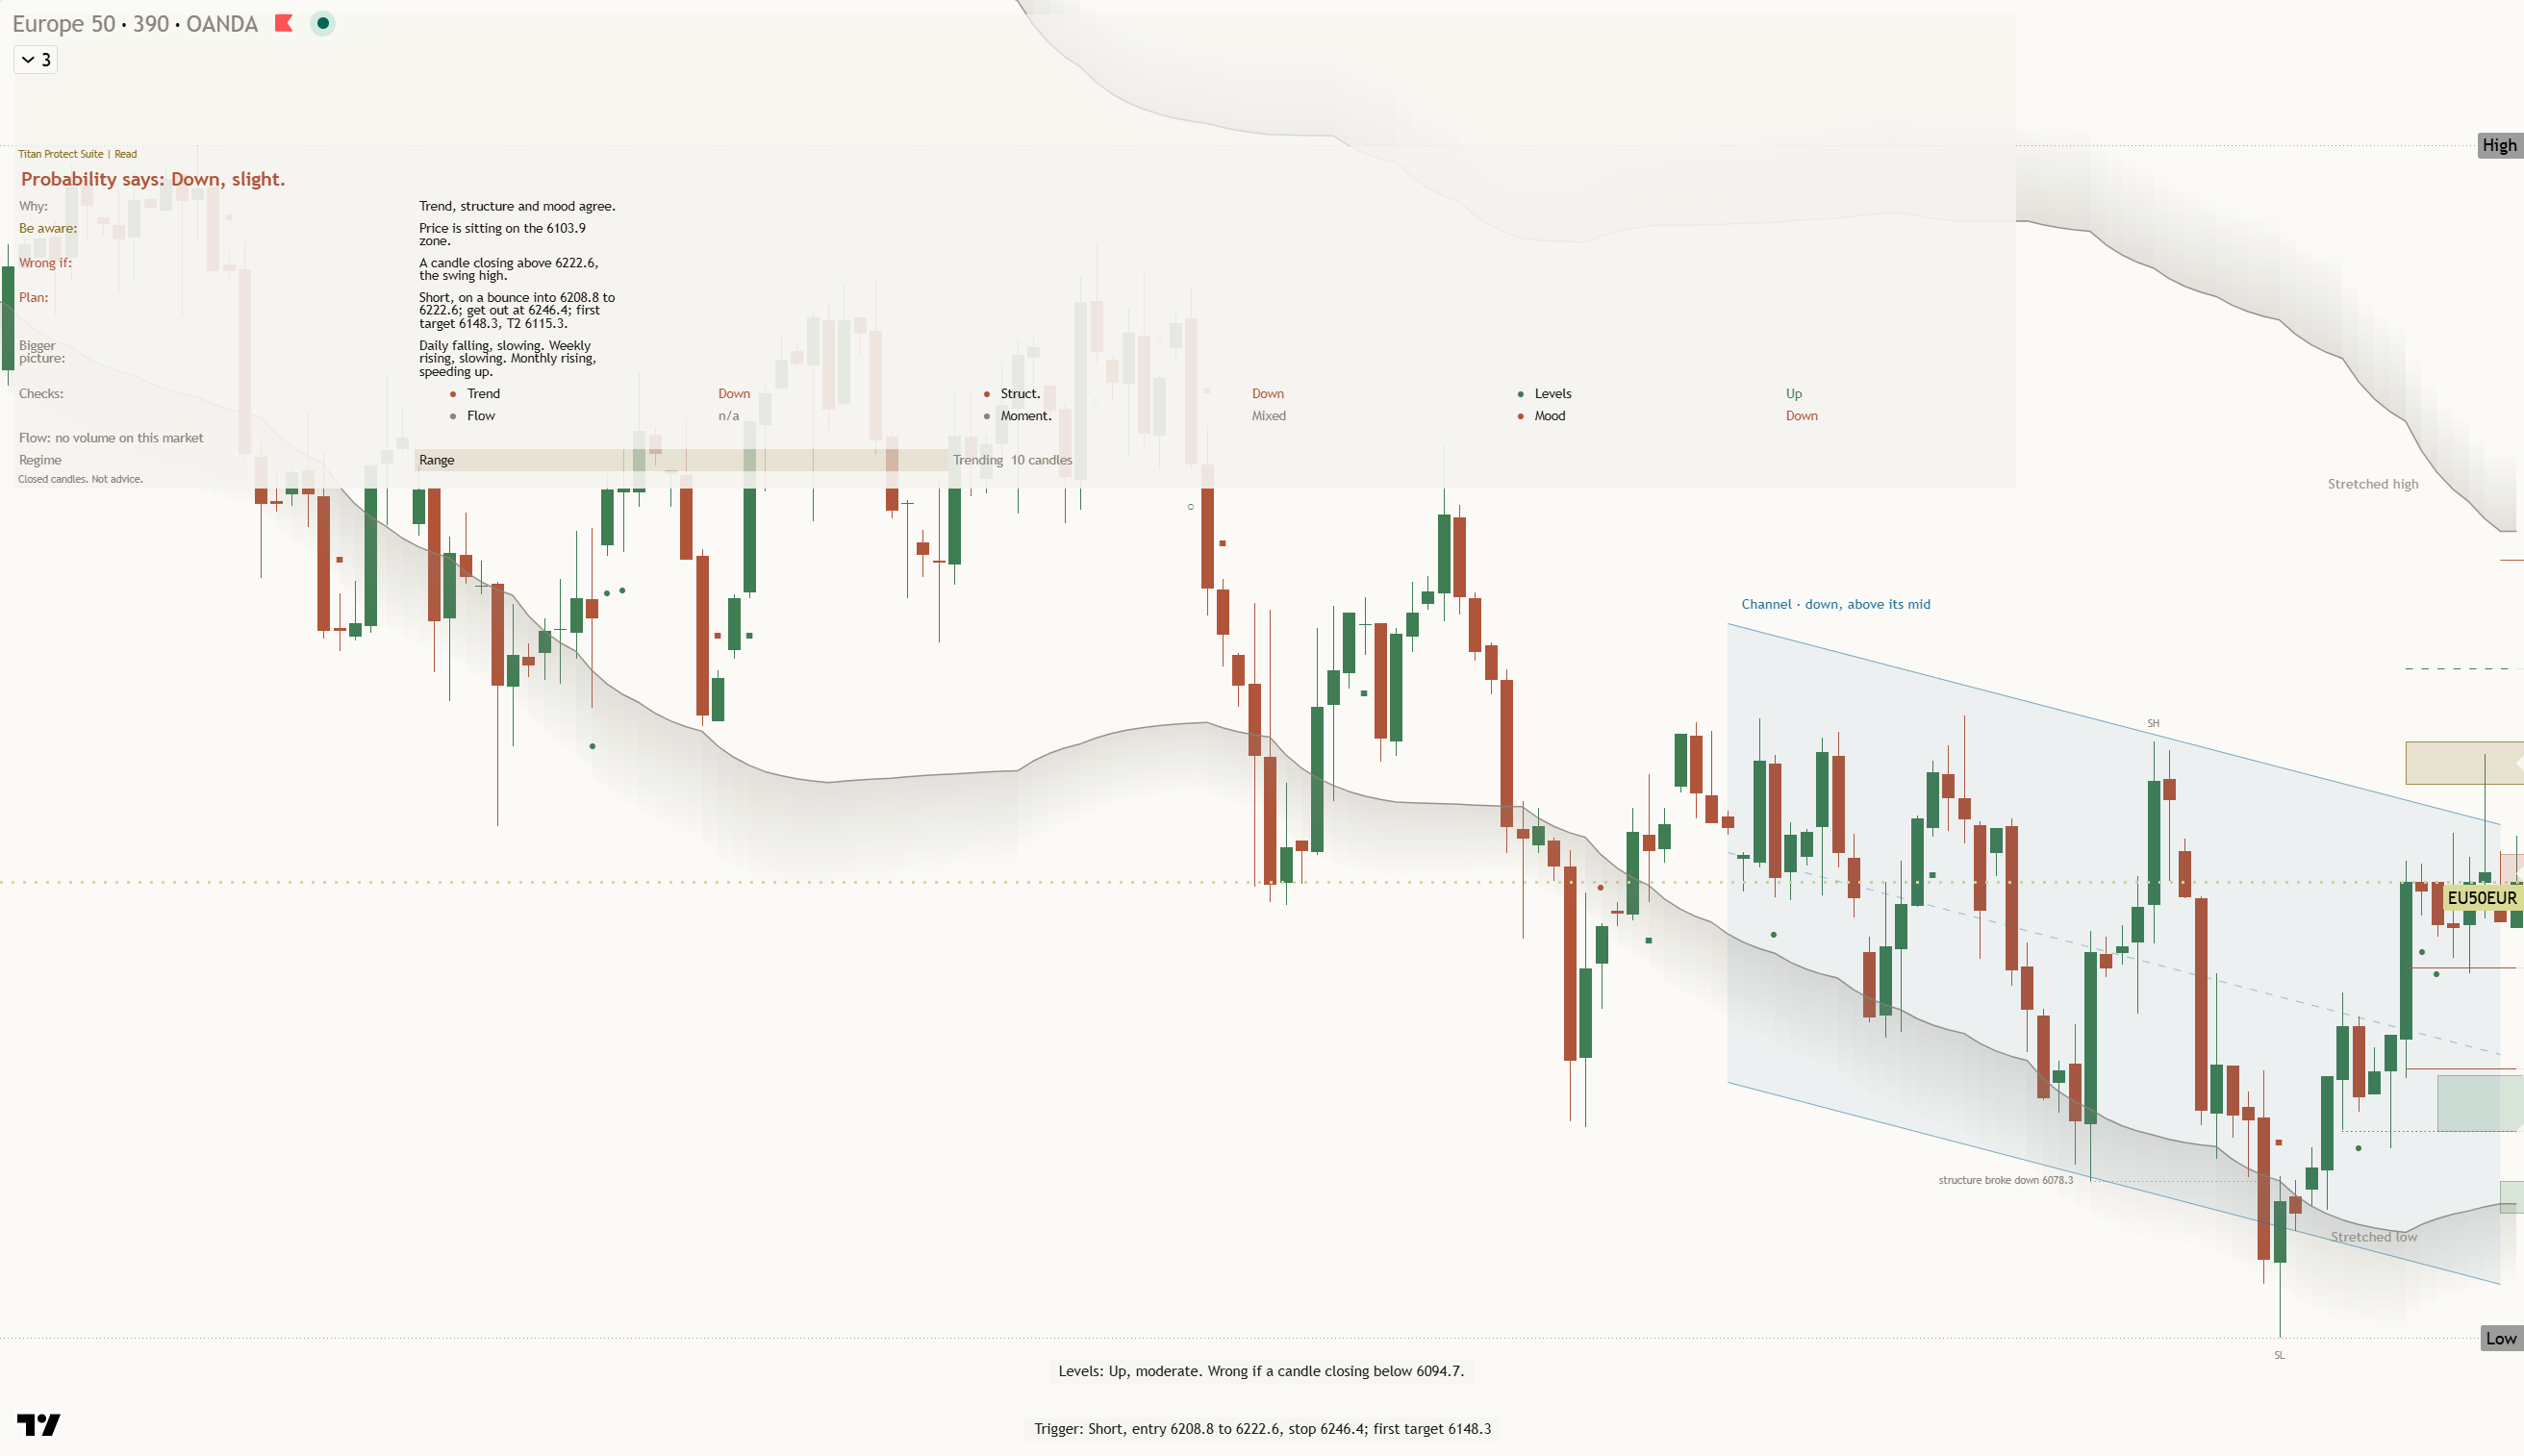
Key levels: support 622.9 (3.3% below), resistance 645.6 (0.2% above), one-month average 637.1, three-month range 622.9 to 663.4.
This is analysis, not financial advice. Always do your own research and manage your risk.