Nikkei 225 (NKY) – Daily Read
8 October 2026 | Index | Titan Macro Desk
69,561.4
The Nikkei 225 remains in a clean uptrend, but the immediate test is whether buyers can absorb profit-taking at the top of the range. Last price 69,561, 1.6 percent lower on the day, signals hesitation rather than confirmed trend damage. The clear view is constructive while the market holds its recent breakout structure, although the proximity of major resistance makes fresh upside harder earned. This matters because acceptance at new highs would confirm that investors still see Japanese equities as capable of outperforming despite a less forgiving global backdrop.
The context is a tension between domestic equity support and tightening global financial conditions. Weakness in the yen has helped exporters and supported overseas earnings translation, while policy expectations and corporate reform remain important pillars for the asset class. Against that, rising global bond yields, firm energy prices, softer risk appetite, and pressure on technology shares are encouraging investors to take profits after a rapid advance. The index is pressing the top of its one-month range after gaining roughly 4.8 percent over the last two weeks, so the current decline looks consistent with position trimming. The key question is whether selling remains orderly or develops into a broader reassessment of growth, policy, and valuation.
The one month average at 66,476 is the first meaningful structural reference. Price is above it, and the structure reads as a clean uptrend, price above both its one-month and longer averages. Holding that zone would show that buyers still regard pullbacks as opportunities rather than warnings. Nearer round number handles at 70,000 and 69,000 frame the immediate contest. Regaining 70,000 would indicate that supply near the highs is being absorbed, while sustained trade below 69,000 would suggest the pullback is gaining traction.
The month swing high at 70,799, about 1.8 percent above the current price, is the decisive ceiling because it defines the upper boundary of both the recent advance and the three month range of 60,449 to 70,799. A decisive move above 70,799 opens the path toward 71,000, with the breakout likely to draw renewed participation. On the downside, a shelf of support at 62,726, about 9.8 percent below, is the major line defended by prior demand and the broader rising structure. Losing 62,726 exposes 60,449 and would turn a normal correction into a deeper challenge to the trend.
The bull path is straightforward: if 69,000 holds, the index recovers 70,000, and buyers force acceptance above 70,799, then 71,000 becomes the next destination and the market confirms that profit-taking has been absorbed. The bear path begins if 69,000 fails and price cannot reclaim it. That would shift attention toward 66,476. If that reference also gives way, pressure would build toward 62,726, where failure would expose 60,449.
The main risk is a sharper rise in yields, renewed energy stress, a stronger yen, or heavier selling in technology and export leaders. The read is invalidated by sustained weakness below 62,726. Net, the trend remains bullish, but conviction now depends on defending 69,000 and converting 70,799 from resistance into support.
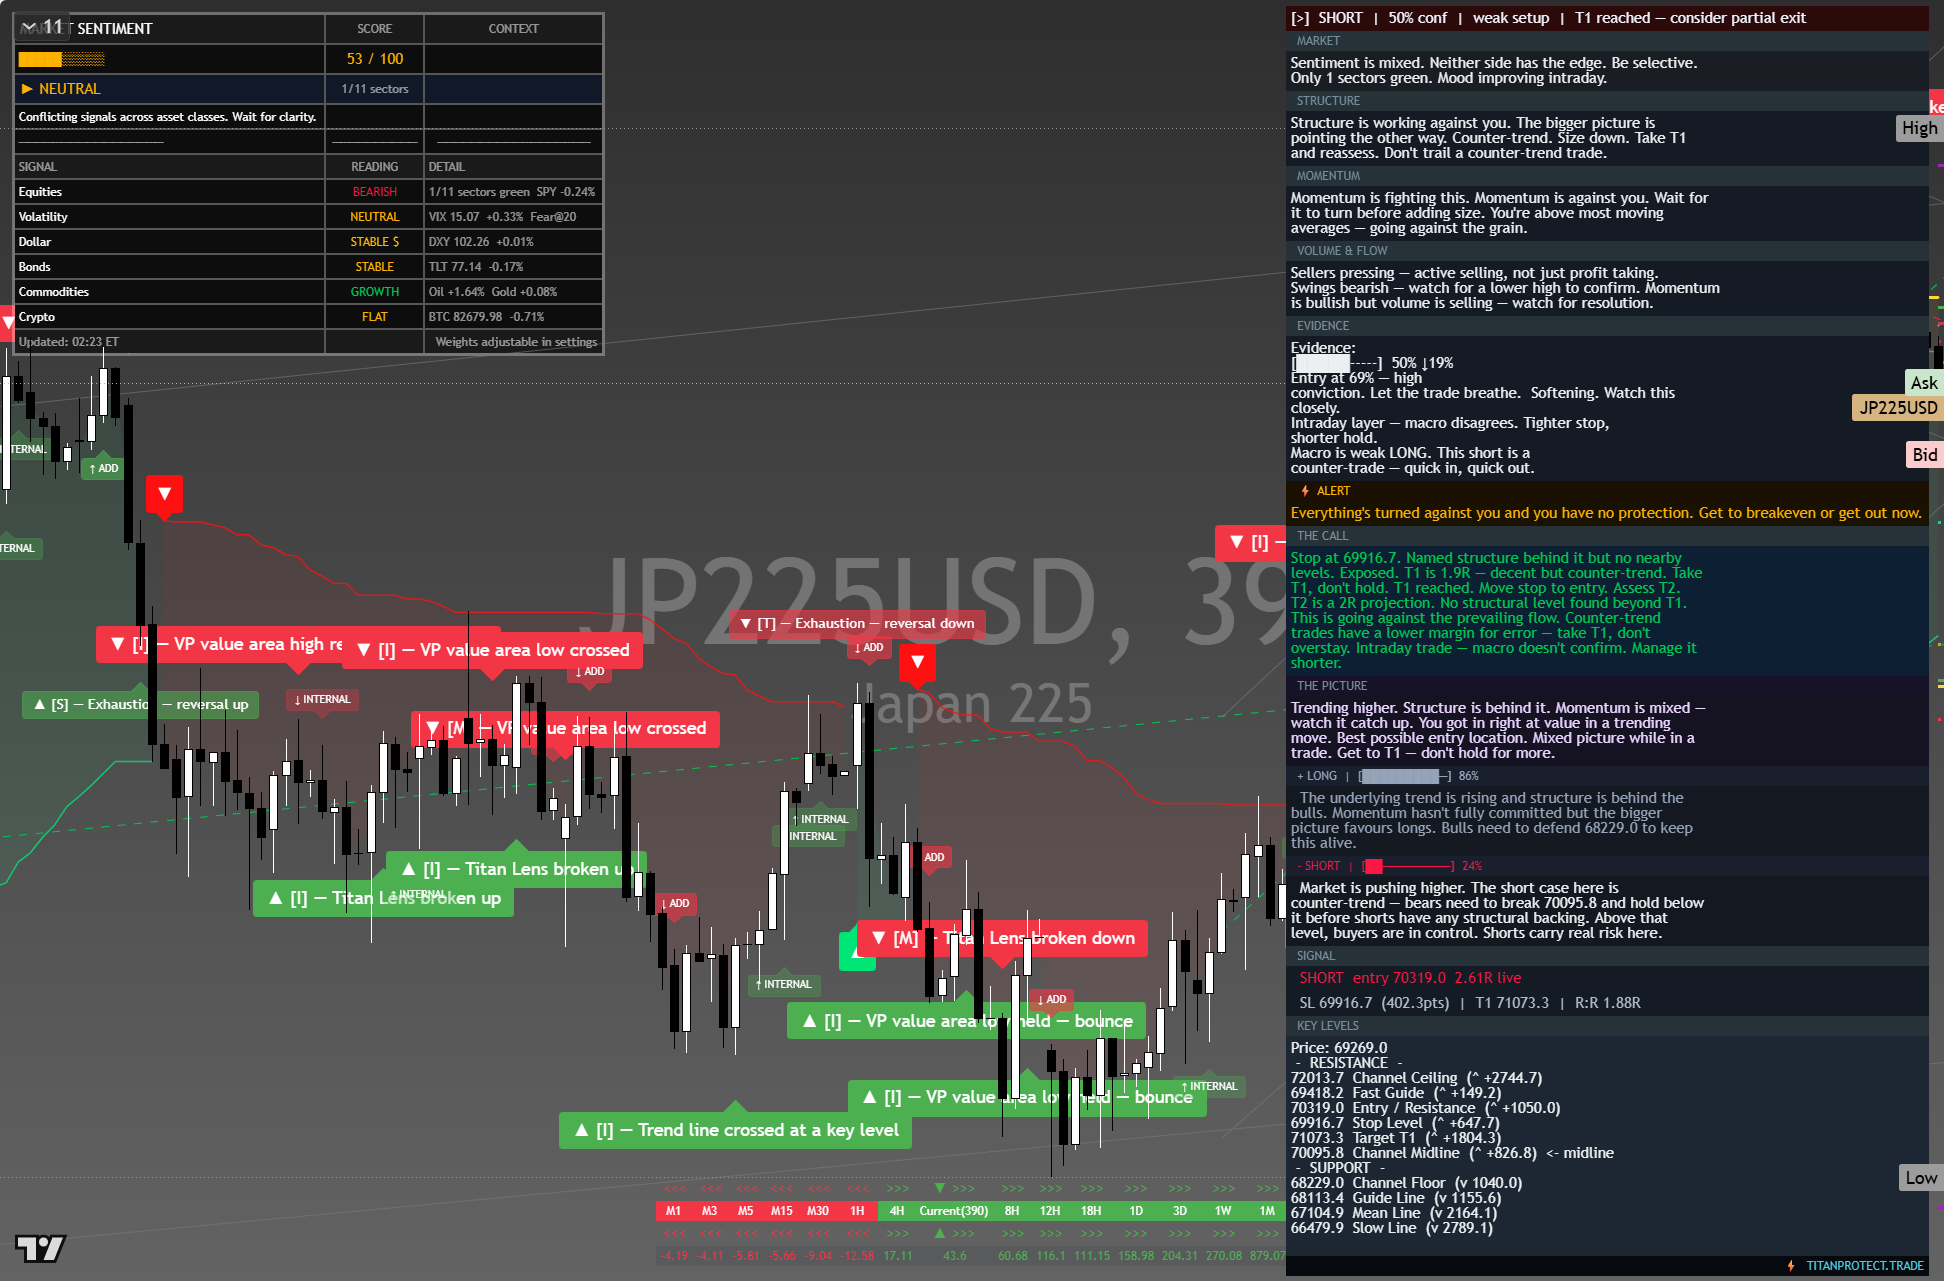
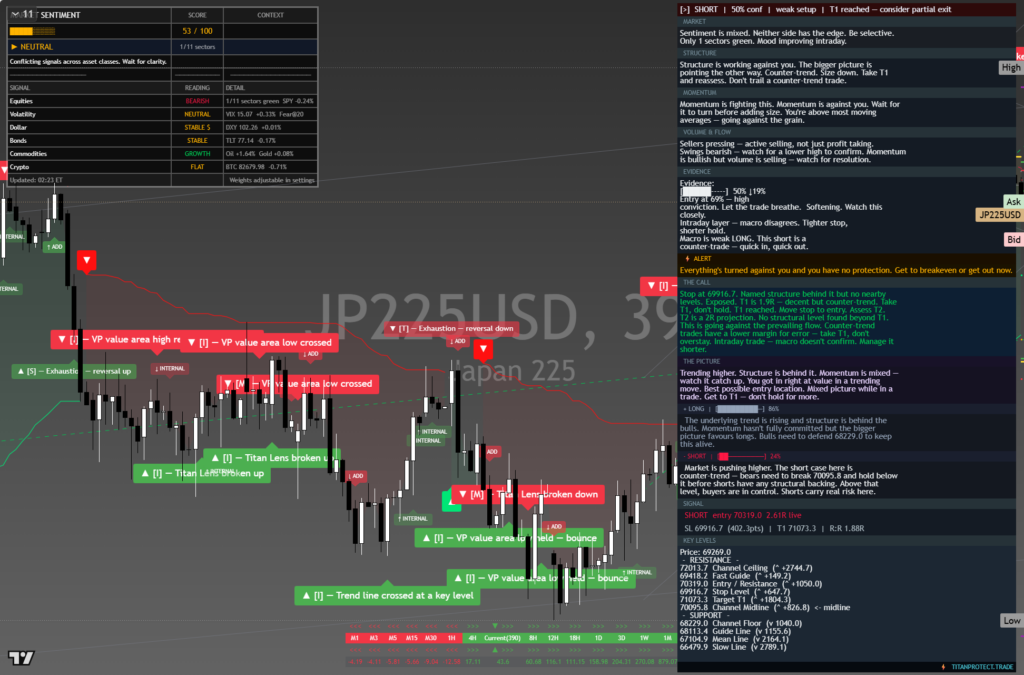
The chart above is the full daily read: structure, momentum, the levels that matter, and where the current price sits against them. Read it top to bottom for the complete picture, and pair it with our session briefs for the wider market context.
This is analysis, not financial advice. It reflects our multi-factor framework and is not a recommendation to buy or sell. Always do your own research and manage your risk.