Natural Gas – Daily Read
8 October 2026 | Commodity | Titan Macro Desk
$3.26
Natural Gas is pressing higher, with the last price at $3.26, 1.6 percent higher on the day, and the underlying structure still favoring buyers. The important point is not simply that price is advancing, but that it is holding in the upper half of its one-month range after sustained gains. That shows the market is accepting higher prices rather than immediately fading them. The clear view is constructive while nearby support holds, although the market is now approaching an area where buyers must prove they can extend the move.
The macro backdrop matters through expectations for demand, supply discipline, storage availability, weather sensitivity, and flows into power generation and export channels. Natural Gas can react sharply when those expectations change, so positioning near the top of a recent range carries both opportunity and event risk. Momentum is roughly 5.0 percent up over the last two weeks, reinforcing the sense that buyers remain in control. The one month average is $3.06; price is above it, and the structure reads as a clean uptrend, price above both its one-month and longer averages. That alignment matters because pullbacks are more likely to attract demand while the market continues to accept value above its recent baseline.
The first immediate test is the round number handle at $3.30. It matters because the current price is close enough for short-term traders to use it as a decision point, and sellers may defend it to prevent a fresh challenge of the range ceiling. The other nearby round number handle at $3.20 is the first practical defense for buyers. Holding it would keep the latest advance orderly, while losing it would suggest that upward pressure is weakening and could pull attention back toward the one month average at $3.06.
The month swing high is $3.39, about 4.1 percent above the current price, and it is also the upper boundary of the three month range $2.62 to $3.39. That makes it the defining resistance rather than just another price marker. A decisive move above $3.39 opens the path toward $3.40, with the break signaling that the market has escaped its broader range and is prepared to seek acceptance at a higher level. On the downside, a shelf of support at $2.82, about 13.6 percent below, is the major structural defense. It separates a routine correction from a deeper deterioration, and losing $2.82 exposes $2.62.
The bull path is straightforward: if price holds $3.20, clears $3.30, and then decisively breaks $3.39, the uptrend gains confirmation and $3.40 becomes the next objective. The bear path begins if repeated rejection around $3.30 weakens demand. If that leads to a loss of $3.20 and price cannot stabilize around $3.06, the correction can broaden toward $2.82. If $2.82 then fails, the full three-month structure is damaged and $2.62 comes into view.
The main risk is a sudden change in demand or supply expectations that overwhelms the current price structure. The constructive read is invalidated by sustained trade below $2.82. Net, buyers retain control, but confirmation requires a clean break of $3.39 rather than enthusiasm beneath it.
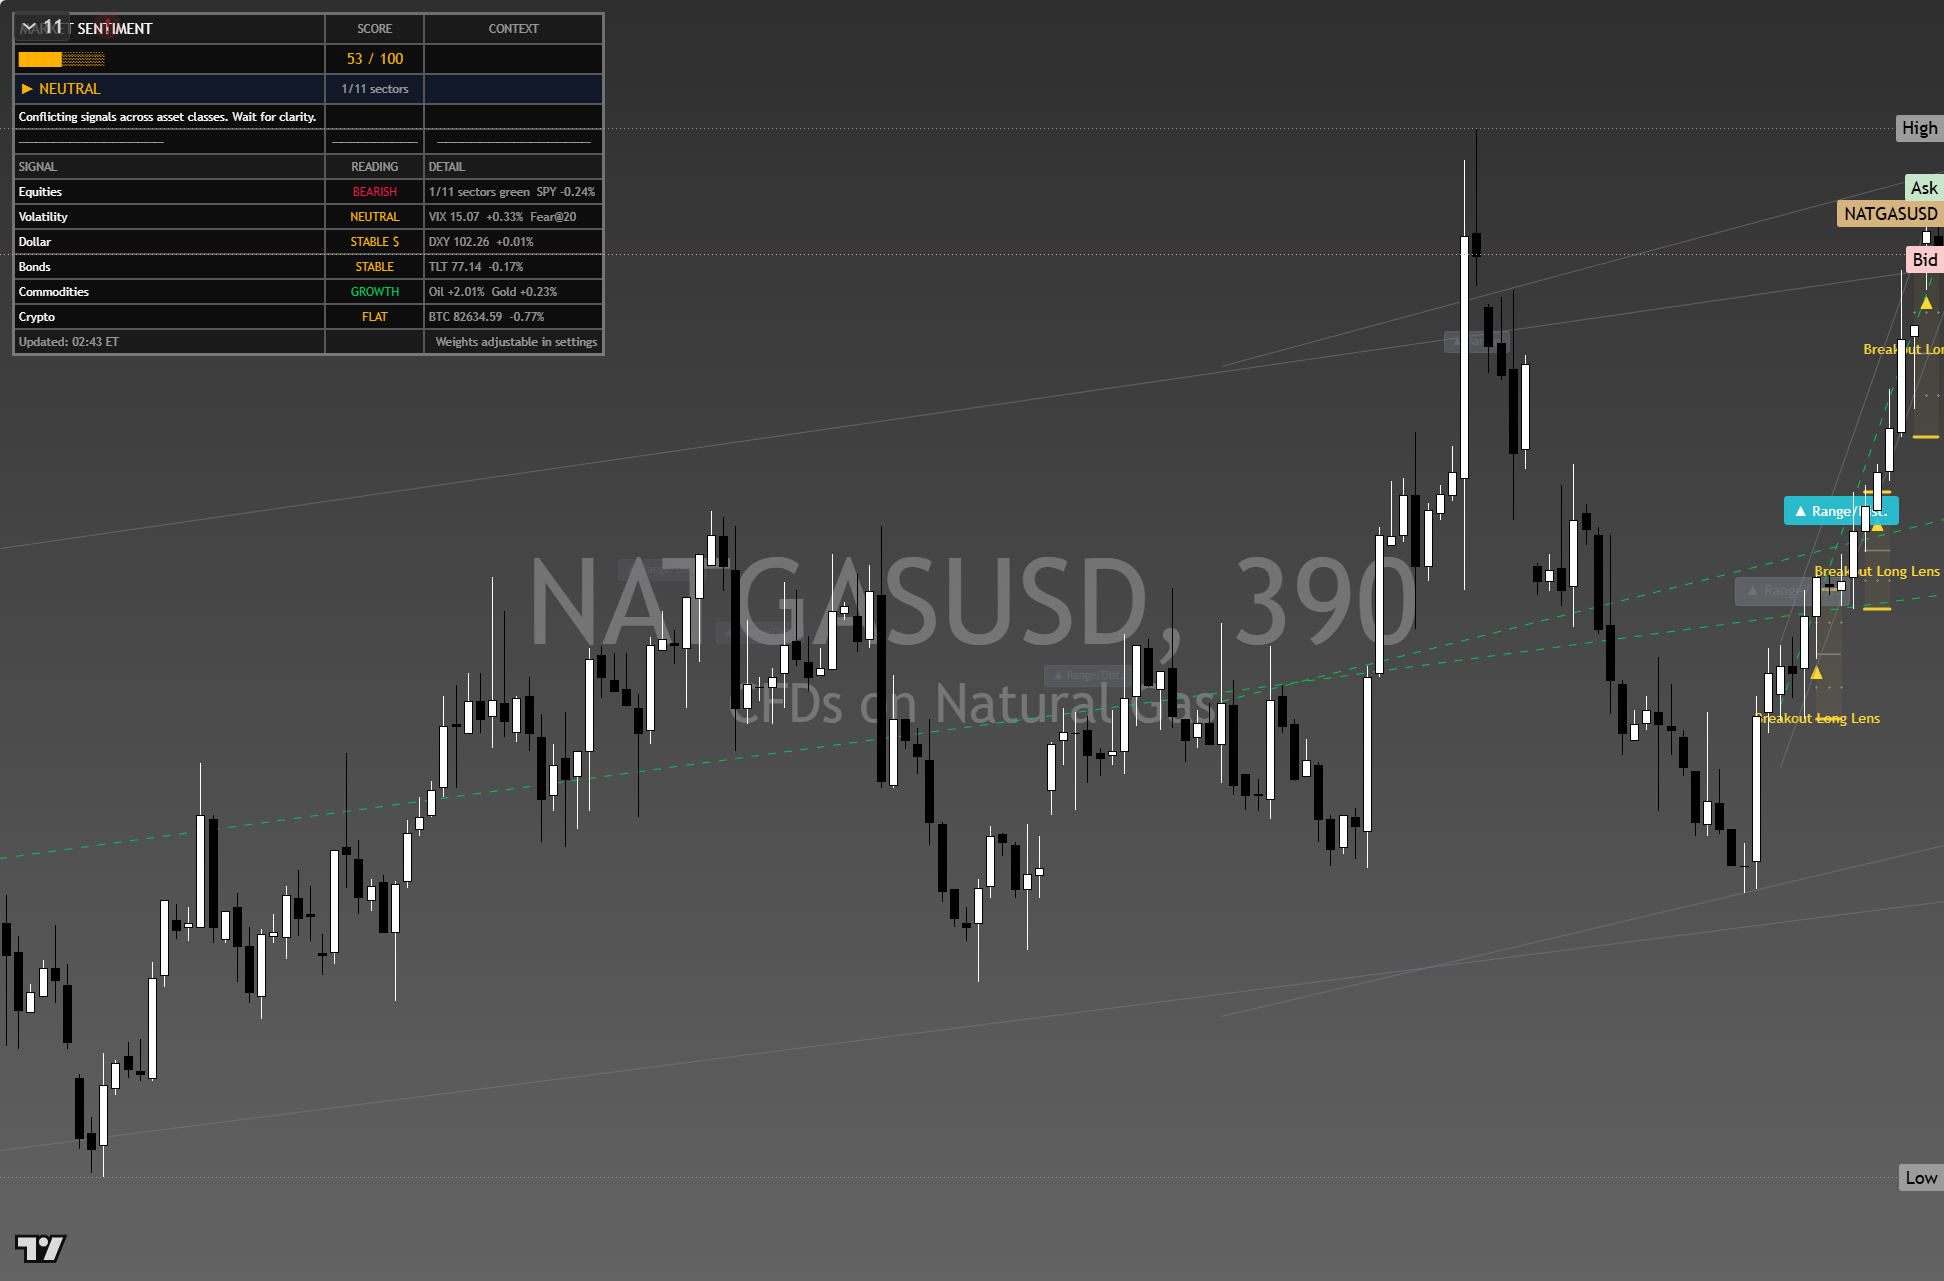
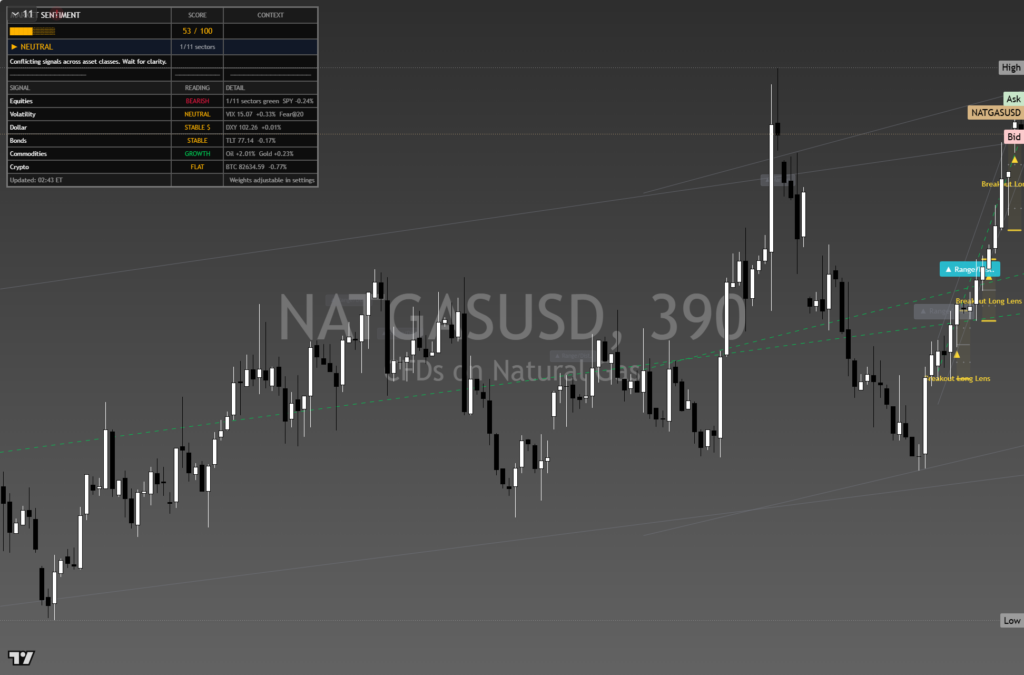
The chart above is the full daily read: structure, momentum, the levels that matter, and where the current price sits against them. Read it top to bottom for the complete picture, and pair it with our session briefs for the wider market context.
This is analysis, not financial advice. It reflects our multi-factor framework and is not a recommendation to buy or sell. Always do your own research and manage your risk.