Nasdaq 100 (NAS100) – Daily Read
8 October 2026 | Index | Titan Macro Desk
31,160.1
Nasdaq 100 is consolidating at the upper edge of its recent range, with Last price 31,160, 0.0 percent higher on the day. The lack of daily movement should not be mistaken for a lack of intent. It is pressing the top of its one-month range after a sustained advance, so the market is pausing where supply would naturally be expected. The clear view is constructive while price holds its underlying structure, but buyers now need a breakout rather than another orderly drift higher.
The broader macro backdrop on 8 October 2026 is best understood through risk appetite rather than unsupported assumptions about growth, inflation, or policy. For an Index dominated by large growth companies, confidence in future earnings and willingness to pay for duration are central. The instrument-specific evidence remains supportive: One month average 30,428; price is above it, and the structure reads as a clean uptrend, price above both its one-month and longer averages. Momentum roughly 1.8 percent up over the last two weeks. That combination suggests demand has remained persistent, although proximity to the range ceiling raises the risk of short-term hesitation and profit-taking.
The immediate reference point is the Month swing high 31,361, about 0.6 percent above the current price. This matters because it marks the point where prior buying stopped and sellers previously found enough supply to cap the advance. A decisive move through it would show that supply has been absorbed. The nearer round number handles at 32,000 and 31,000 frame the short-term contest. The upper handle is the next natural objective for breakout demand, while the lower handle should attract buyers seeking to defend the current range. Holding above it would preserve pressure on the highs; slipping below it would indicate that the breakout attempt is losing urgency.
The deeper structure is defined by the Three month range 27,176 to 31,361. Within that range, A shelf of support at 28,753, about 7.7 percent below. This is more than a distant downside marker because it separates a routine pullback within the advance from damage to the broader trend. Buyers defending that shelf would keep the larger pattern intact. Failure there would signal that demand has weakened materially and that the market is rotating back toward the bottom of its established range.
The bull path is straightforward: if buyers produce a decisive move above 31,361, then the path toward 32,000 opens as resistance gives way and sidelined demand follows the break. Acceptance above that handle would reinforce the case that the range has resolved higher. The bear path develops in stages: if 31,000 fails to hold, then consolidation can deepen; if selling subsequently overwhelms 28,753, then 27,176 becomes exposed as the next meaningful destination.
The principal risk is a failed push through the high that quickly loses 31,000, because that would turn apparent strength into trapped positioning. The read is invalidated more decisively by losing 28,753 exposes 27,176. Net, the Nasdaq 100 remains bullish in structure, but conviction now depends on confirmation above the range ceiling, not merely proximity to it.
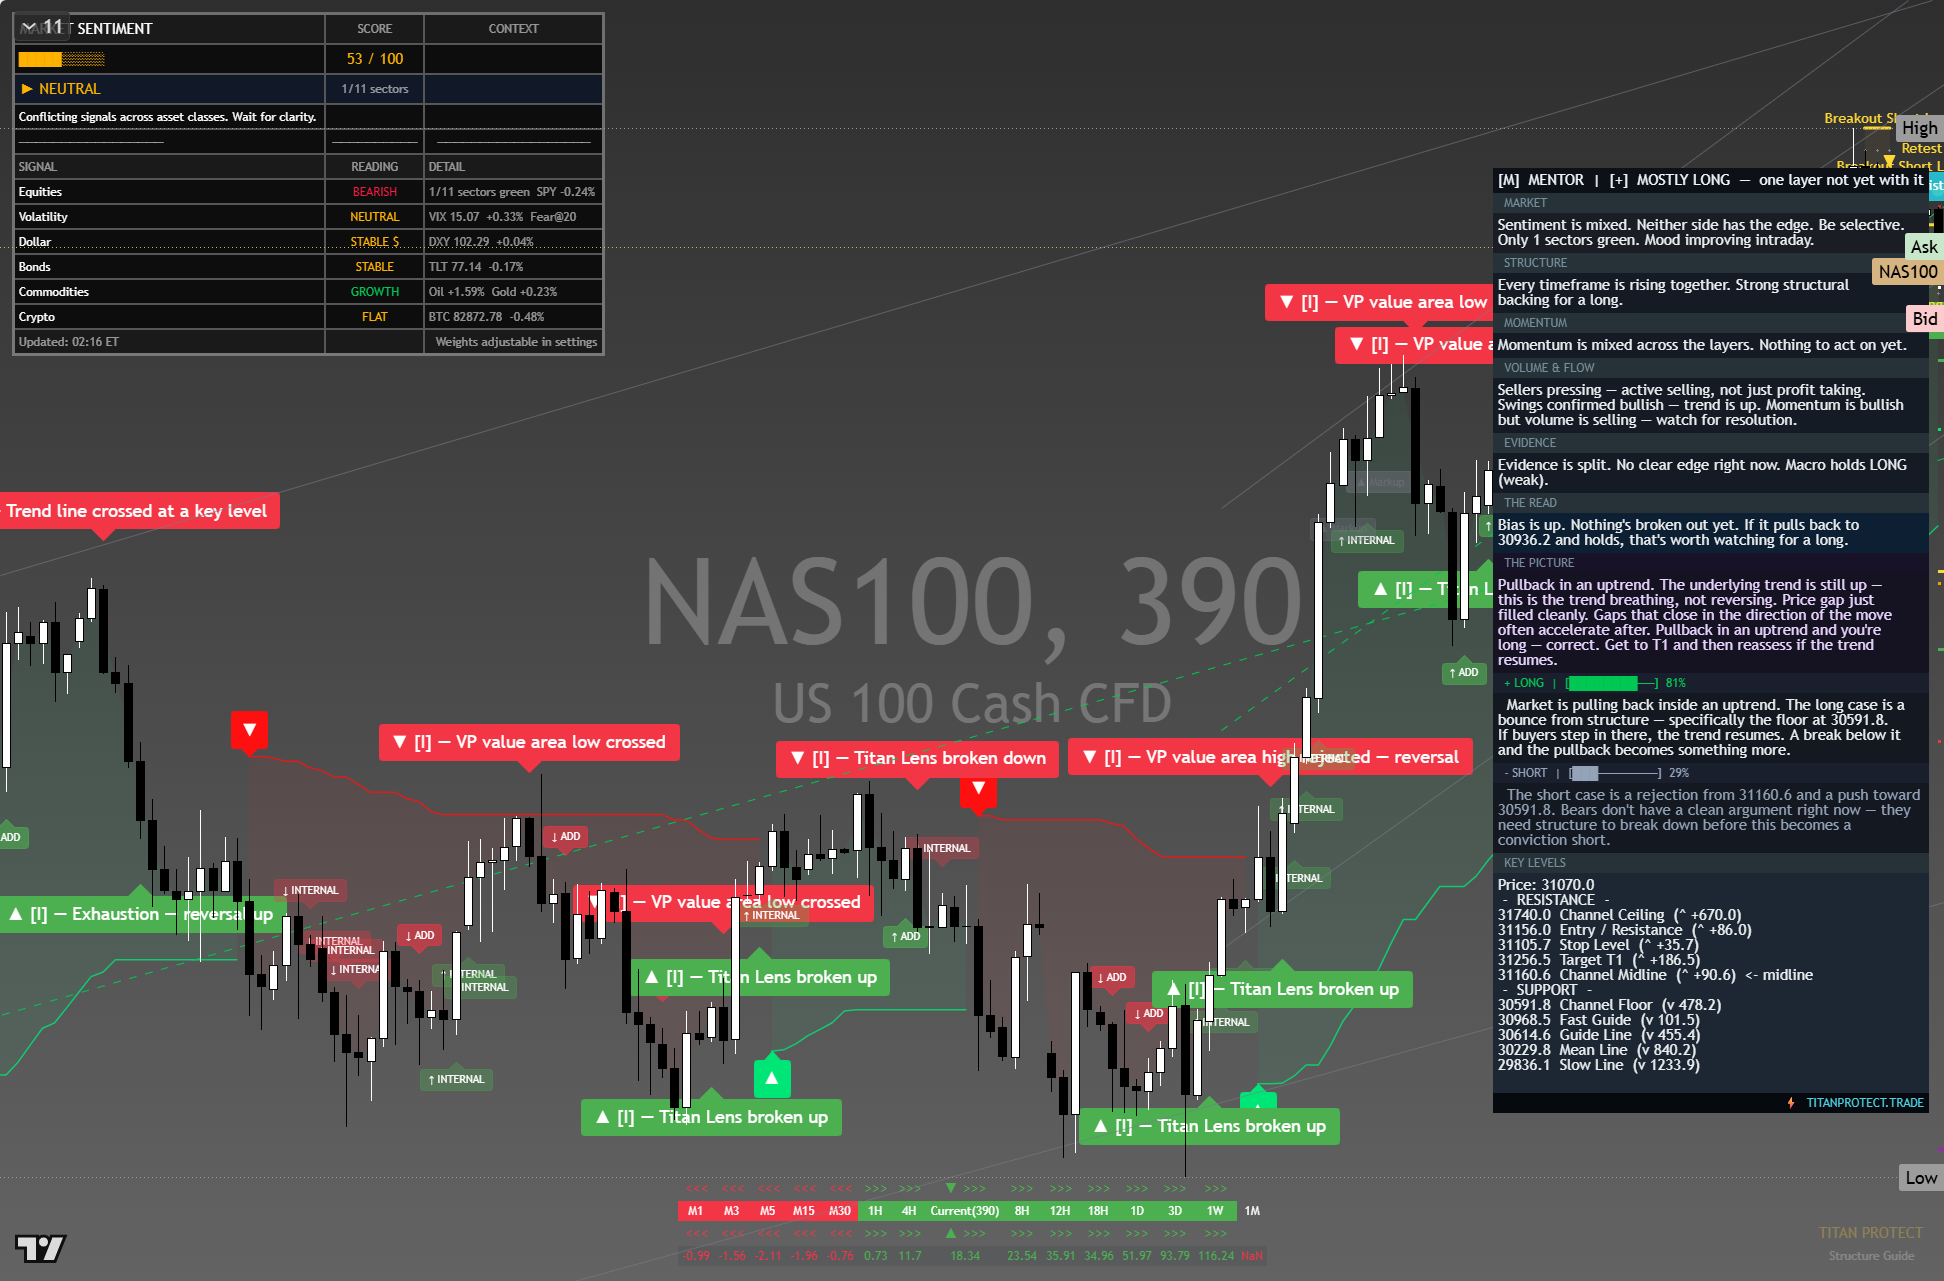
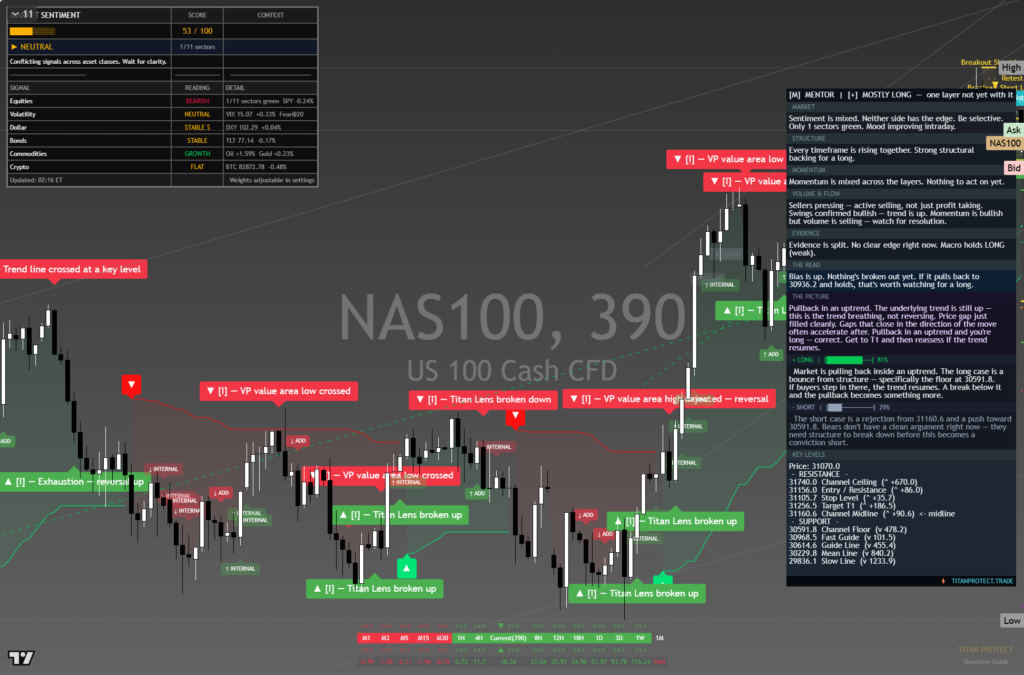
The chart above is the full daily read: structure, momentum, the levels that matter, and where the current price sits against them. Read it top to bottom for the complete picture, and pair it with our session briefs for the wider market context.
This is analysis, not financial advice. It reflects our multi-factor framework and is not a recommendation to buy or sell. Always do your own research and manage your risk.