Microsoft (MSFT) – Daily Read
6 September 2026 | Stock | Titan Macro Desk
$499.70
Microsoft is absorbing a sharp daily setback without yet losing its broader trend. The Last price $499.70, 2.0 percent lower on the day. matters because the decline has brought the stock back to an important decision area rather than delivering a confirmed structural break. It is sitting mid-range over the past month. That leaves neither side in full control, but the underlying bias remains constructive while buyers continue to hold the established trend.
The macro backdrop is less forgiving for richly valued technology shares after a stronger labor report revived concern that monetary policy could remain restrictive, lifting yields and pressuring the broader market. That makes Microsoft sensitive to changes in the cost of capital even when its operating story remains sound. [Recent market reporting](https://apnews.com/article/1af16359af43eb8abc66445465f633c8) shows that this pressure is affecting equities broadly. For Microsoft specifically, the debate remains centered on whether strong demand for Azure and artificial intelligence services can justify the scale and duration of infrastructure spending. The business has powerful cloud demand and expanding AI distribution, but investors increasingly want evidence that heavy investment can translate into durable returns. Against that tension, Momentum roughly 3.4 percent up over the last two weeks. suggests the current weakness is a test of recent demand, not yet a reversal.
The One month average $495.73; price is above it, and the structure reads as a clean uptrend, price above both its one-month and longer averages. That makes the nearby $500.00 handle the immediate pivot. Holding around it would show that buyers are willing to defend the trend despite the daily decline. The $490.00 handle is the next practical test because a retreat through it would place the price below the one-month reference and weaken the clean structure. Above, the Month swing high $517.78, about 3.6 percent above the current price. is the key supply boundary where prior buying stalled. Below, A shelf of support at $477.15, about 4.5 percent below. represents the more important line of defense. The Three month range $355.43 to $517.78. shows how much ground has already been covered and why the upper boundary may require a genuine catalyst rather than routine dip buying.
The bull path is straightforward: if Microsoft stabilizes around $500.00, holds $495.73, and then reclaims demand above the recent high, a decisive move above $517.78 opens the path toward $527.78. That sequence would confirm that buyers absorbed the setback and converted prior resistance into continuation. The bear path begins if $500.00 fails to attract support and selling carries through $490.00. If that weakness extends into the lower shelf, losing $477.15 exposes $355.43. Such a move would signal that the market is no longer treating weakness as consolidation within an uptrend.
The principal risk to the constructive view is a renewed rise in yields combined with deeper skepticism over AI investment returns. Company-specific disappointment around cloud demand, capacity deployment, or spending discipline would intensify that pressure. The bullish read is invalidated by a sustained loss of $477.15, while failure to hold $495.73 would be an earlier warning. Net, Microsoft remains structurally constructive, but buyers must defend the current pivot before another attack on $517.78 becomes credible.
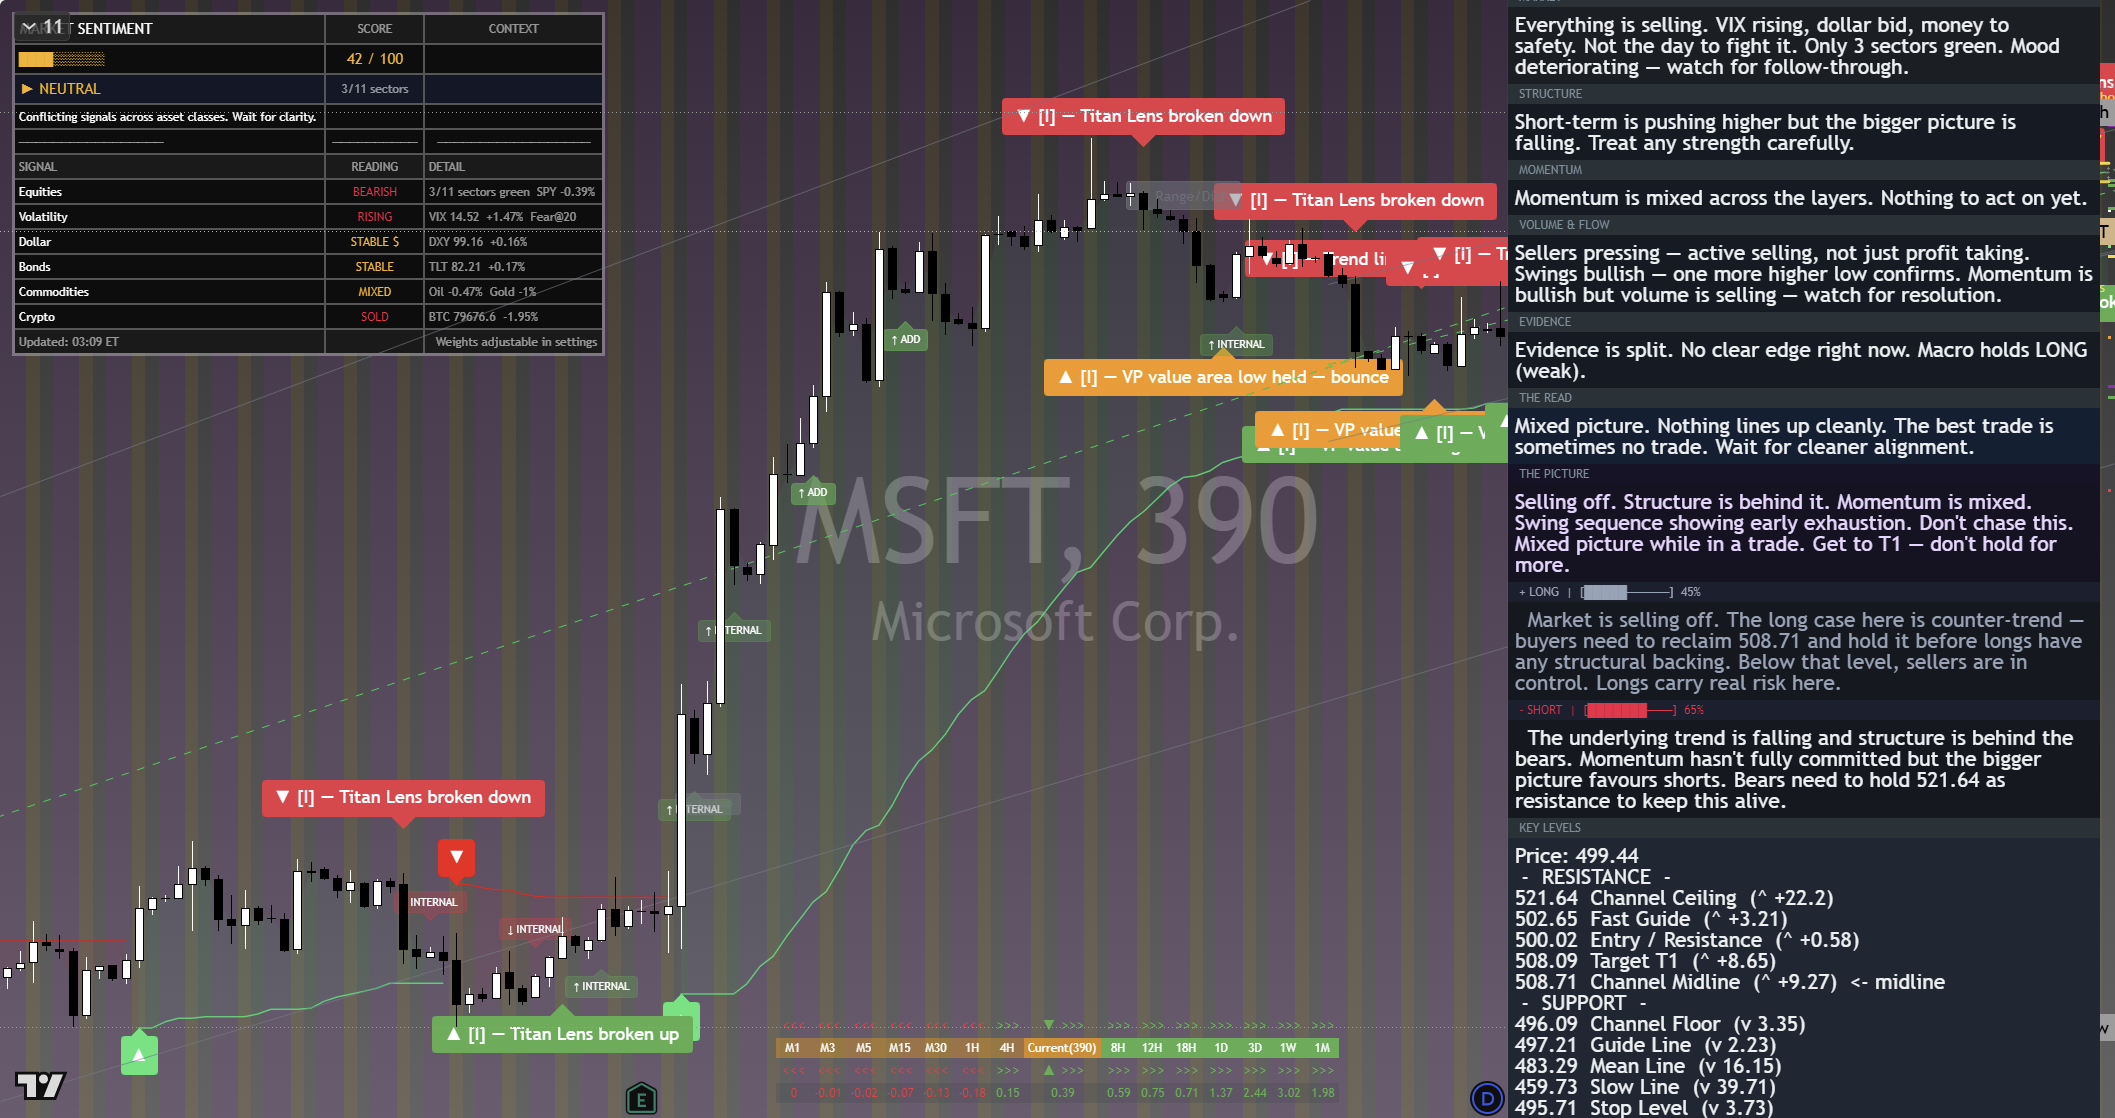
The chart above is the full daily read: structure, momentum, the levels that matter, and where the current price sits against them. Read it top to bottom for the complete picture, and pair it with our session briefs for the wider market context.
This is analysis, not financial advice. It reflects our multi-factor framework and is not a recommendation to buy or sell. Always do your own research and manage your risk.