
Meta (META) – Daily Read
6 September 2026 | Stock | Titan Macro Desk
$616.77
Meta (META) enters 6 September 2026 with buyers in control, but at a point where conviction must replace momentum. The last price is $616.77, 1.0 percent higher on the day, and the stock is pressing the top of its one-month range. The clear view is constructive: this recovery can extend if demand holds near the breakout area. Why it matters is that Meta is moving from repair into potential expansion, where price acceptance matters more than the speed of the recent advance.
The macro backdrop remains important because large technology stocks are highly sensitive to changes in growth expectations, capital costs, and confidence in corporate investment. Within equities, Meta also carries the expectations attached to a major platform business, including scrutiny of advertising demand, spending discipline, and the return generated by heavy investment. Momentum is roughly 12.2 percent up over the last two weeks, showing that buyers have already repriced the near-term outlook. The one month average is $576.91; price is above it, and the structure reads as a recovery attempt, back above the one-month average but still under the longer one. That leaves the stock tactically strong without yet proving that the broader repair is complete.
The immediate decision zone is tightly defined. The month swing high at $619.44 is about 0.4 percent above the current price, so it is the first test of whether fresh demand can absorb selling from holders using the range high to reduce exposure. The nearer round number handles at $620.00 and $610.00 frame that contest. Holding $610.00 would show that buyers are defending the upper part of the range, while sustained trade through $619.44 and $620.00 would indicate acceptance above prior supply. The wider three month range is $524.52 to $682.50, which makes $682.50 the meaningful upside reference if expansion takes hold. Below, a shelf of support at $537.28, about 12.9 percent below, represents the more important structural defense. It should attract buyers who missed the recovery, but a failure there would signal that the entire rebound has lost sponsorship.
The bull path is straightforward: if Meta decisively clears $619.44, then the breakout should draw follow-through buying and open the path toward $682.50. If it also treats $620.00 as support on a pullback, then the move has better quality because former resistance is being defended. The bear path begins if repeated attempts above the range fail. If price loses $610.00, then momentum can cool and attention can rotate back toward $576.91. If selling then deepens and $537.28 is lost, that exposes $524.52 and turns the recovery attempt into a failed advance.
The main risk is a sharp shift in the broader appetite for large technology exposure, especially if investors become less willing to reward long-duration investment or question Meta’s spending returns. The constructive read is invalidated by rejection around $619.44 followed by sustained weakness through $537.28. Net, Meta has earned a bullish tactical bias, but the burden is now on buyers to convert a powerful recovery into a confirmed range break.
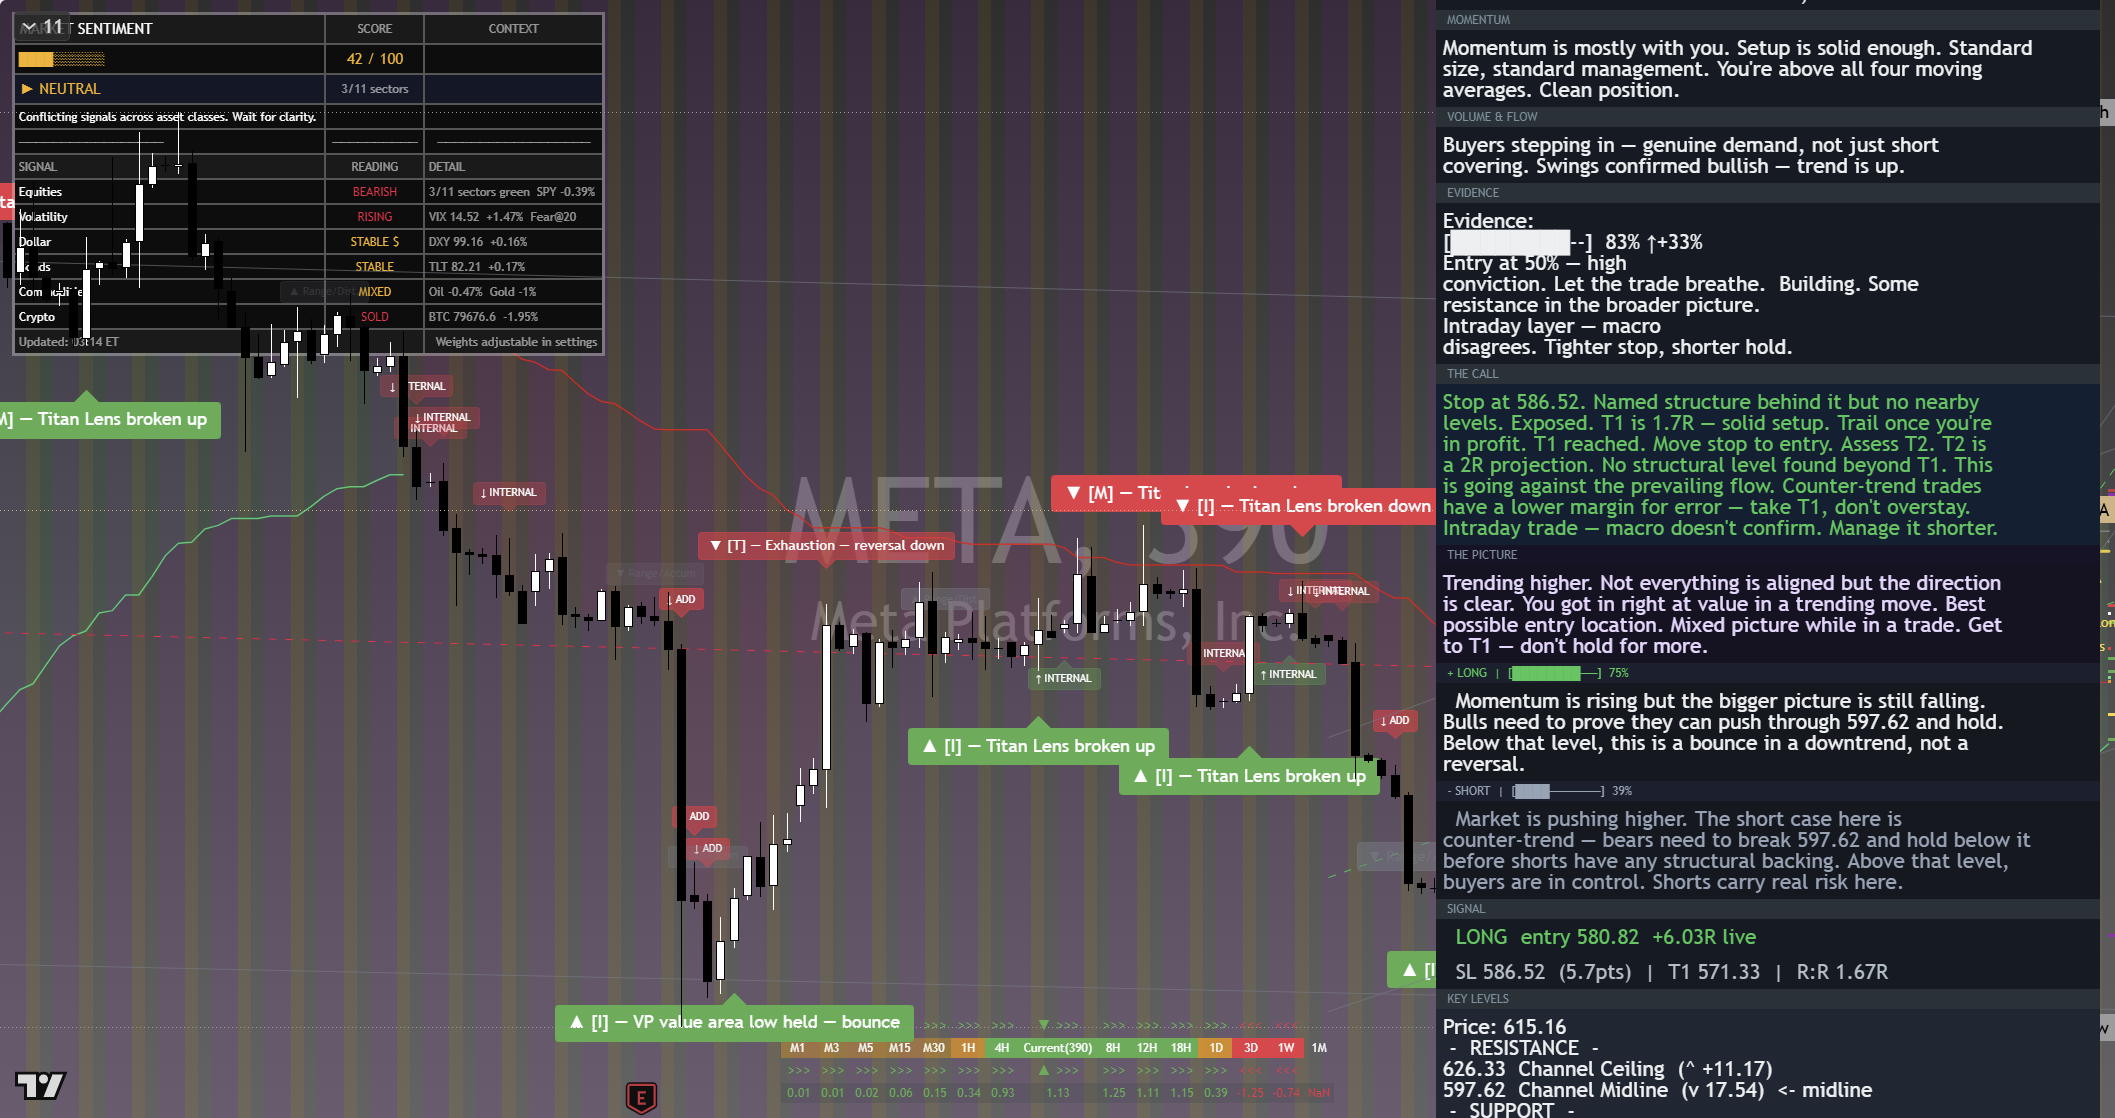
The chart above is the full daily read: structure, momentum, the levels that matter, and where the current price sits against them. Read it top to bottom for the complete picture, and pair it with our session briefs for the wider market context.
This is analysis, not financial advice. It reflects our multi-factor framework and is not a recommendation to buy or sell. Always do your own research and manage your risk.



