VIX Session Movement and Fear Pricing
VIX rose 2.99 percent to 19.26 from 18.70 which means equity volatility expectations increased over the session after the prior day’s 6.92 percent jump. This move took the index 0.56 points above the previous close and above the five day average of 18.27 which means the market has now priced moderate fear into the 30 day window. The session range ran from a low of 17.64 to a high of 20.92 which means intraday repricing reflected abrupt shifts in hedging demand rather than steady drift.
Term Structure and Front Curve Details
VIX9D printed at 17.37 against spot VIX of 19.06 which means the market prices reduced volatility over the next nine days relative to the broader window. This configuration leaves the shortest slice in contango and widens the gap by 0.25 points from yesterday which means any equity move now carries a steeper near term premium only beyond the immediate nine days. The depressed front end keeps short dated hedging costs anchored while the spot level signals caution further out.
Volatility of Volatility Readings
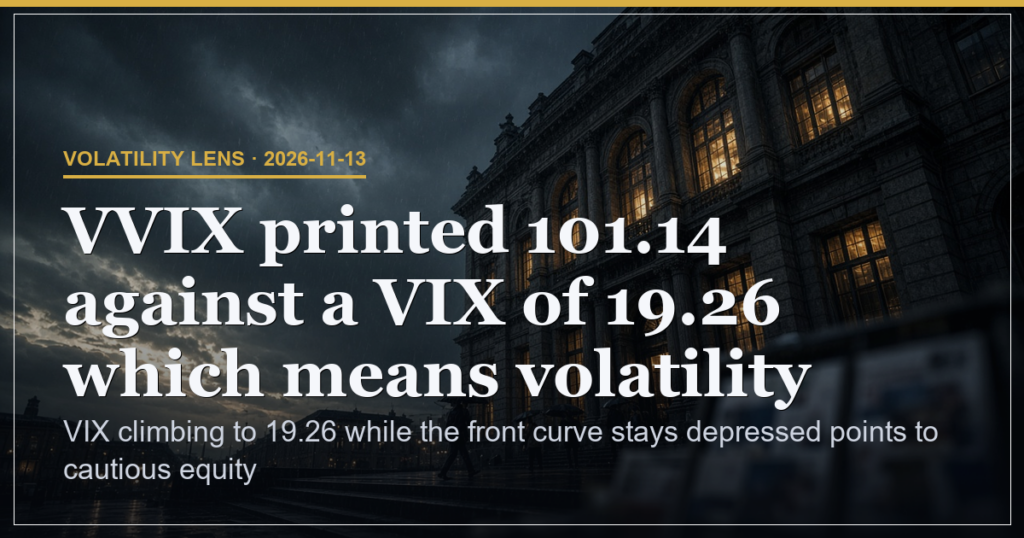
VVIX reached 101.14 against a VIX of 19.26 which means volatility of volatility stayed high even as the main index remained moderate. Elevated VVIX at this level implies option hedging costs can swing sharply on modest equity moves which means surface stability masks potential for rapid repricing in volatility products themselves.
Daily Bounds and Nearby Levels
The five day average of 18.27 sits 0.99 points below the current print and acts as nearby support which means a sustained hold above it would confirm the shift toward higher baseline fear. Resistance aligns with the session high of 20.92 while a return below 17.64 would reset the read to the prior compression state.
| Metric | Value | Meaning |
|---|---|---|
| VIX close | 19.26 | Equity fear now moderate after 2.99 percent rise |
| VIX9D versus spot | 17.37 / 19.06 | Front curve prices lower near term moves |
| VVIX level | 101.14 | Vol of vol elevated so hedging costs remain unstable |
Scenario Triggers and Working Odds
Three outcomes carry the following odds that sum to 100. A VIX print above 20.92 on a single session close triggers the 35 percent case of sustained fear repricing because the high bound would be reclaimed. A drop back below the five day average of 18.27 triggers the 40 percent case of partial reset because the market would signal the prior calm regime returning. A VVIX spike above 105 while VIX holds near 19.26 triggers the 25 percent case of surface instability because volatility of volatility would then dominate price action.
Risk Factor and Experience Watchpoints
Overall risk sits at 28 percent driven by the VVIX reading at 101.14 which means any equity move can produce outsized volatility swings even if spot VIX stays contained.
| Experience Level | What to Watch on Tape |
|---|---|
| Beginner | Track whether VIX holds above its five day average of 18.27 or slips back below |
| Intermediate | Observe how the VIX9D to spot gap of 1.69 points widens or narrows intraday |
| Advanced | Monitor VVIX moves above 101.14 for signs that vol surface is becoming unstable |
VIX climbing to 19.26 while the front curve stays depressed points to cautious equity positioning ahead.
This is analysis, not financial advice. Always manage your risk.