USD/JPY – Daily Read
13 September 2026 | Forex | Titan Macro Desk
$153.47
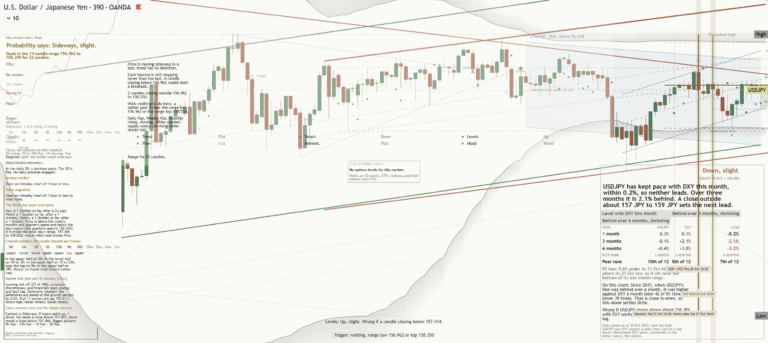
USD/JPY is in a genuine corrective phase, not merely pausing after a strong run. Last price 153.47, 0.6 percent lower on the day, leaves the pair down near the floor of its one-month range. The clear view is that rallies should remain vulnerable until the market proves it can rebuild above broken reference points. That matters because the pair is approaching support where orderly yen strength can either broaden into a deeper move or meet a forceful dollar response.
The macro backdrop is a contest between US policy uncertainty and a more assertive Japanese policy debate. Expectations around the Federal Reserve shape the dollar side through relative yield appeal, while Bank of Japan normalization and official sensitivity to yen weakness shape the Japanese side. With both central banks approaching policy decisions, positioning can matter as much as fresh information. For this instrument specifically, narrowing perceived policy divergence favors the yen, while renewed confidence in persistent US restraint would favor the dollar. The current tape says the first force is winning: the pair is roughly 3.9 percent down over the last two weeks.
The one month average at 157.41 is the first important recovery marker. Price is below it, and the structure reads as a downtrend, price under both its one-month and longer averages. That means sellers have had repeated confirmation, while buyers lack evidence of durable control. The nearer round number handle at 155.00 is therefore more than a psychological waypoint. It is the first area where a rebound must show follow-through before challenging 157.41. Above there, the month swing high at 160.39, about 4.5 percent above the current price, is the defining ceiling. A decisive move above 160.39 opens the path toward 163.99, the upper boundary of the three month range 152.88 to 163.99.
On the downside, a shelf of support at 152.88, about 0.4 percent below, is being defended by prior demand and the lower boundary of that three month range. Its proximity makes the next reaction unusually informative. If 152.88 holds and price reclaims 155.00, then short covering can carry the pair toward 157.41. If buyers then establish acceptance above 157.41, the bear trend weakens and 160.39 becomes reachable. If 160.39 breaks decisively, then 163.99 is the logical bull destination.
The bear path is cleaner. If 152.88 gives way and attempts to recover it fail, then the range floor has become resistance and losing 152.88 exposes 150.00. That nearer round number handle may attract defensive demand, but reaching it would confirm that sellers remain in control and that the decline is no longer contained by the recent range.
The main risk is event-driven reversal around central bank communication, especially if policy expectations separate sharply again. The bearish read is invalidated by sustained trade above 157.41 and fully overturned by a decisive move above 160.39. The bullish rebound case fails if 152.88 breaks and cannot be recovered. Net, the bias stays bearish below 157.41, with 152.88 the immediate decision point and 150.00 the downside objective if support fails.
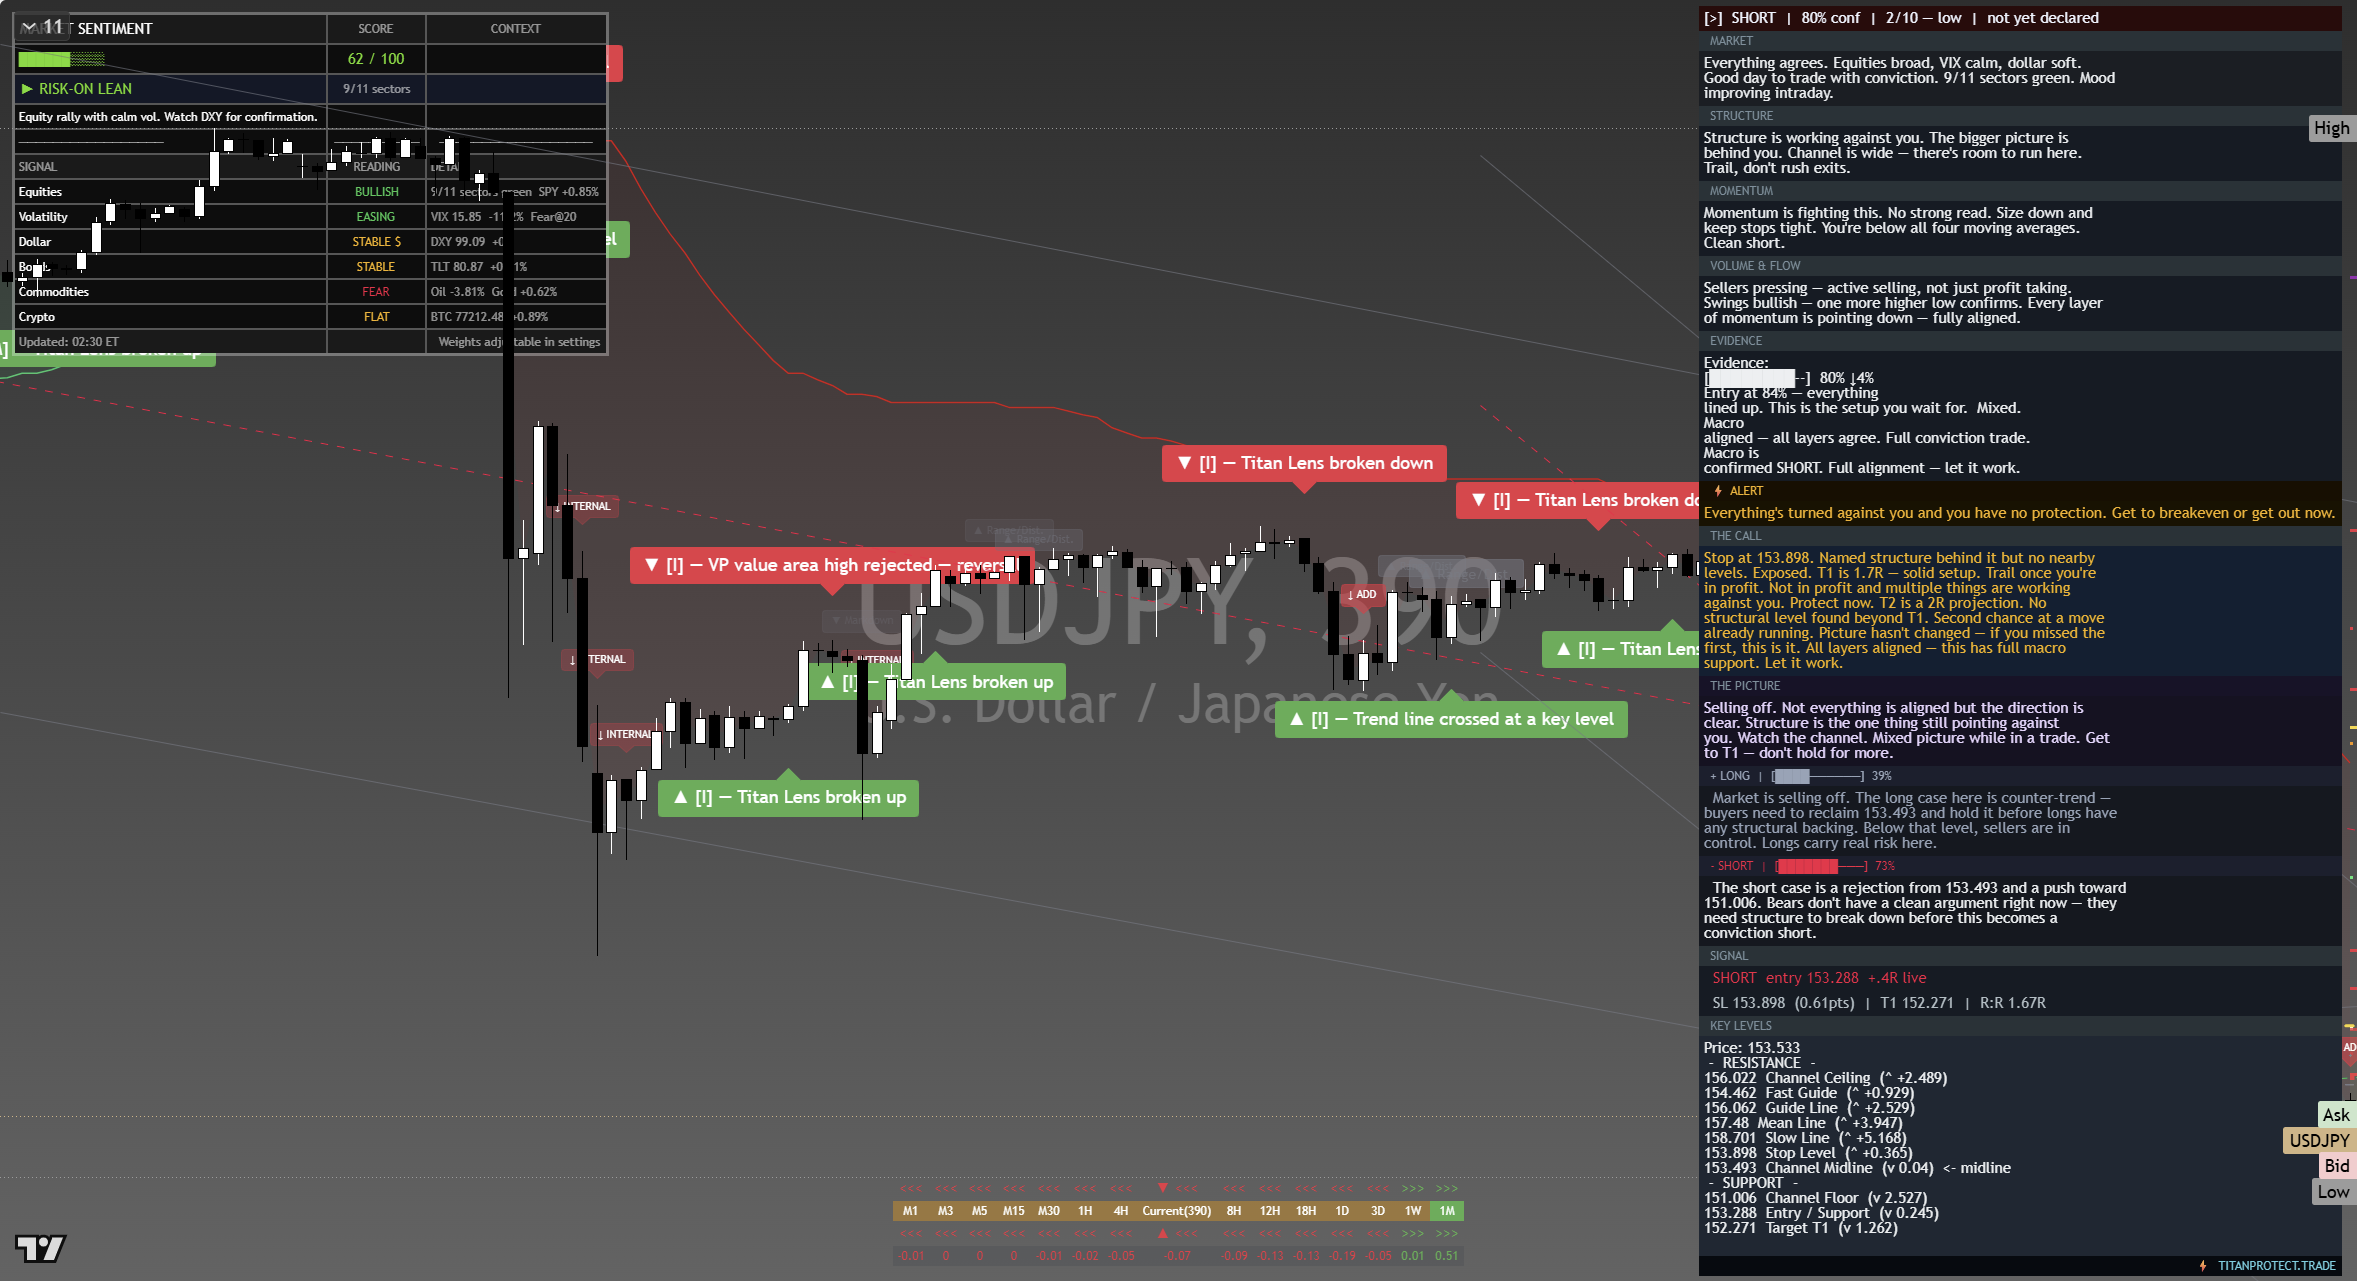
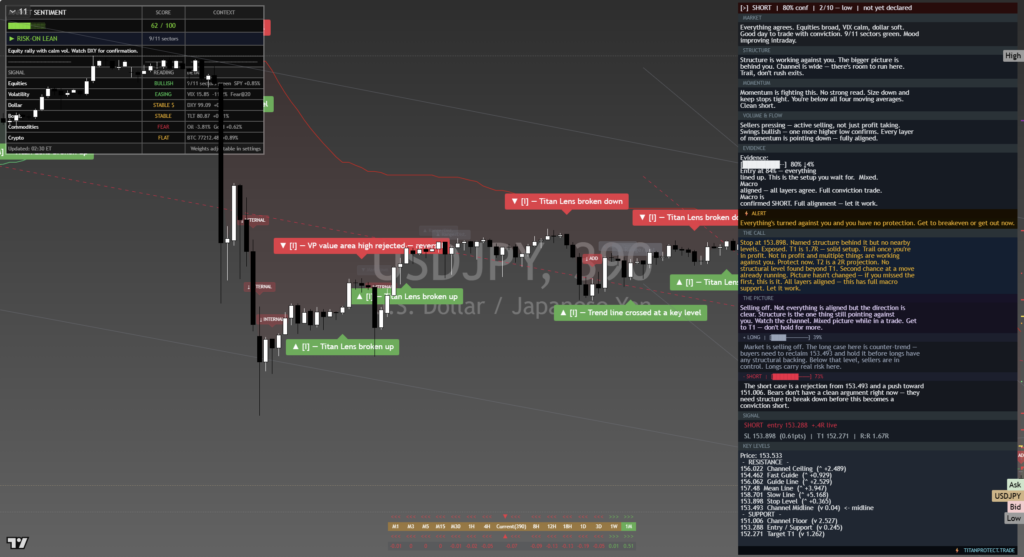
The chart above is the full daily read: structure, momentum, the levels that matter, and where the current price sits against them. Read it top to bottom for the complete picture, and pair it with our session briefs for the wider market context.
This is analysis, not financial advice. It reflects our multi-factor framework and is not a recommendation to buy or sell. Always do your own research and manage your risk.