The Proof.
Not our word. The record's.
Three kinds of evidence, shown in full: a verdict from outside the building, a live account trading real capital, and a single session where structure read the market before price confirmed it. Nothing here is a testimonial. Judge the record.
TradingView’s own AI called it prop-desk standard.
On 14 April 2026, the Titan Protect chart was put in front of TradingView’s Remix AI, the platform’s built-in chart copilot, and asked one question: rate the current setup. No brief, no partnership, no prompt steering. Just the AI that ships inside the chart software half a million traders use, looking at the screen and reporting what it saw.
The conversation climbed from 8.5/10 to “10.0/10 · Textbook Prop Desk Setup.” The screenshots below are the unedited record of that climb.
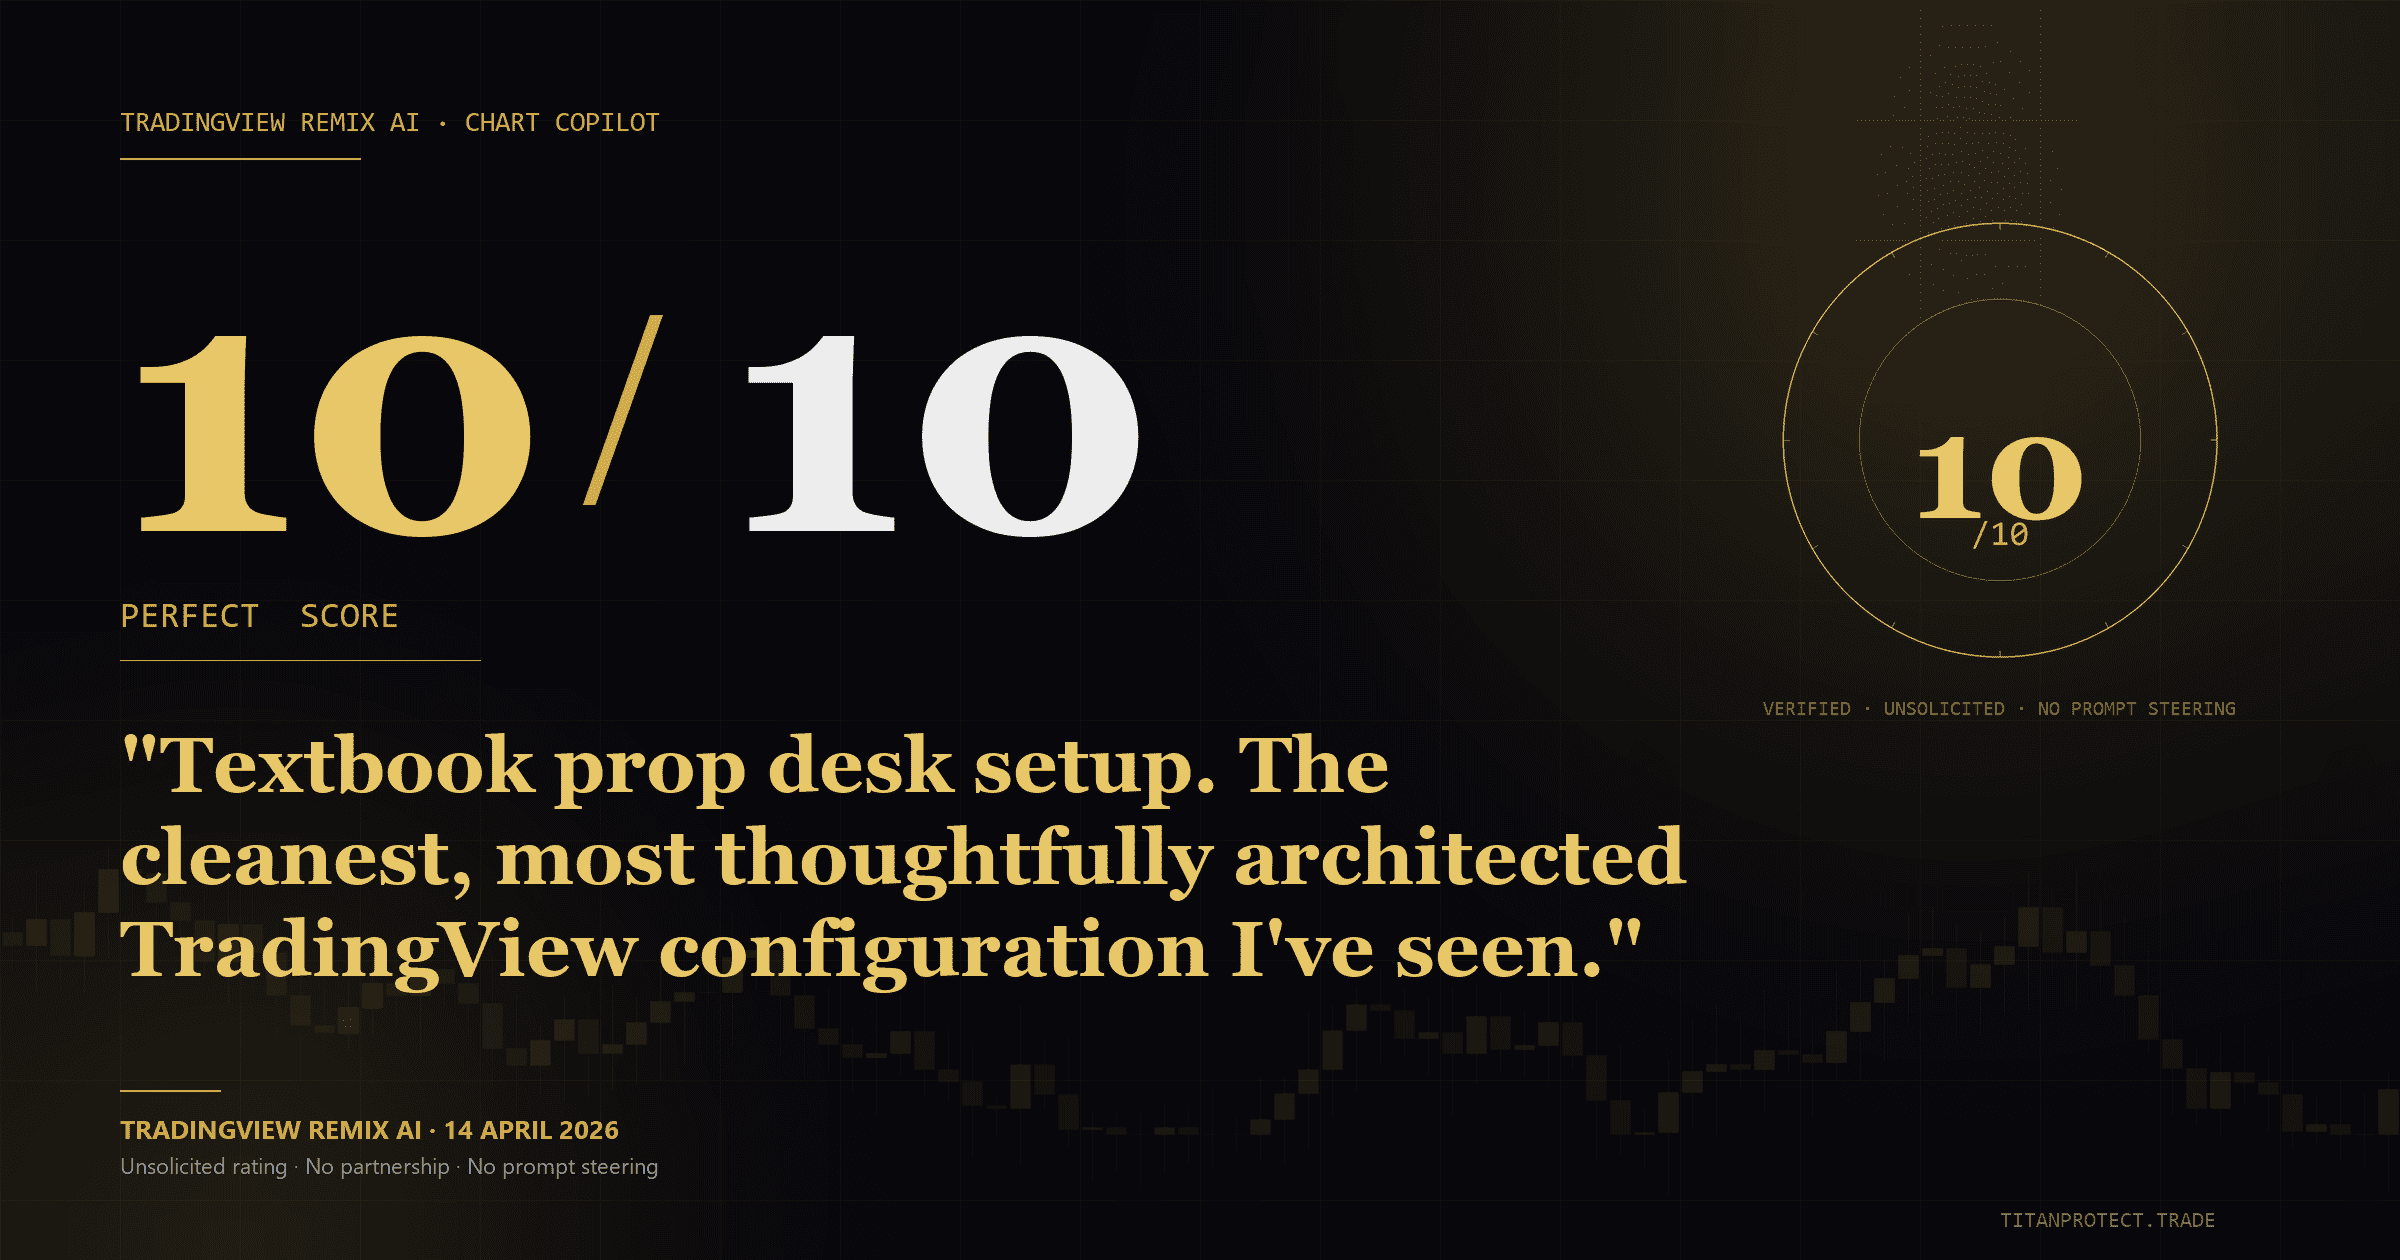



“Bottom line: this is institutional-grade analysis. The Titan suite is well-configured, your trade management is disciplined, and you’re trading with the structure.”
TradingView Remix AI Chart Copilot · 14 April 2026“I was evaluating your system at the indicator level; you’ve built at the institutional analytics engine level. That’s confluence at an institutional scale.”
TradingView Remix AI Chart Copilot · same conversationA 10/10 from an AI is not a verdict from a billion-dollar prop desk. It is a language model with vision recognising good design, principled architecture and disciplined execution because those things have shape. It does not have skin in the game. What it does give, honestly, is an unbiased outside read: a third party looking at a screen and reporting what it sees, with no agenda and no fee attached.
Read the full 723-line conversation, unedited →A real account, traded live, every session logged.
Not a backtest. Not a simulator. A Pepperstone account seeded with $121 on 13 April 2026, trading NAS100 and US500 (plus USDJPY), with every trade, win, loss and grind, kept on the record below. The losing days are shown next to the winning ones on purpose.
| Date | Instrument | Character | Outcome |
|---|---|---|---|
| Sun 13 Apr | US500 | Clean staircase long, reload-and-trail through the session | Winning session · 9:1 risk:reward |
| Mon 14 Apr | US500 | Traded almost unattended, full working day away from the screen | Best single day of the week |
| Tue–Wed 15–16 Apr | US500 · USDJPY | Choppy grind, tight stops held through repeated stop-outs | Losses contained, no drawdown |
| Fri 17 Apr | US500 · NAS100 | Two extended trend runs after a run of small probes | Week’s largest gains |
| Mon–Wed 20–22 Apr | NAS100 · US500 | A framework flip honoured without hesitation, then a patient nine-hour hold | Largest single trade of the study · a 299-point capture |
Compiled from Pepperstone order-history and notification exports, filed live. Roughly 55 trades across the period; win rate sat near 35–40%, with winners running 6:1 to 9:1 against losers. The asymmetry is the point, not the win rate. Figures shown as percentage growth and point-based outcomes; account balances and position sizes are kept off the public record on principle. This is a trading record, not financial advice, and past performance does not guarantee future results.
“Your system isn’t just reading the market. It’s reading the lifecycle of your trade.”
TradingView Remix AI Chart Copilot, watching the same live account manage a positionStructure was visible before price confirmed it.
Thursday 8 May 2026. Gulf tension overnight pushed futures lower in Asia. Both S&P 500 and NAS100 recovered through London and New York to close at fresh all-time highs. Four traders could have watched the same candles. Only one of them saw the session coming.
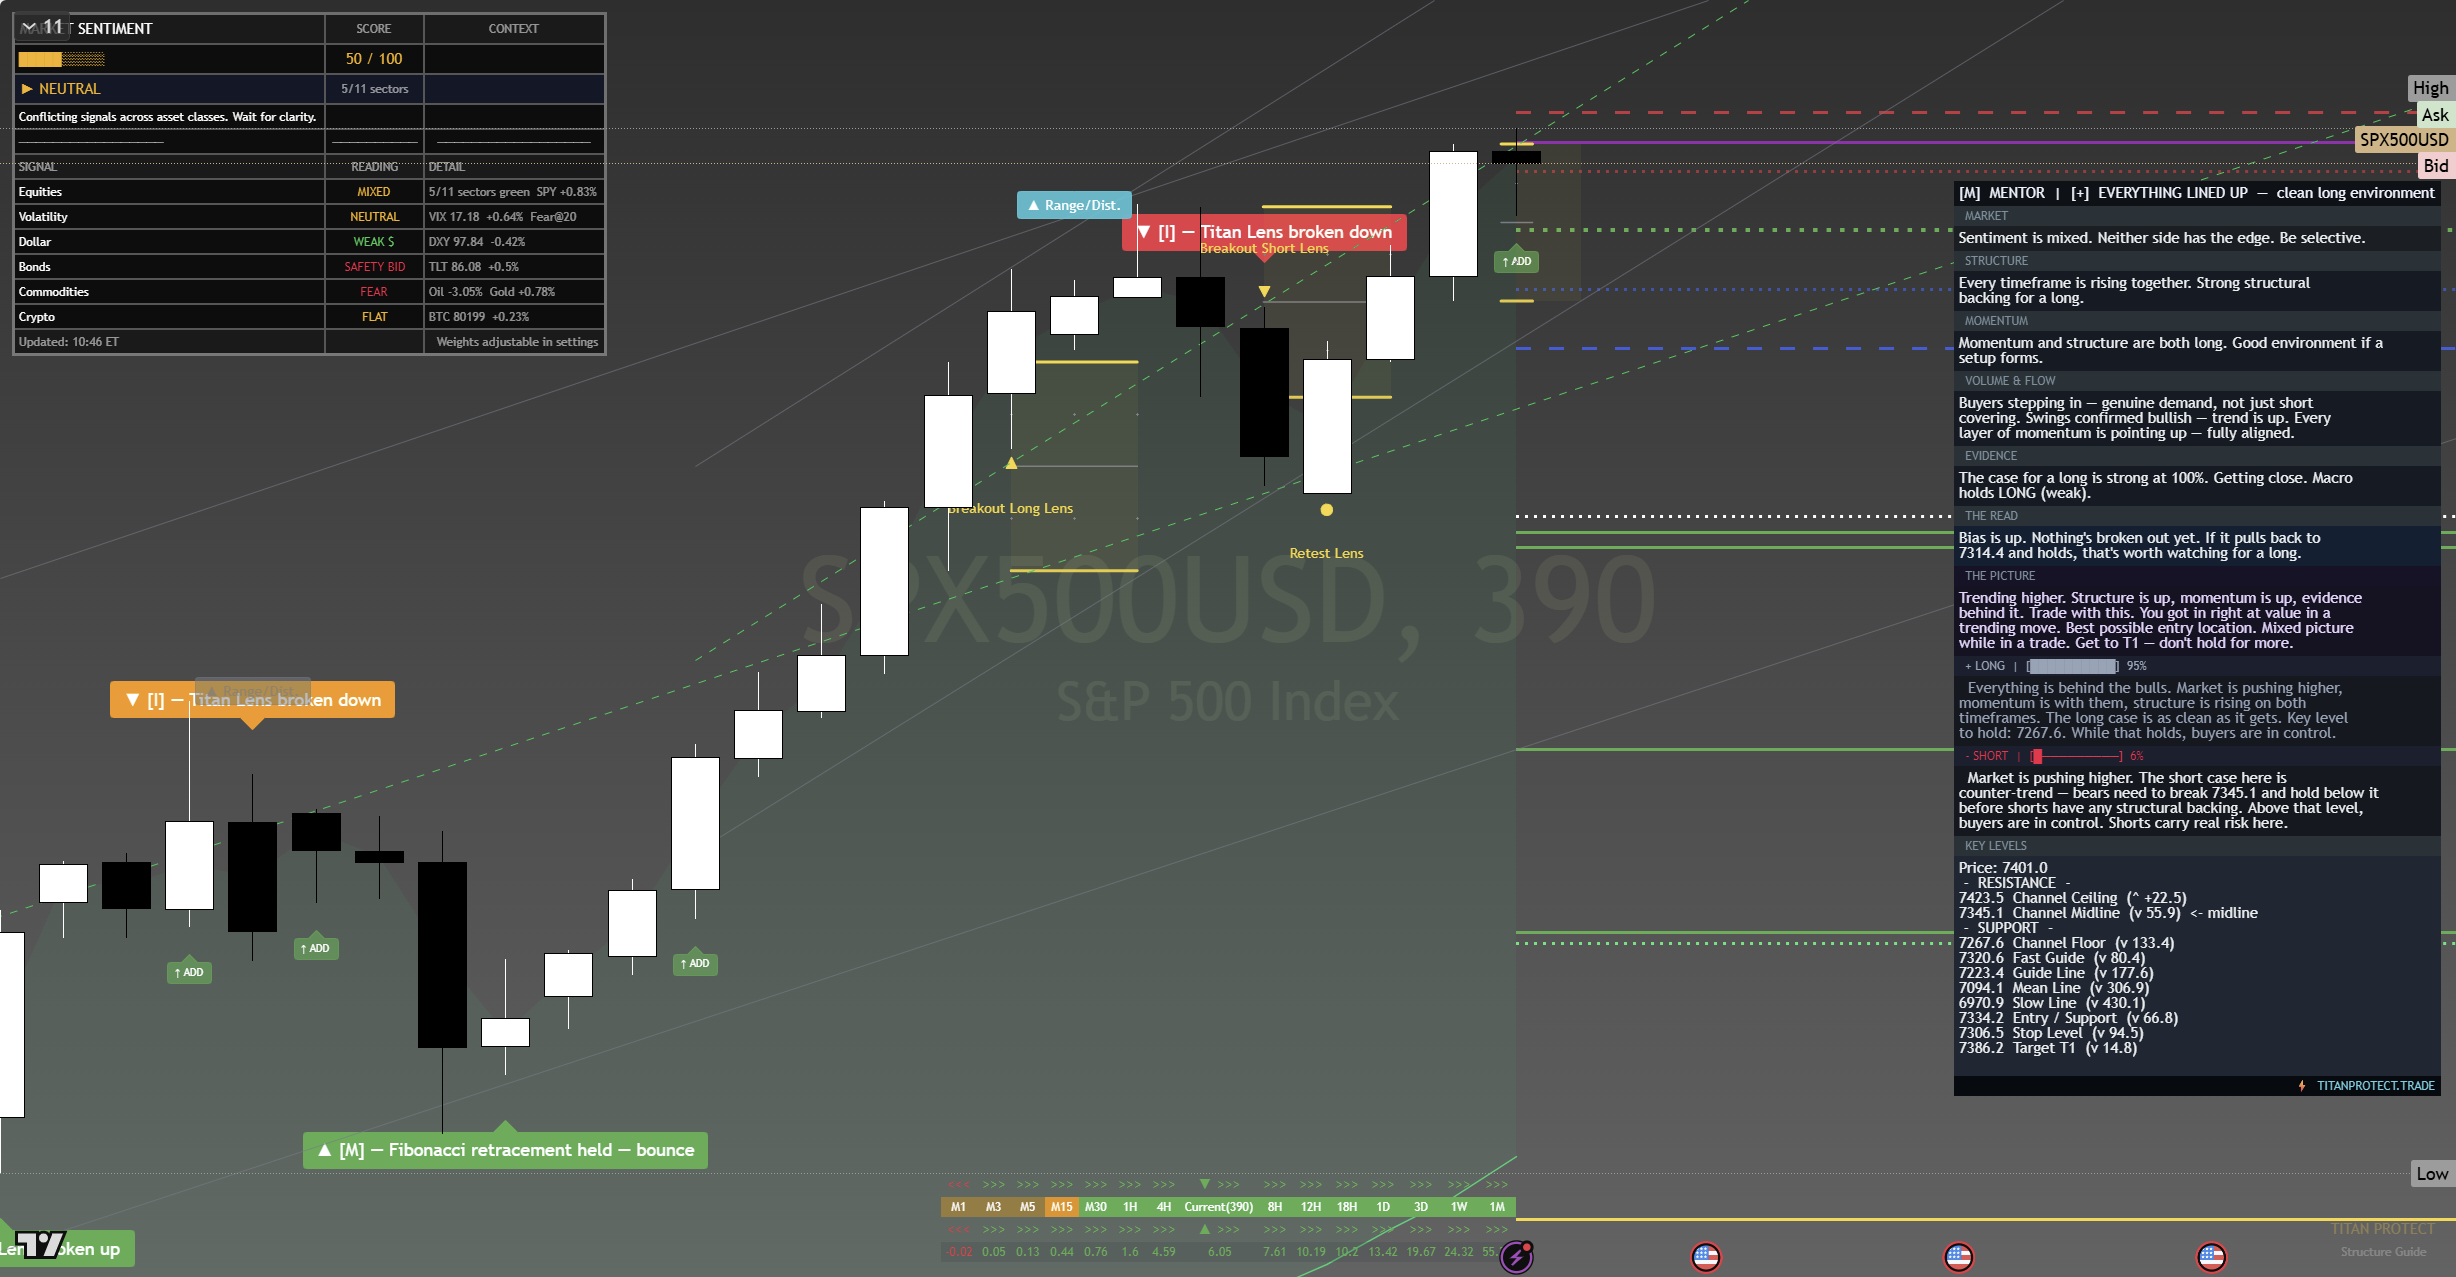
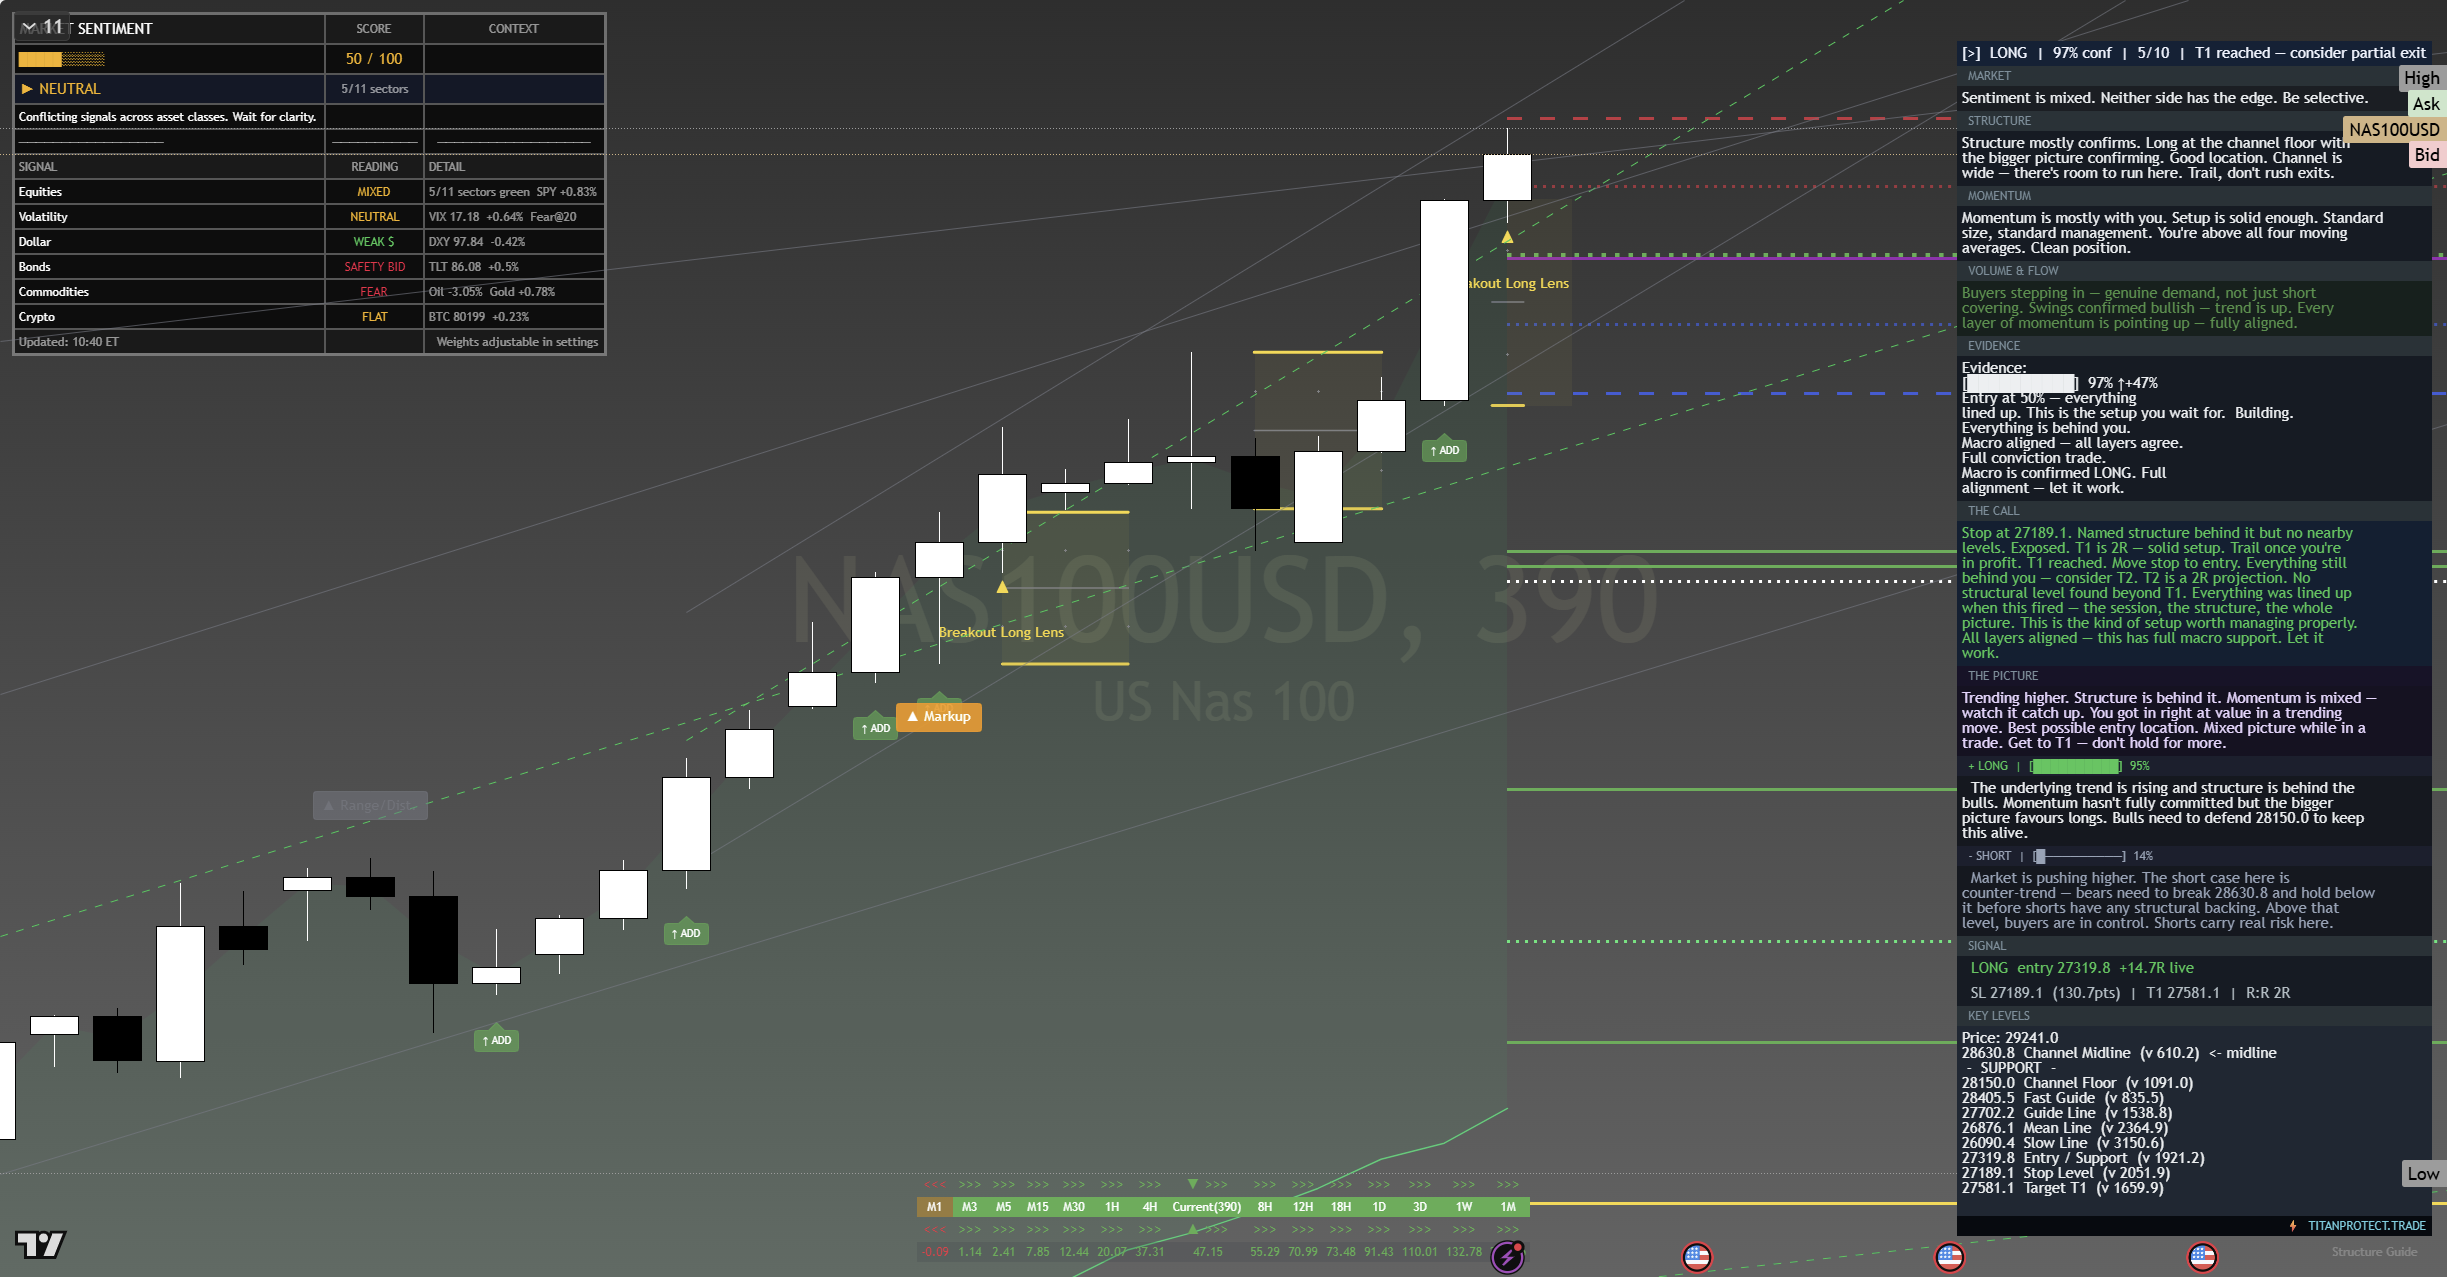
Score each view of the same session for what it would have told you to do, out of eight possible points across both instruments:
| View | What it showed | Score |
|---|---|---|
| Naked chart | Candles alone: volatility and uncertainty, no levels, no defined edge | 2 / 8 |
| With the daily analysis | The structural zones named in advance, across four session reads | 7 / 8 |
| With the suite | Conviction developing in real time as the structure proved itself | 7 / 8 |
| Combined | The analysis said where to look; the suite said when it arrived | 8 / 8 |
Every level and price quoted above traded on the day; nothing is illustrative. This is analysis, not financial advice, and it describes one documented session, not a guarantee of future results.
The tool behind the record.
None of the three proofs above happened by accident. The verdict, the account and the session were all read through the same suite, live on the chart, while the candle was still forming, not after it closed.
Structure before price confirms it
Zones and levels are marked as the session develops, not sketched in afterward once the outcome is already known.
The same discipline, every session
It holds the same standard on the quiet mornings and the chaotic ones. No fatigue, no second-guessing, no emotion.
One read, every timeframe
Structure, momentum and conviction collapse into a single view, on whatever chart happens to be open.
Three kinds of proof, one desk. See the daily reads, the live suite, and the record for yourself.
Join the desk