Russell 2000 (RTY) – Daily Read
13 October 2026 | Index | Titan Macro Desk
2,794.5
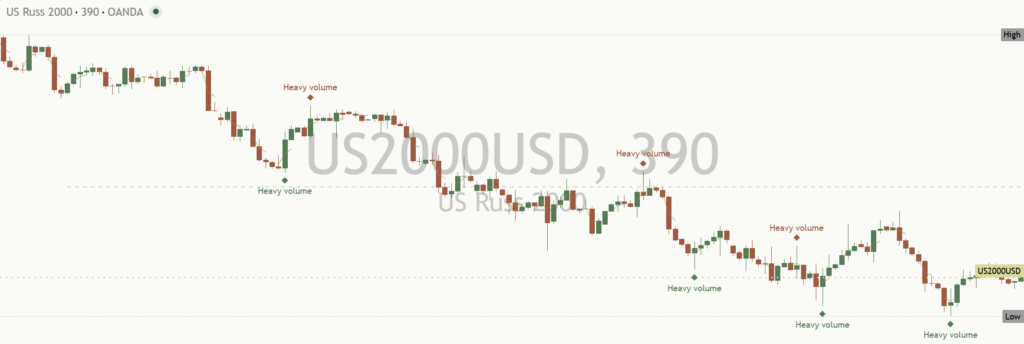
Russell 2000 at 2,794 is testing whether weakness is becoming exhaustion or developing into another leg lower. The last session finished 0.4 percent lower, leaving the index down near the floor of its one-month range. The near-term view remains cautious because price is pressing support while the broader structure still points downward. That matters for the wider equity market because smaller companies often provide a cleaner reading of domestic risk appetite than stronger headline indices.
The one month average at 2,833 now acts as an overhead dividing line because price is below it, and the structure reads as a downtrend, price under both its one-month and longer averages. Momentum is roughly 0.8 percent down over the last two weeks, which means the decline is persistent rather than disorderly. Small-cap sensitivity to financing conditions and domestic growth expectations helps explain why RTY has struggled to regain traction when investors remain selective about balance-sheet quality and earnings resilience.
The first nearby reference is 2,800, which matters because it is a round number handle sitting just above the last price and can quickly reveal whether demand is strong enough to recover lost ground. Holding above it would improve the immediate tone, but 2,833 would still need to be reclaimed before the structure begins to stabilize. Higher up, the month swing high at 2,953 stands about 5.7 percent above the current price and represents the major resistance controlling the broader recovery case. Below, a shelf of support at 2,763 sits about 1.1 percent below, while 2,750 is the next round number handle. The three month range of 2,756 to 3,070 reinforces this zone because its lower boundary closely overlaps those nearby defenses.
The bull path is straightforward: if 2,763 continues to hold, then a recovery through 2,800 can challenge 2,833, where sustained acceptance would weaken the downtrend and shift attention toward 2,953. A decisive move above 2,953 opens the path toward 3,070 because it would clear the month swing high and place price back against the upper edge of the three month range. The bear path is equally clear: if rebounds fail beneath 2,800 and 2,833, then pressure remains concentrated on 2,763. Losing 2,763 exposes 2,750, which means the market would be probing beneath the established range floor rather than merely retesting it.
The main risk to the cautious view is a forceful recovery through 2,833 followed by sustained strength toward 2,953, because that sequence would show that support has attracted durable demand and that the recent weakness was contained. The bullish read is invalidated if 2,763 fails and 2,750 cannot stabilize price, because the overlap between the shelf and the three month range floor would no longer be defending the structure. Net, RTY remains vulnerable at 2,794, but the downside is not confirmed unless that support cluster breaks.
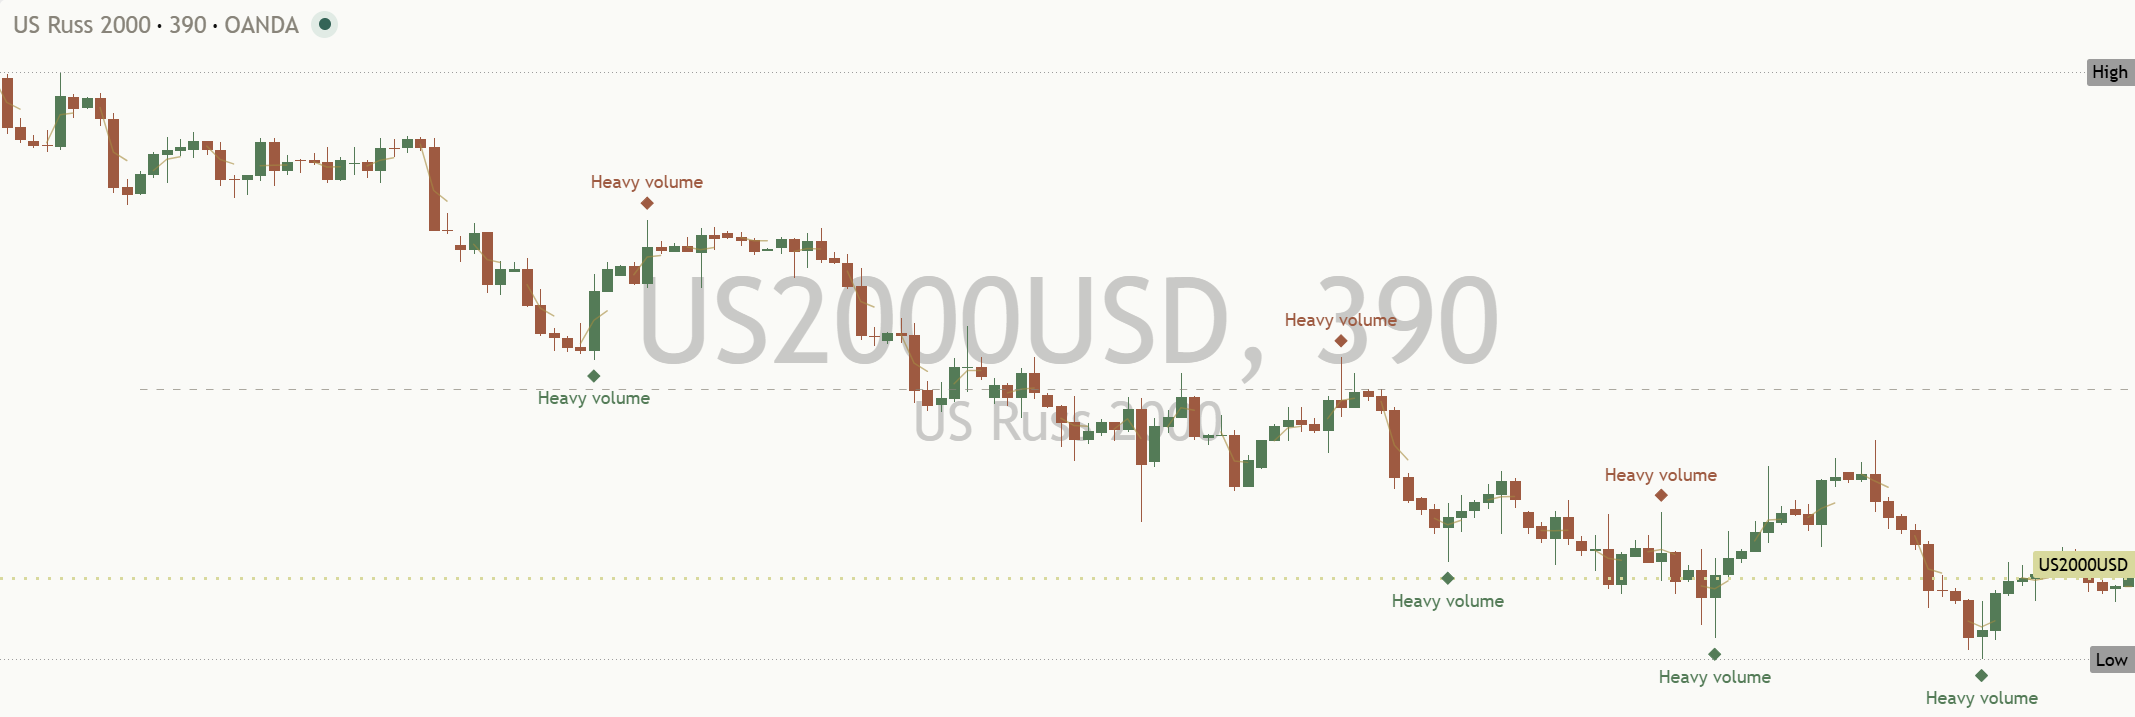
Key levels: support 2,763 (1.1% below), resistance 2,953 (5.7% above), one-month average 2,833, three-month range 2,756 to 3,070.
This is analysis, not financial advice. Always do your own research and manage your risk.