Leading Sector Moves
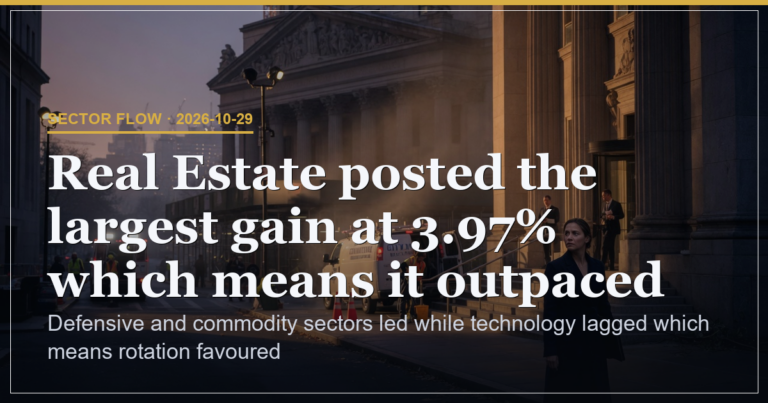
Real Estate rose 3.97% which means rate sensitive areas produced the widest advance because property equities responded to the session stability. Energy gained 3.16% because commodity exposure delivered the second largest move which means the sector widened its gap over communication services at 0.73%. Utilities advanced 3.01% which means defensive sectors matched the cyclical lift in basic materials at 2.07%. The single largest gain at 3.97% exceeded the next sector by 0.81 percentage points because real estate outpaced every other group by the widest margin.
| Sector | Change | Implication |
|---|---|---|
| Real Estate | 3.97% | Led advance as rate sensitivity dominated |
| Energy | 3.16% | Commodity support drove second place finish |
| Utilities | 3.01% | Defensive strength matched basic materials at 2.07% |
| Consumer Defensive | 2.29% | Stability names added to defensive average |
| Financial | 1.90% | Rate sensitivity extended beyond real estate |
Rotation Dynamics
Energy eased 0.03 percentage points from the prior 3.19% reading which means the rotation held steady rather than accelerating. Real estate retained the widest lead because its 3.97% gain still exceeded every other sector by the largest margin. Technology lagged at 0.62% which means the advance stayed selective and excluded growth areas. Consumer cyclical at 0.82% and industrials at 0.92% trailed the leaders because cyclical breadth remained uneven.
Defensive versus Cyclical Tilt
Utilities at 3.01% and consumer defensive at 2.29% produced defensive gains that matched the cyclical move in basic materials at 2.07% which means both sides contributed to the broad advance. The mixed tilt shows rate sensitive and commodity groups moved together because the session stability supported income names alongside upstream pricing. Communication services at 0.73% and healthcare at 1.34% posted smaller lifts which means the rotation avoided pure growth exposure.
| Experience Level | What to Watch on Tape |
|---|---|
| Beginner | Track which sectors post the largest percentage gains and compare them to the prior session |
| Intermediate | Measure the gap between real estate and the next sector to gauge rotation persistence |
| Advanced | Observe whether defensive and cyclical groups sustain equal percentage moves into the next close |
Risk Assessment
Risk sits at 28% because the absence of support or resistance levels in the data slice leaves the rotation without clear anchors. The mixed defensive cyclical advance therefore carries uncertainty until clearer boundaries emerge from price action.
Scenario Analysis
45% odds hold if real estate sustains above 3.5% while energy stays above 2.8% because that combination would confirm continued rotation leadership. 35% odds apply if technology closes above 1.0% because that shift would broaden participation beyond rate and commodity names. 20% odds remain if utilities fall below 2.0% because that break would signal defensive leadership fading.
Broad sector gains led by real estate and energy produced a mixed defensive-cyclical advance.
This is analysis, not financial advice. Always manage your risk.