Leaders and Laggards
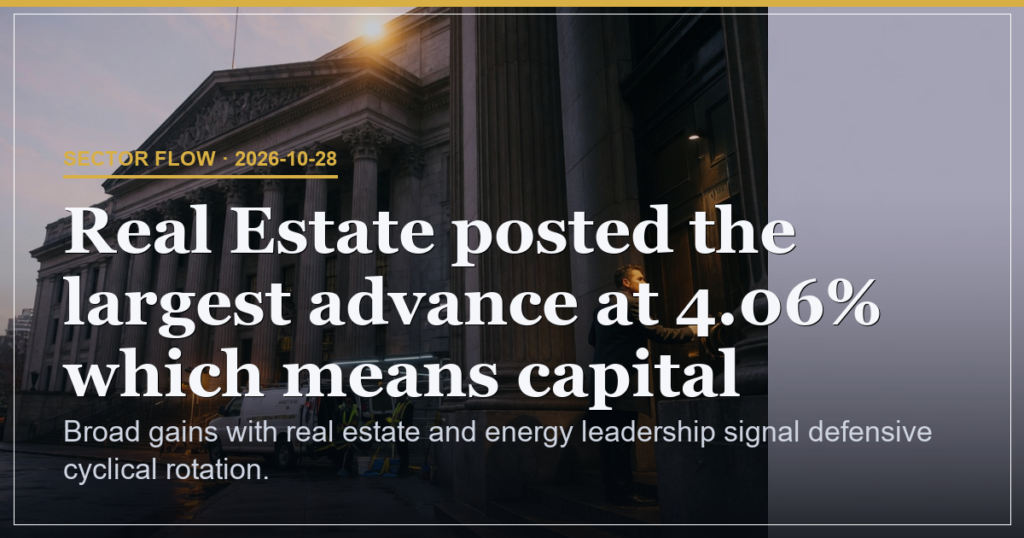
Real Estate posted the largest advance at 4.06% which means capital rotated into rate sensitive sectors because the group outpaced every other reading by the widest margin. Energy gained 3.22% because commodity linked strength drove outperformance and lifted the barrel price contribution. Utilities climbed 3.06% because defensive tilt supported gains while cyclical names like consumer cyclical at 0.81% trailed. Technology advanced only 0.57% which means growth sectors lagged the broad move and limited participation from high valuation areas. The 0.03 percentage point increase in real estate from the prior 4.03% reading shows the rotation gathered a fraction more momentum because property outpaced every other group by the widest margin.
| Sector | Change | Implication |
|---|---|---|
| Real Estate | 4.06% | Largest advance signals concentrated flow into rate sensitive areas |
| Energy | 3.22% | Commodity strength reinforces outperformance versus the 2.0% basic materials gain |
| Utilities | 3.06% | Defensive support holds while consumer cyclical at 0.81% trails |
Defensive versus Cyclical Tilt
Consumer defensive rose 2.36% because the group added to the defensive average that sat above the 0.9% industrials reading. Financials rose 1.9% which means banks and insurers added to the positive tape without leading it. Healthcare at 1.37% and communication services at 0.67% indicate moderate participation from those areas because both readings sat below the defensive average. Basic materials advanced 2.0% which means cyclical materials participated yet the overall tilt stayed defensive cyclical because real estate and utilities combined exceeded 7.0%.
| Sector | Change | Implication |
|---|---|---|
| Consumer Defensive | 2.36% | Defensive average exceeds cyclical consumer names at 0.81% |
| Financial | 1.9% | Moderate contribution without leading the rotation |
| Healthcare | 1.37% | Below defensive average limits breadth contribution |
Rotation Dynamics
Broad positive sector moves led by real estate and energy keep equities biased higher while levels remain intact because the 4.06% real estate print exceeded the 3.22% energy gain by 0.84 percentage points. The 0.57% technology advance means growth sectors lagged the broad move and reduced the contribution from high beta names. No support or resistance levels appear in the data slice.
Forward Scenarios
Real estate sustains above 4.0% carries 45 weight because continued rate sensitivity keeps the rotation intact. Energy follows above 3.0% triggers 30 weight because commodity strength would extend the defensive cyclical pattern. Technology catches above 1.0% holds 25 weight because a growth catch up would broaden participation beyond the current 0.57% print.
Risk Assessment
Risk sits at 30% because the 0.57% technology lag means limited breadth in the advance. The absence of dark pool top activity leaves the options read without offsetting large money confirmation which means the rotation could stall if real estate momentum fades by more than 0.5 percentage points from the 4.06% level.
Learning from the Tape
| Experience Level | What to Watch |
|---|---|
| Beginner | Track which sectors post the largest daily percentage changes and note their link to rate moves |
| Intermediate | Compare the gap between real estate 4.06% and technology 0.57% to measure defensive versus growth participation |
| Advanced | Observe the 0.03 percentage point real estate increase from the prior session to gauge rotation momentum persistence |
Broad gains with real estate and energy leadership signal defensive cyclical rotation.
This is analysis, not financial advice. Always manage your risk.